ISSN 0104-6632 Printed in Brazil
www.abeq.org.br/bjche
Vol. 31, No. 02, pp. 373 - 384, April - June, 2014 dx.doi.org/10.1590/0104-6632.20140312s00002468
*To whom correspondence should be addressed
Brazilian Journal
of Chemical
Engineering
METHANE PRODUCTION IN ANAEROBIC
DIGESTION OF ORGANIC WASTE FROM RECIFE
(BRAZIL) LANDFILL: EVALUATION IN REFUSE
OF DIFERENT AGES
W. N. Schirmer
1*, J. F. T. Jucá
2, A. R. P. Schuler
3, S. Holanda
2and L. L. Jesus
21Environmental Engineering Department, Phone: + (55) (42) 34213216, Center-West of Parana State University, Irati, Rodovia PR 153 km 07, 84.500-000, Riozinho Square, Irati - PR, Brazil.
*
E-mail: [email protected] 2
Civil Engineering Department, Phone: + (55) (81) 21267215, Federal University of Pernambuco, Av. Hélio Ramos, Cidade Universitária, 50740-530, Recife - PE, Brazil. 3Chemical Engineering Department, Phone: + (55) (81) 21268712, Federal University of
Pernambuco, Rua Artur de Sá, Cidade Universitária, 50740-521, Recife - PE, Brazil.
(Submitted: December 27, 2012 ; Revised: July 28, 2013 ; Accepted: July 28, 2013)
Abstract - This work focuses on monitoring the generation of biogas by biochemical methane potential (BMP) assays, commonly used to assess anaerobic biodegradability of solid and liquid wastes under controlled conditions. The experiment employed 5 g of substrate of both refuses (fresh and one-year-old wastes), digested with 250 mL of inoculum in 1 L flasks as bioreactors (all of them in triplicate, operating under batch conditions at ± 35 ºC). Despite the difference of age of both refuses evaluated, there was no significant differences in volume (near 1800 mL) and composition (55% methane) of biogas generated in 80 days of incubation under mesophilic conditions. The important parameters of both refuses (such as moisture content, volatile solids and chemical oxygen demand) also showed very similar initial values.
Keywords:Biochemical methane potential (BMP); Hydrogen sulfide; Methane; Odor; Municipal solid waste (MSW).
INTRODUCTION
In Brazil, landfill is the main destination of urban refuse, due to operational factors as well as cost (Alcantara, 2007). According to data from the Brazilian Geography and Statistics Institute (IBGE, 2008, in the Brazilian abbreviation), 50.2% of the refuse is disposed of in landfills. In developing countries such as Brazil, about 50% of the municipal solid waste is composed of organic matter (Alves, 2008; Bidone and Povinelli, 1999). This points to the importance of studying the behavior of such refuse in
the landfill, its degradation kinetics and the parame-ters that influence the stabilization process of the re-fuse organic fraction the most, particularly in an an-aerobic environment.
temperature, buffering capability, nutrient availabil-ity and oxygenation rate (Castilhos Jr. et al., 2003). Anaerobic digestion is a process in which a combina-tion of bacteria acts to degrade the refuse through different mechanisms and biodegradation phases. The efficiency of the anaerobic digestion process depends directly on the environment, the operation and the start up conditions of the process. In this case, the bacteria must find an oxygen-free environ-ment, with pH close to neutral, suitable temperature, and enough humidity, nutrients and alkalinity, among other parameters relevant to the process (Rajeshwari et al., 2000; Tchobanoglous et al., 1993).
Under anaerobic conditions, the biodegradable refuse fraction is biologically converted into a gas, in which the main constituents are methane, carbon di-oxide, nitrogen, oxygen, ammonia, hydrogen, sul-phur compounds, and carbon monoxide. Other gases in trace level concentration, usually below 1% in volume, might present a risk to human health, due to the toxicity that many of the compounds present (Allen et al., 1997; Castilhos Jr. et al., 2003; Pagé et al., 2007; Rasi et al., 2011; Tchobanoglous et al., 1993).
According to Capelli et al. (2007), another impor-tant aspect regarding the environmental impact of landfills is the emission of odor associated with its management operations and final deposition of re-fuse under anaerobic conditions. Landfills are among the main odor sources and are responsible for the emission of a variety of odorant gases, most of them present in low concentrations (Bowly, 2003; Pagé et al., 2007; Sironi et al., 2005). Although the landfill odor is the result of a complex mixture of several compounds (Stretch et al., 2001), the most represen-tative among them in terms of odor is hydrogen sulfide (H2S) (Kim et al., 2005; Kim, 2006), together with other organosulphur compounds, aldehydes and carboxylic acids. The combination of the individual odors of these compounds (all with different limits of detection) gives the characteristic odor of the landfill gas (Karnik et al., 2003; Odorizzi et al., 2003). USEPA (1991) observed that the landfill odor originates both from the refuse degradation process (decomposition anaerobic phases) and from the previously disposed refuse in the landfill (painting products, solvents, pesticides, adhesives, etc.). This odor results mainly from chemical groups such as organosulphur com-pounds, esters, alkylbenzenes, limonene, among other hydrocarbons responsible for the characteristic land-fill odor. For Senante et al. (2003), the odor of landfills has as main sources the leachate, fresh refuse and biogas. In this case, the odorant com-pounds can belong to the following chemical groups: sulphur compounds, nitrogen compounds, aldehydes, acids, ketones, alcohols, aromatic compounds, esters,
and chlorinated compounds. Still, although hydrogen sulfide is the main odorant present in landfill gas, due to its very low limit of odorant perception, other compounds are also responsible for the characteristic landfill odor (Haarstad et al., 2003). Odorizzi et al. (2003) point to two techniques to determine odor: analytical methods, which determine the chemical composition of odorant gases; and olfactometry, a sensorial method which measures the human percep-tion of odor. The analytical methods include, for example, portable instruments and gas chromatogra-phy (Karnik et al., 2003; Pagé et al., 2007; Schirmer, 2004). Regarding olfactometry, the detector for odor evaluation is the olfaction system, in charge of dis-criminating and identifying the odorant compounds (Belli Filho and Lisboa, 1998).
In accordance with Rasi et al. (2011), the produc-tion and composiproduc-tion of the generated biogas might vary temporally and spatially in the landfill, due to the different ways the landfill is filled or even the diversity of materials used to fill it. The biogas com-position will depend on other properties of these resi-dues. These properties can comprise the kind of refuse (composition) and age, humidity, pH, tem-perature, density, etc. (USEPA, 1991).
Important parameters to determine the organic matter stabilization are the ratio cellulose/lignin (C/L), the volatile solid content (VS) of the residual mass (broadly employed due to its low cost; besides, it is easy to obtain), and biochemical methane potential (BMP) analysis (Hansen et al., 2004; Kelly et al., 2006). The biochemical methane potential (BMP) assay can measure a small fraction of refuse, usually incubated with inoculums and in an anaerobic environment, that can be effectively converted into biogas. Besides those, complementary parameters might be the chemical oxygen demand (COD), alka-linity, and the sample humidity content. The rate at which the substrates will degrade is highly depend-ent on these properties (Labatut et al., 2011).
Brazilian Journal of Chemical Engineering Vol. 31, No. 02, pp. 373 - 384, April - June, 2014
different units in which results are presented (Angelidaki et al., 2009).
This study monitored the generation of biogas (generation rate and composition) from the degrada-tion of the organic fracdegrada-tion of municipal solid waste of two different ages (fresh and 1 year old) from Recife (Brazil), in batch reactors using the BMP method. Besides the evaluation of the biogas genera-tion potential of this refuse, the study monitored methane, carbon dioxide and hydrogen sulfide gases (the latter as odorant) throughout the biodigestion period, in order to follow the evolution of gas forma-tion in the different phases of refuse degradaforma-tion.
MATERIALS AND METHODS
Refuse and Inoculum Characteristics
The refuse was collected at the Jaboatão dos Guararapes municipal landfill, which serves the met-ropolitan region of Recife, Brazil. This region has, nowadays, about 3.3 million inhabitants, 43% of these correspond to the city of Recife (Recife, 2012). Only the organic fraction was chosen to be worked with, and plastic, textile, metal, paper, and wood (the last two with high lignin content) artifacts were removed, as well as others with difficult or prolonged degradation time. The procedures of sampling (dug up with a back-hoe) followed Method NBR 10.007 (ABNT, 2004).
Organic refuse of two different ages were evalu-ated (1 day, before burial, and 1 year) in order to assess the biogas generation potential of each one, as well as the hydrogen sulfide (H2S) emissions resulting from the biodigestion of each one. These two ages was chosen according to ease of access as well as the short time of landfill operation. In order to guarantee homogeneous samples, young refuse was collected in three different waste piles and the old refuse at three points of the one year old cell (three sub-samples of each refuse); these sub-samples were homogenized, as described in Method NBR 10.007. The amount of refuse necessary for all the characteri-zations of the sample (assays and analysis) was 1 kg of each refuse.
Haarstad et al. (2003) claim that different kinds of refuse yield different kinds of odor. Besides that, the biogas composition is highly dependent on the
refuse composition and its decomposition phases (Allen et al., 1997). The concentration of trace compounds tends to decrease with the refuse age (Knox et al., 2005), and that is why it is important to evaluate refuses of different ages and, therefore, different decomposition stages.
The refuse was collected on the same day at the municipal landfill in Recife and was preserved in plastic bags. The refuse was dried in an oven at 60 ºC up to the point where no mass variation was ob-served. The refuse was then ground, presenting ap-proximately the following granulometric ranges, in % of retained mass measured in 5 sieves: 22% Mesh/ Tyler 65 (0.212 mm); 28% Mesh/Tyler 48 (0.297 mm); 34% Mesh/Tyler 28 (0.590 mm); 12% Mesh/Tyler 14 (1.18 mm); 4% Mesh/Tyler 8 (2.36 mm). The grinding aims to guarantee the homogeneity, besides increas-ing the refuse superficial area, because the size of the substrate particles is an important parameter in the biogas production rate (process reactivity) (Angelidaki et al., 2009; Bidone and Povinelli, 1999; Labatut et al., 2011).
The inoculums relative volume used in the ex-periment can vary a lot, depending on its characteris-tics (Angelidaki et al., 2009). In this study, the substrate/inoculum ratio kept the same proportion as that in the studies of Alves (2008) and Maciel (2009), that is, 1:50. Anaerobic digestion sludge was used as inoculum, from the wastewater treatment plant in Recife, the same plant which supplied the sludge used in the Alves (2008) and Maciel (2009) studies.
BMP Assays: Sample Preparation
The biodigesters consisted of 1 liter borosilicate flasks, sealed with lids with manometer and valves for the discharge and biogas monitoring. Thus, in each flask, the equivalent of 5 grams of substrate (dry matter) and 250 mL of inoculum were depos-ited. Each assay was performed in triplicate, so that the reproducibility of assays was guaranteed. Blank assays were also employed, that is, flasks (also in triplicate) containing only 250 mL inoculum without any substrate. The average methane produced by the blanks, due to the presence of inoculum only, was subtracted from the methane production in flasks containing substrate + inoculum. Table 1 summa-rizes the sample conditions.
Table 1: Characteristics of refuse used in the experiment.
Assay (sample) Waste age Observations
NW1 New waste (same day) Flask with fresh refuse, dryed in incubator and ground. OW2 One-year-old waste Flask with one year refuse, dryed in incubator and ground. INOC3 - Flask containing inoculum only, substrate free. (blank)
The parameters monitored of each refuse were: humidity, total organic carbon (TOC), total Kjeldahl nitrogen (TKN), pH, alkalinity, chemical oxygen de-mand (COD) and volatile solids (VS), all verified prior to and at the end of the digestion, regarding the characteristics of a batch process. Parameters were evaluated according to the Standard Methods for the Examination of Water and Wastewater (APHA, 1998; 2005).
Before sealing, the BMP bottles were gassed with nitrogen (N2) for 5 minutes so that the anaerobic environment conditions were guaranteed (headspace reactor) (Mshandete et al., 2004). Once sealed, the BMP flasks were placed in an incubator with con-stant temperature (35±2 ºC), appropriate to the meso-philic bacteria and, according to Khalid et al. (2011), suitable for the production of methane. During the incubation period, the batches were shaken at least 3 times a week, in order to homogenize the sample.
In Labatut et al. (2011, p. 2256), the BMP “test was ended when the cumulative biogas curve reached the plateau phase, usually after 30 days”. In this work, the incubation time was 80 days (from 24/march to 13/june), 20 days longer than suggested by Alves (2008), for similar refuses, inoculum and environ-mental conditions.
Gas Monitoring
Biogas Monitoring
The gas accumulated in the flask’s headspace was constantly monitored, in order to follow the gas gen-eration (verified through the pressure in the ma-nometers) and its composition. The frequency of biogas collection depended on the accumulation of generated gas, since all the analyses required a mini-mum amount of sampled gas. Gases were collected in Tedlar bags (1 L capacity, SKC, USA) with two valves (one of them with a rubber stopper for collec-tion with a micro-syringe). Before each sampling, bags were cleaned with N2 and entirely emptied, ensuring the same condition for all the samples.
The analyses of the generated biogas composition (methane and carbon dioxide) were carried out in a gas chromatograph with thermal conductivity detec-tor (GC/TCD, Appa Gold). The packed column was Porapak N, 80/100 mesh, with a length of 3.0 m. The injector, detector and furnace temperatures were 120 ºC, 150 ºC and 60 ºC, respectively. The hydrogen gas flow was 30 mL.min-1. The samples were col-lected from Tedlar bags and injected onto the chro-matograph using a gas-tight syringe.
Hydrogen Sulfide Gas Monitoring
In this study, the H2S concentrations were meas-ured with portable equipment Dräger model X-AM 7000, with electrochemical sensor and measuring range from 0 to 1000 ppm. The hydrogen sulfide was monitored on the same occasions that the biogas was measured, also from the Tedlar bags.
RESULTS AND DISCUSSION
Refuse Stabilization
Table 2 presents the total Kjeldahl nitrogen (TKN) values, moisture content, volatile solids (VS), chemical oxygen demand (COD), pH and alkalinity of fresh refuse (assay NW), old refuse (OW), and inoculums (IN), prior to and post 80 days of biodi-gestion.
According to USEPA (1991) and Andreoli et al. (2003), refuse with high humidity content (60 to 90%) might increase the gas generation rate. In fact, Alves (2008) verified that the higher the humidity percentage in the environment, the higher the biogas generation rate. The humidity values observed in this study for fresh and old refuse at the time of collec-tion were 68.1 and 67.3% (on a humid base), respec-tively. After the preparation of these samples (in-oculum addition to the ground refuse at the ratio 1:50), the humidity values were close to 90%; there-fore, highly suitable for the generation of biogas (Table 2).
Brazilian Journal of Chemical Engineering Vol. 31, No. 02, pp. 373 - 384, April - June, 2014
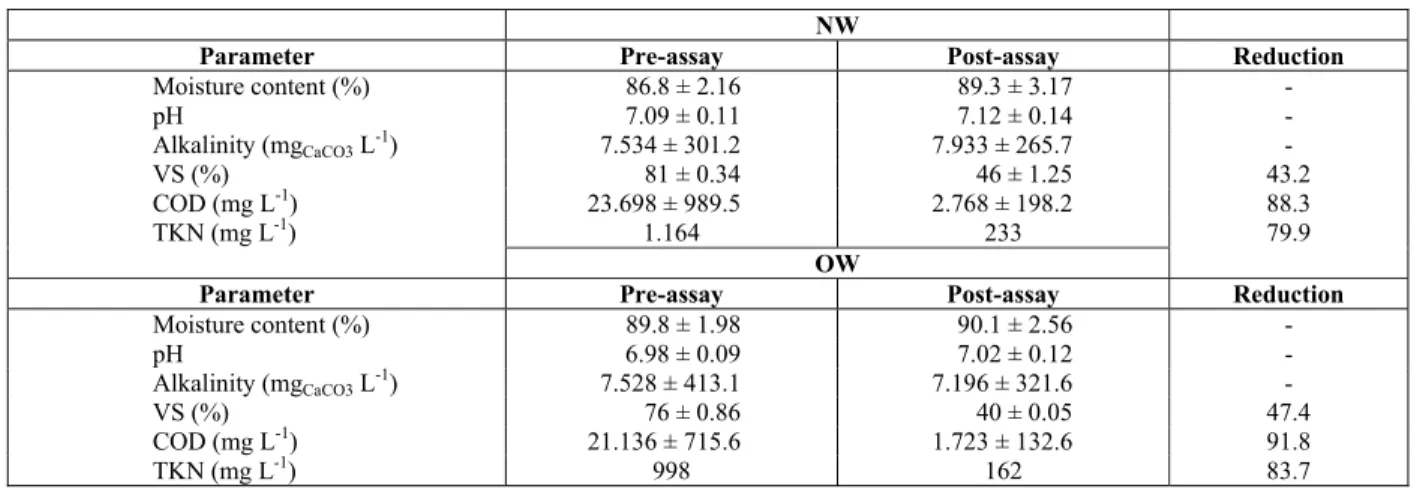
Table 2: Degradation parameters of fresh refuse (NW) and old refuse (OW) verified before and after the biodigestion process (with standard deviation).
NW
Parameter Pre-assay Post-assay Reduction
Moisture content (%) 86.8 ± 2.16 89.3 ± 3.17 -
pH 7.09 ± 0.11 7.12 ± 0.14 -
Alkalinity (mgCaCO3 L-1) 7.534 ± 301.2 7.933 ± 265.7 -
VS (%) 81 ± 0.34 46 ± 1.25 43.2
COD (mg L-1) 23.698 ± 989.5 2.768 ± 198.2 88.3
TKN (mg L-1) 1.164 233 79.9
OW
Parameter Pre-assay Post-assay Reduction
Moisture content (%) 89.8 ± 1.98 90.1 ± 2.56 -
pH 6.98 ± 0.09 7.02 ± 0.12 -
Alkalinity (mgCaCO3 L-1) 7.528 ± 413.1 7.196 ± 321.6 -
VS (%) 76 ± 0.86 40 ± 0.05 47.4
COD (mg L-1) 21.136 ± 715.6 1.723 ± 132.6 91.8
TKN (mg L-1) 998 162 83.7
- Values presented in the table are the average of triplicates, except TKN (only one measure).
ammonia (ammonia buffer acids formed in the acid phase) (Cho et al., 1995; Georgacakis et al., 1982; Raposo, 2006) which, in an anaerobic process, results from the degradation of nitrogenous com-pounds.
The determination of volatile solids is a good pa-rameter to follow the biodegradable organic matter degradation (Redon et al., 2005) and its analysis is commonly applied to the biological stability meas-urement in sludge from liquid effluents (Metcalf and Eddy, 1991). In Table 2, it can be seen that the initial and final values of volatile solids for the 1 year re-fuse were lower than those for the fresh rere-fuse, indi-cating a more advanced degree of degradation (for higher ageing). According to Decottignies et al. (2005), a refuse can be considered to be stabilized in the VS band from 10 to 17.4%, considerably below the final values observed in this study after 80 days of digestion. Throughout the 80 days of biodigestion, a percent reduction from 43.2 and 47.4% was ob-served for the fresh refuse and for the 1 year refuse (NW and OW), respectively. Although this percent-age is above that obtained by Maciel (2009), who verified a reduction of around 40% in the VS content in 200 days of digestion in an experimental cell with refuse from the Muribeca landfill (also in Jaboatão dos Guararapes), it can be seen that the final VS values reported here for the two refuses are still rela-tively high (46 and 40% for NW and OW, respec-tively). This indicates a remaining potential of solids that can be degraded, although the real capability of the environmental microorganisms to act is not known, since the more easily degradable organic fraction has already been consumed (Maciel, 2009).
The anaerobic stabilization process starts when the volatile suspended solids of the system are hy-drolyzed (initial phase of the anaerobic digestion process), resulting in soluble COD (Leite et al., 2003). The soluble COD represents the soluble or-ganic matter of the environment, which in turn, is substrate for the methanogenesis, being converted into CH4 and CO2 (Zhang et al., 2008). Because it was a batch system, the reduction of 88.3 and 91.8% in the COD values for the fresh refuse and 1 year refuse, respectively, is due to the conversion of or-ganic matter into biogas.
Carbon is among the main nutrients for the croorganisms, as it is a source of energy for the mi-crobial population; nitrogen is crucial for the micro-bial population growth (Igoni et al., 2008; Richard, 1992). Despite the volatile solid values being still relatively high at the end of the process, the final carbon values reveal that the biogas production de-velops to the end in the biodigesters, as 88.3 and 91.8% of COD and 79.9 and 83.7% of TKN (from NW and NO refuses, respectively) were consumed within the 80 days of biodigestion.
Gas Monitoring: Biogas
Biogas Yield
Figure 1 presents the daily production of biogas obtained throughout the 80 days of biodigestion in the six monitored bioreactors (fresh and old refuse, in triplicate), after subtracting from each the average volume of biogas generated in the blank assays.
process, with the complete elimination of oxygen by the nitrogen circulation, enabled the process to initiate with high production of biogas since the first day of the assay. The initial peak observed in the first five days of biodigestion is probably due to easily degradable organic substance hydrolyses and the great volume of inoculum used (Parawira et al., 2004) in relation to the amount of refuse (ratio of 50:1). This high initial production of biogas was observed in all assays. Still, in all biodigesters evaluated, the majority of biogas produced (80%) was in the first 50 days of assay, staying constant after this period (biogas generation curve reached a constant pattern), when the slower degradation of the refuse started to govern the process. In Hansen et al. (2004), the incubation time was 50 days (with reactors kept at 55 ºC) and the majority of the biogas volume accumulation also occurred in the first ten days of the experiment, regardless of the age of the refuse evaluated.
Letters A, B and C indicate the triplicate. All reported values are in STP conditions.
Figure 1: Daily biogas production during the
experiment (mL d-1).
Biogas production curves in a BMP assay might present various forms. This happens because, according to Labatut et al. (2011), the biodigestion mechanisms of each substrate, as well as the formation of inhibiting substances, act on the kinetics of degradation of such refuse, resulting in different curves for the process. Even when it comes to different age refuse degradation, the pattern of the degradation curves presented in this study was very similar, differing only in the daily generation of biogas. Besides, the deviation between the triplicates was small. Similar biogas production curve patterns were verified by Alves (2008) and Maciel (2009), in
their BMP assays with refuse from the Municipal Solid Waste Landfill in Recife, and in Parawira et al. (2004), who investigated the anaerobic biodegrada-tion of potato waste alone and co-digested with sugar beet leaves.
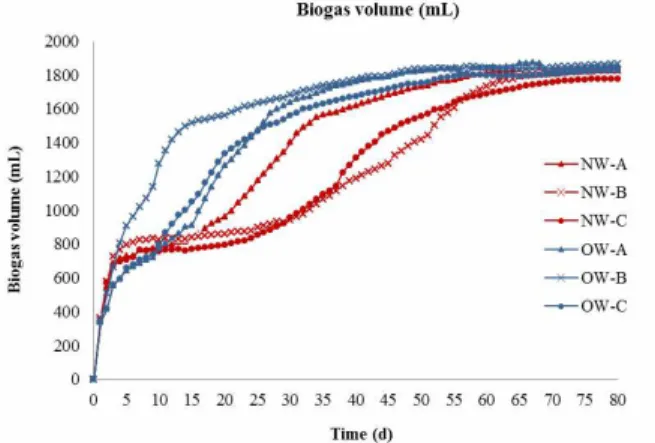
The total biogas accumulated in the bioreactors was obtained by summing the daily production of biogas throughout the whole experimental period. Figure 2 presents the biogas accumulation through-out the 80 days of biodigestion in the six reactors monitored (fresh and old refuse in triplicate), with the average biogas volume generated in the blank assays already subtracted.
Letters A, B and C indicate the triplicates. All reported values are in STP conditions.
Figure 2: Total volume of biogas produced during
the experiment (mL).
Again, the pattern of the biogas accumulation curves was very similar, regardless of the age of the refuse. Similar curve patterns for biogas accumula-tion were also verified by Alves (2008) and Maciel (2009). According to Parawira et al. (2004), com-parisons between the methane production curves found in the literature are rather complicated due to the differences between experiments, such as type of refuse, inoculums and process conditions.
Figure 2 shows that, although the volume of bio-gas generated in all assays is very similar to the final experiment (close to 1800 mL, regardless of the age of the refuse), the assays with 1 year refuse (resented by curves OW-A, OW-B and OW-C) pre-sented a more accelerated state of degradation in relation to the fresh refuse (curves NW-A, NW-B and NW-C) since the first days of the assay, probably due to its more advanced degradation stage at the mo-ment of the collection in relation to the fresh refuse.
Brazilian Journal of Chemical Engineering Vol. 31, No. 02, pp. 373 - 384, April - June, 2014
case, the measurement results for biogas generated throughout the biodigestion period were 1816 NmL for the fresh refuse and 1846 NmL for the old one (average total value generated in each case) or, 75 NmL g−vs1 (biogas volume per volatile solid mass) for
the fresh waste and 105 NmL gvs−1 for the one year
waste. It can be seen that, in spite of the age difference between wastes, both yielded very similar biogas volumes, although OW generated a slightly superior volume.
As previously observed, the VS and COD pa-rameters can be used to measure the biodegradable organic matter degradation. According to Table 2 and, furthermore, considering the principle that the pH and alkalinity values measured at the beginning and at the end of the assays remained constant, the slight superiority of the initial humidity values (3%) of the OW refuse in relation to the NW, together with the small superiority of VS, COD and TKN re-duction (addition of organic and ammoniac nitrogen) for the OW refuse in relation to the NW might explain the (also slight) 1.7% greater biogas generation by the 1 year refuse. Unlike the literature findings, the old refuse, in this case, yielded more biogas than the fresh refuse. Alves (2008), for instance, obtained 162.0 NmL gvs−1 for the fresh refuse and only 12.5 NmL gvs−1 for the 1 year refuse in terms of biogas accumulated in the BMP reactors. This same author found that the volatile solid values were 49.2 and 40.9% for fresh refuse and 1 year refuse, respectively, much lower than the initial values of refuse in this study (81 and 76%, respectively). Maciel (2009) obtained, for fresh refuse (≅20 days) and refuse aged between 7 and 14 months, the maximum values of 462.4 and 145.7 NmL gvs−1 of biogas generated, respectively; in this case, the VS values varied between 46.9 and 56.9% for both age refuses.
Therefore, there is a great disparity between the biogas yield and the process parameters, even when it comes to similar studies. Maciel (2009) claims that establishing a direct relation between the physical-chemical characteristics of samples with the BMP results might be a complicated task, due to the complexity of other factors which interfere in the process and that were not monitored such as, for instance, microbial population characteristics, and concentration of all nutrients present both in the refuse evaluated and in the inoculums used.
Methane Concentration
Altogether, 12 biogas samples were collected for analysis, since the frequency of sampling depended
on the accumulation of the gas generated. As was previously shown, the majority of biogas was gener-ated in the first half of the experiment and, thus, the majority of biogas analyses were concentrated in this period. Figures 3 and 4 present, respectively, the profile of methane and carbon dioxide concentra-tions, observed during the biodigester monitoring (12 samples along 80 days of biodigestion).
Letters A, B and C indicate the triplicates.
Figure 3: Profile of methane concentration throughout the monitoring period.
Letters A, B and C indicate the triplicates.
Figure 4: Profile of carbon dioxide concentration
throughout the monitoring period.
According to Reinhart and Towsend (1998), the landfill gas composition is affected by the refuse composition. In fact, Figure 3 shows that the 1 year refuse (curves OW-A, OW-B, and OW-C) started the experiment with a methane concentration around 5% higher than the fresh refuse (curves NW-A, NW-B, and NW-C). The difference between average con-centrations of methane between NW and NO resi-dues is even bigger from the 5th measurement (3rd week of biodigestion), converging to similar values (close to 55%) at the end of the experiment. It can also be seen that the tendency for the methane con-centration to stabilize for both refuses is exactly around 55%. From there, there is a decrease when the process starts the maturation phase. A compari-son with the methane concentrations in the Alves (2008) and Maciel (2009) studies would not be valid, as these authors used portable equipment instead of the chromatograph.
Figure 3 indicates that the biodigestion started with a relatively high methane percentage; 5% more methane in the OW refuse confirms the more accelerated degradation state of this refuse in relation to the NW refuse. With the average methane percent-age (given in Figure 3) and the averpercent-age biogas vol-umes generated (given in Figure 2), it was possible to determine the methane volume that was really generated in the biodigesters of NW and OW refuses (Figure 5).
Figure 5: Volume of methane accumulated in the
biodigesters during the experiment.
Results reveal that the average generated methane volumes (for the period under monitoring), for the NW and OW refuses were, respectively, 1000 and 1048 mL, which correspond to 54.2 and 57.7% of the total biogas generated. According to Sponza and Ağdağ (2004), the amount of methane produced per mass of biodigested organic material can be used as an indicator of the stabilization degree of the refuse evaluated.
Gas Monitoring: Hydrogen Sulfide (H2S)
In accord with Tchobanoglous et al. (1993), the formation of odorant gases results from the anaero-bic decomposition of easily degradable organic com-pounds present in the municipal solid waste, being even more representative in hot climate regions, which is the case of Jaboatão dos Guararapes, with an average temperature of 28 ºC (Jaboatão, 2012). Sulfate, for example, during the methanogenic phase (in anaerobic conditions), is reduced to sulfide (Reinhart and Townsend, 1998), which subsequently combines with hydrogen in the environment to form hydrogen sulfide (H2S) (Tchobanoglous et al., 1993). In the acid phase, a phase prior to the methanogenic, the microbiological activity accelerates the produc-tion of organic acids, generating hydrogen gas in low concentrations. When the methanogenesis takes place in the biodigestion process, these acids, as well as the H2 (H2S precursor), are gradually converted into CH4 and CO2. This reduction in acids and hy-drogen concentrations raises the pH in the environ-ment, leading it to neutrality (range of 6.8 to 8.0) (Tchobanoglous et al., 1993).
It is relevant to highlight that the H2S is an odorant in its molecular form, while under basic con-ditions H2S formation is inhibited (the ionized forms of sulfide are prevalent), controlling the formation of odor due to sulphur compounds (Gostelow and Parsons, 2001). Figure 6 shows the profile of con-centration of H2S gas throughout the biodigestion process (12 samples) for all the refuse evaluated, including the blank assays.
It can be seen from Figure 6 that there was a decrease in the concentration of H2S during the biodigestion process in all reactors (NW, OW and INOC refuse) in contrast to the evolution in the methane concentration verified in Figure 3, as claimed by Tchobanoglous et al. (1993).
According to Figure 6, there was no significant difference between the H2S gas emissions from the two refuses and the inoculum. Thus, it is believed that the H2S gas emission in the biodigesters was mainly due to the inoculum, probably because of its high proportion in relation to the substrate (50:1).
Brazilian Journal of Chemical Engineering Vol. 31, No. 02, pp. 373 - 384, April - June, 2014
(a) Concentration (in ppm) of hydrogen sulfide gas (H2S) in the NW refuse.
(b) Concentration (in ppm) of hydrogen sulfide gas (H2S) in the OW refuse.
(c) Concentration (in ppm) of hydrogen sulfide gas (H2S) in the inoculum.
- Letters A, B and C indicate the triplicates.
- The first points of some biodigesters could not be determined because they were above the Dräger sensor detection limit (1000 ppm).
Figure 6: Concentration profile of the hydrogen sulfide gas (H2S) in the biodigesters evaluated: a) fresh refuse (NW); b) 1 year refuse (OW); c) inoculums (INOC).
perception limit (0.0011 ppm, according to Summer, 1971) and toxicity for this compound (10 ppm – time
weighted average, according to OSHA, 2012). As the human olfaction system is able to detect extremely low concentrations of odorant gases, many times below the detection limits of analytical instruments (Senante et al., 2003), considering the H2S concen-tration values observed here, one can see that the olfactometric analysis in this study (if this option was made as a complement to the analytical instru-mental determination) would be unnecessary, given that the concentration values are hundreds of times superior to the threshold odor. The permanent strong intensity odor could even be dangerous to the health of the olfactometric jury because the concentration values were tens of times above the toxicity limit in all phases of the biodigestion evaluated.
Besides the odor issue, it is important to empha-size that elements such as sulfide act as inhibitory agents in the anaerobic digestion process (Chen et al., 2008). Under anaerobic conditions, sulfate is re-duced to sulfide through the action of sulfate-re-ducing bacteria (SRB), which will compete for the substrate with the methane-producing bacteria (MPB), resulting in lower methane production during the methanogenic phase (Harada et al., 1994; Isa and Anderson, 2005; Karhadkar et al., 1987).
CONCLUSIONS
Due to the number of variables (pH, humidity, temperature, etc.) involved in the evaluation of large scale refuse stabilization (landfill), as well as the difficulty of control in loco, studies on a pilot scale have been more and more frequent and important to optimize the biodegradation parameters. In this sense, the BMP represents a simple alternative with low operational cost, standardizing the refuse degra-dation conditions, variable control and monitoring of the process.
ACKNOWLEDGEMENTS
The authors thank the Conselho Nacional de Desenvolvimento Científico e Tecnológico (CNPq) for the financial support and the Grupo de Resíduos Sólidos (GRS) team at the Universidade Federal de Pernambuco for the technical support.
REFERENCES
Alcantara, P. B., Avaliação da influência da compo-sição de resíduos sólidos urbanos no comporta-mento de aterros simulados. Thesis, Federal Uni-versity of Pernambuco (2007). (In Portuguese). Allen, M. R., Braithwaite, A. and Hills, C. C., Trace
organic compounds in landfills gas at seven UK waste disposal sites. Environmental Science Tech-nology, 31(4), p. 1054-1061 (1997).
Alves, I. R. F. S., Análise experimental do potencial de geração de biogás em resíduos sólidos urbanos. Dissertation, Federal University of Pernambuco (2008). (In Portuguese).
Andreoli, C. V., Ferreira, A. C., Chernicharo, C. A. and Borges, E. S. M., Secagem e Higienização de Lodos com Aproveitamento de Biogás.In: Cassini, S. T. (Ed.), Digestão de Resíduos Sólidos Orgânicos e Aproveitamento do Biogás. Rio de Janeiro: ABES, Rima, p. 121-165 (2003). (In Portuguese). Angelidaki, I., Alves, M., Bolzonella, D., Borzacconi,
L., Campos, J. L., Guwy, A. J., Kalyuzhnyi, S., Jenicek, P. and Van Lier, J. B., Defining the bio-methane potential (BMP) of solid organic wastes and energy crops: A proposed protocol for batch assays. Water Science & Technology, 59(5), p. 927-934 (2009).
APHA, Standard Methods for the Examination of Water and Wastewater, American Public Health Association, American Water Works Association, Water Environmental Federation, 20 Ed., Wash-ington (1998).
APHA, Standard Methods for the Examination of Water and Wastewater, American Public Health Association, American Water Works Association, Water Environmental Federation, 21 Ed., Wash-ington (2005).
Associação Brasileira de Normas Técnicas - ABNT. NBR 10007 - Amostragem de Resíduos Sólidos. Rio de Janeiro (2004). (In Portuguese).
Barlaz, M. A., Ham, R. K. and Schaefer, D. M., Mass- balance analysis of anaerobically decomposed refuse. Journal of Environmental Engineering, ASCE, 115(6), p. 1088-1102 (1989).
Belli Filho, P. and Lisboa, H. M., Avaliação de emissões odorantes. Revista Engenharia Sanitária e Ambiental (ABES), 3(3/4), p. 101-106 (1998). (In Portuguese).
Bidone, F. R. A. and Povinelli, J., Conceitos básicos de resíduos sólidos. EESC-USP, São Carlos (1999). (In Portuguese).
Bowly, S. W., An assessment of current methods for quantifying landfill odours. In: Proceedings Sar-dinia, Ninth International Waste Management and Landfill Symposium (2003).
Capelli, L., Sironi, S., Del Rosso, R., Centola, P. and II Grande, M., Odour impact assessment of a MSW landfill: Integrated analytical, sensorial and senso-instrumental approach. In: Proceedings Sardinia, Eleventh International Waste Manage-ment and Landfill Symposium (2007).
Castilhos Jr., A. B., Medeiros, P. A., Firta, I. N., Lupatini, G. and Silva, J. D., Principais Processos de Degradação de Resíduos Sólidos Urbanos, In: Castilhos Jr., A. B. (Ed.), Alternativas de Dispo-sição de Resíduos Sólidos Urbanos para Pequenas Comunidades. Rio de Janeiro: ABES, Rima, p. 19-50 (2003). (In Portuguese).
Chen, Y., Cheng, J. J. and Creamer, K. S., Inhibition of anaerobic digestion process: A review. Biore-source Technology, 99(10), p. 4044-4064 (2008). Cho, J. K., Park, S. C. and Chang, H. N.,
Biochemi-cal methane potential and solid state anaerobic digestion of Korean food wastes. Bioresource Technology, 52(3), p. 245-253 (1995).
Decottignies, V., Galtier, L., Lefebvre, X. and Villerio, T., Comparison of analytical methods to deter-mine the stability of municipal solid waste and related wastes. In: Proceedings Sardinia, Tenth International Waste Management and Landfill Symposium (2005).
Georgacakis, D., Sievers, D. M. and Iannotti, E. L., Buffer stability in manure digesters. Agricultural Wastes, 4(6), p. 427-41 (1982).
Gostelow, P. and Parsons, S. A., Hydrogen Sulphide Measurement. In: Stuetz, R., Frechen, F. B. (Ed.), Odours in Wastewater Treatment – Measurement, Modeling and Control. London: IWA Publishing, p. 120-129 (2001).
Gostelow, P., Longhurst, P., Parsons, S. A. and Stuetz, R. M., Sampling for measurement of odours. IWA Publishing, Scientific and Technical Report, n. 17, London (2003).
Brazilian Journal of Chemical Engineering Vol. 31, No. 02, pp. 373 - 384, April - June, 2014
Hansen, T. L., Schmidt, J. E., Angelidaki, I., Marca, E., Jansen, J. C., Mosbaek, H. and Christensen, T. H., Method for determination of methane poten-tials of solid organic waste. Waste Management, 24(4), p. 393-400 (2004).
Harada, H., Uemura, S. and Momonoi, K., Interac-tion between sulfate-reducing bacteria and meth-ane-producing bacteria in UASB reactors fed with low strength wastes containing different lev-els of sulfate. Water Research, 28(2), p. 355-367 (1994).
IBGE, Instituto Brasileiro de Geografia e Estatística. Pesquisa Nacional de Saneamento Básico 2008. Rio de Janeiro, 2010. p. 219 Available at http:// www.ibge.gov.br/home/estatistica/populacao/condi caodevida/pnsb2008/PNSB_2008.pdf. (Accessed on February 23, 2012).
Igoni, A. H., Ayotamuno, M. J., Eze, C. L., Ogaji, S. O. T. and Probert, S. D., Designs of anaerobic di-gesters for producing biogas from municipal solid-waste. Applied Energy, 85(6), p. 430-438 (2008).
Isa, M. H. and Anderson, G. K., Molybdate inhibi-tion of sulphate reducinhibi-tion in two-phase anaerobic digestion. Process Biochemistry, 40(6), p. 2079-2089 (2005).
Jaboatão dos Guararapes, Prefeitura de, Um Breve Histórico do Município de "Yapoatan". Available at http://www.jaboatao.pe.gov.br/jaboatao/historia. aspx. (Accessed on November 21, 2012). (In Por-tuguese).
Karhadkar, P. P., Audic, J. M., Faup, G. M. and Khanna, P., Sulfide and sulfate inhibition of metha- nogenesis. Water Research, 21(9), p. 1061-1066 (1987).
Karnik, M., Sneath, R. W. and Persaud, K. C., Measurement odour emissions from landfill sites. In: Proceedings Sardinia, Ninth International Waste Management and Landfill Symposium (2003). Kelly, R. J., Shearer, B. D., Kim, J., Goldsmith, C.
D., Hater, G. R. and Novak, J. T., Relationships between analytical methods utilized as tools in the evaluation of landfill waste stability. Waste Management, 26(12), p. 1349-1356 (2006). Khalid, A., Arshad, M., Anjum, M., Mahmood, T.
and Dawson, L., The anaerobic digestion of solid organic waste. Waste Management, 31(8), p. 1737- 1744 (2011).
Kim, K-H., Emissions of reduced sulfur compounds (RSC) as a landfill gas (LFG): A comparative study of young and old landfill facilities. Atmos-pheric Environment, 40(34), p. 6567-6578 (2006). Kim, K-H., Choi, Y. J., Jeon, E. C. and Sunwoo, Y.,
Characterization of malodorous sulfur compounds
in landfill gas. Atmospheric Environment, 39(6), p. 1103-1112 (2005).
Knox, K., Braithwaite, P., Caine, M. and Croft, B., Brogborough landfill test cells: The final chapter. A study of landfill completion in relation to final storage quality (FSQ) criteria. In: Proceedings Sardinia, Tenth International Waste Management and Landfill Symposium (2005).
Labatut, R. A., Angenent, L. T. and Scott, N. R., Biochemical methane potential and biodegrad-ability of complex organic substrates. Biore-source Technology, 102(3), p. 2255-2264 (2011). Leite, V. D., Sousa, J. T., Prasad, S., Lopes, W. S.,
Athayde Jr., G. B. and Dantas, A. M. M., Trata-mento de resíduos sólidos de centrais de abaste-cimento e feiras livres em reator anaeróbio de batelada. Revista Brasileira de Engenharia Agrí-cola e Ambiental, 7(2), p. 318-322 (2003). (In Portuguese).
Maciel, F. J., Geração de biogás e energia em aterro experimental de resíduos sólidos urbanos. Thesis, Federal University of Pernambuco (2009). (In Portuguese).
Maciel, F. J. and Jucá, J. F. T., Evaluation of landfill gas production and emissions in a MSW large-scale experimental cell in Brazil. Waste Man-agement, 31(5), p. 966-977 (2011).
Mbuligwe, S. E., Comparative treatment of dye-rich wastewater in engineered wetland systems (EWSs) vegetated with different plants. Water Research, 39(2-3), p. 271-280 (2005).
Metcalf and Eddy, Wastewater Engineering. Treat-ment, Disposal, and Reuse. 3rd Ed., McGraw-Hill, Inc. International Edition, Singapore (1991). Mshandete, A., Kivaisi, A., Rubindamayugi, M. and
Mattiasson, B., Anaerobic batch co-digestion of sisal pulp and fish wastes. Bioresource Technol-ogy, 95(1), p. 19-24 (2004).
Odorizzi, G., Paradisi, L. and Silvestri, S., Odour impact assessment from waste treatment plants by olfactometry. The project of the autonomous Province of Trento. In: Proceedings Sardinia, Ninth International Waste Management and Landfill Symposium (2003).
OSHA, Occupational Safety & Health Administra-tion. Hydrogen sulfide in workplace atmospheres. Available at http://www.osha.gov/dts/sltc/methods/ inorganic/id141/id141.html (Accessed on May 26, 2012).
Parawira, W., Murto, M., Zvauya, R. and Mattiasson, B., Anaerobic batch digestion of solid potato waste alone and in combination with sugar beet leaves. Renewable Energy, 29(11), p. 1811-1823 (2004). Rajeshwari, K. V., Balakrishnan, M., Kansal, A.,
Kusum Lata and Kishore, V. V. N., State-of-the-art of anaerobic digestion technology for indus-trial wastewater treatment. Renewable and Sus-tainable Energy Reviews, 4(2), p. 135-156 (2000). Raposo, F., Banks, C. J., Siegert, I., Heaven, S. and
Borja, R., Influence of inoculum to substrate ratio on the biochemical methane potential of maize in batch tests. Process Biochemistry, 41(6), p. 1444-1450 (2006).
Rasi, S., Läntelä, J. and Rintala, J., Trace compounds affecting biogas energy utilisation – A review. Energy Convertion and Management, 52(12), p. 3369-3375 (2011).
Recife, Prefeitura de, A Cidade do Recife, Available at http://www.recife.pe.gov.br/pr/secplanejamento/ inforec. (Accessed on May 25, 2012). (In Portu-guese).
Redon, E., Lornage, R., Lagier, T. and Hebe, I., Measurement and comparison of different stabil-ity parameters during a mechanical biological pretreatment before landfilling. In: Proceedings Sardinia, Tenth International Waste Management and Landfill Symposium (2005).
Reinhart, D. R. and Townsend, T. G., Landfill Bio-reactor, Design & Operation. Lewis Publishers, Boca Raton (1998).
Richard, T. L., Municipal solid waste composting: Physical and biological processing. Biomass and Bioenergy, 3(3/4), p. 163-180 (1992).
Schirmer, W. N., Amostragem, análise e proposta de tratamento de compostos orgânicos voláteis (COV) e odorantes em estação de despejos industriais de refinaria de petróleo. Dissertation, Federal
Uni-versity of Santa Catarina (2004). (In Portuguese). Senante, E., Galtier, L., Bekaert, C., Lambolez-Michel,
L. and Budka, A., Odours management at MSW landfill sites: Odours sources, odours compounds and control measures. In: Proceedings Sardinia, Ninth International Waste Management and Landfill Symposium (2003).
Sironi, S., Capelli, L., Céntola, P., Del Rosso, R. and II Grande, M., Odour emission factors for as-sessment and prediction of Italian MSW landfills odour impact. Atmospheric Environment, 39(29), p. 5387-5394 (2005).
Sponza, D. T. and Ağdağ, O. N., Impact of leachate recirculation and recirculation volume on stabili-zation of municipal solid wastes in simulated an-aerobic bioreactors. Process Biochemistry, 39(12), p. 2157-2165 (2004).
Stretch, D., Laister, G., Strachan, L. and Saner, M., Odour trails from landfill sites. In: Proceedings Sardinia, Eighth International Waste Management and Landfill Symposium (2001).
Summer, W., Odour Pollution of Air – Causes and Control. Chemical and Process Engineering Se-ries. Leonard Hill Books, London (1971). Tchobanoglous, G., Theisen, H. and Vigil, S. A.,
Inte-grated solid waste management. Engineering prin-ciples and management issues. Irwin McGraw-Hill (1993).
US Environmental Protection Agency (USEPA), Air emissions from municipal solid waste landfills - Background information for proposed standards and guidelines. Publication EPA-450/3-90-011a, North Carolina (1991).