*e-mail: [email protected]
The Effect of Pr co-doping on the Densification and Electrical Properties of Sr-LaAlO
3L. A. Villas-Boas*, D. P. F. de Souza
Graduate Course in Science and Materials Engineering, Department of Materials Engineering, Federal University of São Carlos – UFSCar, Rod. Washington Luis, Km 235,
CEP 13565-905, São Carlos, SP, Brazil
Received: September 11, 2012; Revised: January 31, 2013
Perovskite-type materials have been investigated extensively in the attempt to discover new electrolyte materials for solid oxide fuel cells (SOFC) operating at low temperatures. These materials include LaAlO3-based perovskite, which, when adequately doped, presents high ionic conductivity. However, despite the high conductivity of doped LaAlO3, two characteristics limit its application as solid electrolyte: low sinterability and p-type electronic conductivity in oxidizing conditions. The purpose of this work was to investigate the effect of Pr co-doping on the densification and electrical conductivity of Sr-doped LaAlO3. The addition of Pr eliminated the deficiencies mentioned above. Pr in solid solution acts as a perfect sintering aid because promoted densification without forming secondary phase which should be detrimental for electrical conduction. The addition of Pr also increased the bulk electrical conductivity measured in air atmosphere but had no effect at low oxygen partial pressure. However, the addition of Pr had a strong effect on the grain boundary, improving the ionic grain boundary electrical conductivity at air atmosphere which was attributed to the Pr influence on the space charge layer.
Keywords: SOFC, lanthanum aluminate, electrical characterization, solid electrolytes, space charge layer
1. Introduction
Solid oxide fuel cell (SOFC) technology is considered one of the most promising ways to generate electrical energy in the near future. This technology is based mainly on designs that employ yttrium-stabilized zirconia (YSZ) as electrolyte. The economic feasibility of fuel cells is directly related to the decrease in operating temperature, which is established mainly by the electrolyte’s properties1,2. Thus, new electrolyte materials for SOFCs operating at low temperatures have been investigated extensively and perovskite-type materials are considered promising materials for electrolytes. These materials offer several advantages, including a stable crystal structure, a variety of elements that can be accommodated in the crystal lattice, and the relatively simple creation of oxygen vacancies by partial substitution of A- and/or B-site cations by lower valence cations3-6.
In perovskite-based materials, anion migration occurs through the vacancy mechanism. To explain the ionic conductivity in perovskite-type oxides, the model of the ionic conduction mechanism involves structural parameters such as the tolerance factor, free volume and critical radius. The tolerance factor (t) described by Equation 1 establishes
the relationship between the symmetry and ionic radius in perovskites. Most perovskites have a distorted cubic geometry. This distortion is associated with a high degree of anisotropy in oxygen sites. The free volume is defined as the “unoccupied volume” of the unit cell and is calculated by subtracting the volume occupied by all the ions in the
unit cell from the volume of the perovskite unit cell. The critical radius (rcrit), Equation 2, for ionic migration between
two anion sites is established by a triangle composed of two A-site cations and one B-site cation7,8:
(
)
(
)
2
A O
B O
r r
t
r r
+ =
+ (1)
where rAand rB represent the radiuses of the cations and ro
is the oxygen ion.
(
)
(
)(
)
(
)
o[ 3 4 2 ] [ ]
[2 2 ]
o B A B A B
crit
A B o
a a r r r r r
r
r r a
− − − +
=
− + (2)
where ao is the cubic lattice parameter.
Among the perovskite-structured oxides, LaGaO3-based oxides have been investigated as electrolyte materials for intermediate-temperature SOFCs. Gallate-based materials show higher electrical conductivity than YSZ, but their chemical and mechanical stability are low at high temperatures. In fact, few materials can withstand both high temperature and low oxygen partial pressure, which is the condition to which the electrolyte is subjected on the anode region (e.g., T>800 °C and p(O2)<10–10 atm)9-11.
LaAlO3-based materials are an alternative for LaGaO3
valence is filled with oxygen gas, generating electron holes,
as indicated in Equation 3, where VO
•• denotes oxygen
vacancies, x O
O is the oxygen ion in the lattice site, and h•
is the electron hole. Therefore, doped-LaAlO3 presents
electronic conduction at high p(O2)12,13:
( )
1( )
2
2 2
x
O O
O g +V••→O + h• (3)
In the present work, the effect of Pr addition on the sinterability and conductivity of Sr-LaAlO3 was investigated. The sinterability was followed introducing different amount of Pr and sintering the samples at 1500 and 1600 °C. The electrical conductivity of sintered samples was evaluated by impedance spectroscopy in a broad range of temperatures and under high oxygen partial pressure p(O2), to study the effect of Pr on the electrical conductivity of the LaAlO3 -based system. The electronic conduction in air was evaluated by the dc four-probe technique, using YSZ electron-blocking electrodes14.
2. Experimental Procedure
2.1.
Sample preparation
Sr-doped, nondoped and Pr co-doped LaAlO3 powders
were synthesized by the solid-state reaction method. A suitable amount of La2O3 (Aldrich, 99.9%), Al2O3
(Baikowski-CR30), Sr(NO3)2 (Riedel-de Haën, 99.99%)
and Pr(NO3)3.4H2O (Aldrich 99.9%) was milled with
zirconia balls in isopropyl alcohol. The following nominal compositions were prepared: LaAlO3, La0.9Sr0.1AlO3-δ, La0.8(Pr0.1Sr0.1)AlO3-δ and La0.7(Pr0.2Sr0.1)AlO3-δ. The mixtures were calcined at 800 °C for 30 min and then milled into slurries in a vibratory mill with isopropyl alcohol and 1.0 wt% of polyvinyl butyral (B-98 Solutia). The slurries were dried in air and granulated through a nylon sieve. Pellets (10 mm diameter) were pressed isostatically (200 MPa) and sintered at 1500 and 1600 °C in air for a soak time of 6h.
2.2.
Characterization
The crystal structures of the sintered samples were analyzed by X-ray diffraction (Siemens D5000 diffractometer) using Cu-Kα radiation (1,54 Å). The data were obtained in the 2θ range of 15-90° at a scan speed of 0.033°/s. The lattice parameters were evaluated from XRD data. Bulk densities of sintered specimens were measured by the Archimedes method. The relative density was determined from the theoretical value established from the experimental lattice parameters. The microstructures were analyzed by scanning electron microscopy (SEM) (Philips XL 30 FEG). The surfaces for SEM analysis were polished with 1-µm-diamond paste and thermally etched at 100 °C lower than sintering temperature for 6 min.
The electrical conductivity of the specimens was measured in air and at low oxygen partial pressure by two-probe impedance spectroscopy technique (HP 4192 A) in a temperature range of 250 to 800 °C and a frequency range of 5 Hz to 13 MHz. Platinum paste (Demetron 308A) was applied on both sides of the pellets, which were then fired at 1100 °C for 30 min.
The electronic conductivity of doped LaAlO3 was
evaluated in air and at low oxygen partial pressure by the dc four-probe technique, using electron-blocking electrodes14. Electrical measurements were taken with a HP 3468A multimeter in a temperature range of 250-800 °C. The electron-blocking electrodes were thin slices of YSZ with a thickness of <300 µm. One side of these YSZ slices was coated with platinum paste (Demetron 308A) and the other side was fixed onto the sample’s surface by mechanical pressure exerted by the sample holder inside the electrical measuring chamber. For measurements at low oxygen partial pressure, the samples were held for 1 hour at 800 °C and p(O2)=10–22 atm before taking the measurements.
3. Results and Discussion
3.1.
Crystalline phases and densification
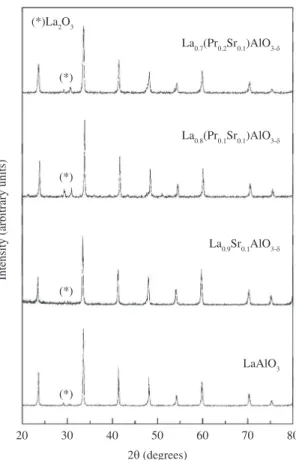
Figure 1 shows the X-ray diffraction patterns of sintered at 1600 °C/6h. The main diffraction peaks can be indexed based on the cubic perovskite structure of LaAlO3 (JCPDS card 85-848), with La2O3 (JCPDS: 73-2141) detected as the minority phase.
Table 1 lists the lattice parameters, evaluated from XRD data, and the theoretical density which was calculated using the unit cell parameters determined by a Rietveld refinement of the X-ray diffraction pattern and considering 0.05 oxygen deficiency relative to oxygen sites. Refinements were carried out with the General Structure Analysis System (GSAS) software15, using the graphical interface EXPGUI16. The
lattice parameter increased with the addition of Sr and decreased with the addition of Pr. Table 1 shows also the percentage of relative density of samples sintered at 1500 and 1600 °C where it can be seen the strong effect of Pr on the samples densification even at 1500 °C. Density as high as 97.6% of theoretical density was obtained for composition La0.7(Pr0.2Sr0.1)AlO3-δsintered at 1600 °C/6h.
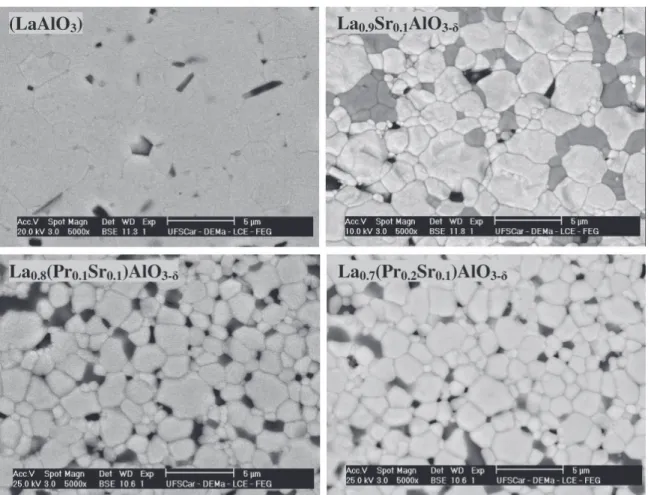
Figure 2 shows the SEM micrographs obtained in back
scattering electron (BSE) mode. The nondoped LaAlO3
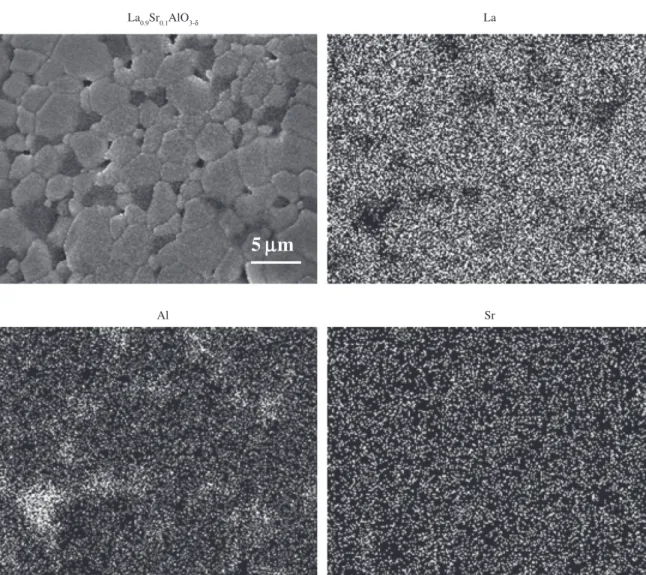
showed a homogeneous microstructure, while the Sr-doped samples presented dark gray grains dispersed in the continuous matrix of light gray grains. Since BSE imaging provides contrast due to differences in atomic numbers, dark gray grains are richer in an element with a low atomic number than light gray grains. SEM mapping of Pr undoped samples (Figure 3) showed that the dark gray grains were
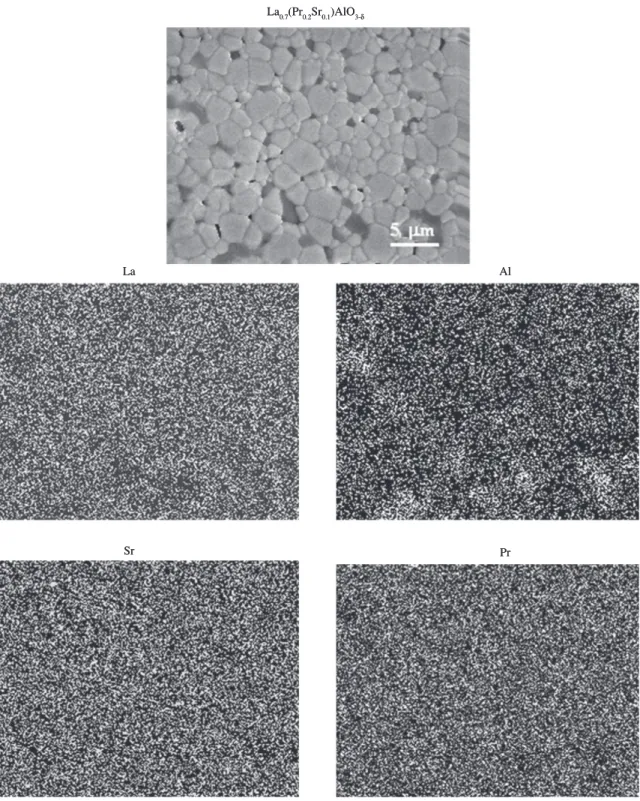
Al rich and La deficient. The addition of Pr improved the homogeneity of Al and La as show the SEM mapping of composition La0.7(Pr0.2Sr0.1)AlO3-δ, Figure 4. The addition of Pr, besides improved the densification, inhibited the grain growth and the La deficient grains, dark gray grains, are smaller than matrix grains (Figure 2). The average grain size of La0.9Sr0.1AlO3-δ, La0.8(Pr0.1Sr0.1)AlO3-δ and La0.7(Pr0.2Sr0.1)AlO3-δ were 1.83 ± 0.08 µm, 1.44 ± 0.08 µm and 1.1 ± 0.2 µm, respectively.
3.2.
Electrical conductivity
The impedance spectroscopy spectra in Figure 5, which were measured in air at 375 °C, show two distinct semicircles. The high frequency semicircle is attributed to the bulk response and the low frequency to the grain
Table 1. Lattice parameter and theoretical and relative densities of sintered samples.
Composition Lattice parameter (Å) Theoretical density (g/cm3)
%Relative Density 1500 °C 1600 °C
LaAlO3 3.790 6.52 99.2 99.8
La0.9Sr0.1AlO3-δ 3.793 6.33 77.0 90.1
La0.8(Pr0.1Sr0.1)AlO3-δ 3.786 6.37 93.6 94.7
La0.7(Pr0.2Sr0.1)AlO3-δ 3.789 6.36 93.0 97.6
boundary. However, the higher frequency semicircle disappeared gradually with increasing temperature.
3.2.1. Influence of Pr-doping on the bulk and grain boundary electrical conductivity
Figure 6 depicts Arrhenius plots of the bulk electrical conductivity measured in air which increases systematically with increasing concentration of Pr.
As mentioned earlier, ionic conductivity depends on structural parameters. Oxide ions can move easily to neighboring oxygen vacancy sites when the tolerance factor is near unity, i.e., the deformation of the cubic symmetry is small. Thus, the higher the symmetry of the structure the higher is the conductivity of oxide ions. A large free volume favors high oxygen ion mobility, and high values of critical radius result in low disturbances of the surrounding cations during the migration of the anion through the lattice17. Considering that the valence of Pr is equal to or higher than that of La, its presence in crystal lattice does not introduce additional oxygen vacancies. Therefore, the high conductivity of the Pr co-doped samples can be attributed to enhancement of oxygen ion mobility due to
a more favorable crystalline structure. In other words, the addition of Pr increased systematically the critical radius and the free volume and reduced the distortion of the crystal lattice (Table 2). The decrease in the bulk activation energy in response to the addition of Pr (see Table 3) reinforces the notion of a correlation between the crystalline structure and the high oxygen ion mobility of the Pr co-doped samples.
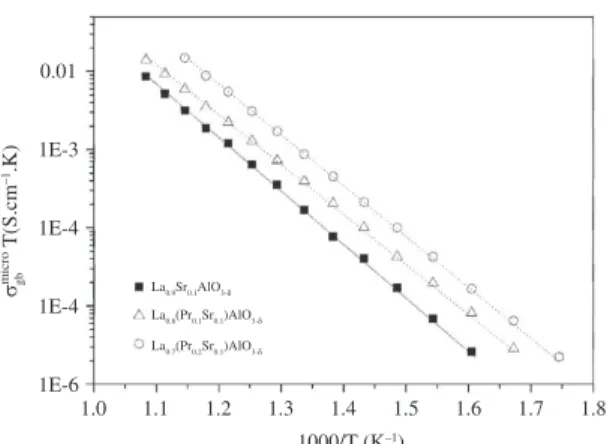
Figure 7 shows Arrhenius plots for microscopic grain boundary conductivity measured in air. The microscopic grain boundary conductivity ( micro
gb
σ ) can be calculated by
Equation 418:
gb o micro gb
gb gb R C
= ε ε
σ (4)
where εo is the vacuum permittivity, and εgb, Rgb and Cgb are
the grain boundary permittivity, resistance and capacitance, respectively. Assuming that the grain boundary permittivity
εgb is equal to the bulk permittivity, εb can be calculated by Equation 5:
0 b b
C L A
= ε
ε (5)
where L and A are, respectively, the sample’s thickness and electrode area.
The micro gb
σ shown in Figure 7 was calculated by
Equation 6:
micro gb
Cb L
Rgb gbC A
=
σ (6)
The addition of Pr improved systematically the microscopic grain boundary conductivity (see Figure 7) and decreased the grain boundary activation energy (Table 3). Since additional vacancies were not introduced with the La0.7(Pr0.2Sr0.1)AlO3-δ
La Al
Sr Pr
addition of Pr, the behavior observed here can be attributed to the influence of Pr on the grain boundary thickness (δ
gb),
as has been exhaustively discussed for doped-ceria and yttria-stabilized zirconia19. The δ
gb values for Pr-doped and
nondoped samples analyzed at 425 °C in air were calculated by Equation 7 and are shown in Table 3.
gb gb g
g g gb
C d C
=ε δ
ε (7)
where εgb and εg are the grain boundary and grain permittivity that were considered equal, Cg and Cgb are, respectively,
the capacitance for grain and grain boundary, and dg is the average grain size. The systematically decrease of δgb with increasing of Pr amount, as shown Table 3, confirms the positive effect of Pr doping on the decrease of the grain boundary thickness.
Although measuring the electrical conductivity by impedance spectroscopy enables the separation of bulk and grain boundary conductivity, it did not provide information about the ionic and electronic contributions to the total electrical conductivity. Since the composition La0.7(Pr0.2Sr0.1) AlO3-δ showed the highest electrical conductivity in air it
was analyzed by the dc four-probe technique using YSZ
electron-blocking electrodes14. For comparison, the Pr
nondoped composition, La0.9Sr0.1AlO3-δ, was also analyzed by this technique. Figure 8 compares the Arrhenius plots for the dc electrical conductivity of the La0.9Sr0.1AlO3-δ
and La0.7(Pr0.2Sr0.1)AlO3-δ samples obtained in air with Pt
and YSZ electron-blocking electrodes. As can be seen, the electrical conductivity measured with electron-blocking electrodes (ionic conduction) was lower than that measured with Pt electrodes (total conduction) because the oxygen vacancies are filled in an air atmosphere, generating electron holes, according to equation 3. The following was observed:
i) the ionic conductivity of La0.7(Pr0.2Sr0.1)AlO3-δ is higher
than that of La0.9Sr0.1AlO3-δ, and ii) the decrease in electrical
conductivity measured with the electron-blocking electrode of the doped sample was lower (6 times) than the Pr-nondoped sample (8 times). This indicates that no additional oxygen vacancies were introduced by the addition of Pr, reinforcing the hypothesis that the addition of Pr enhances oxygen ion mobility due to a more favorable crystalline structure, resulting in high electrical conductivity. The total electrical conductivity of the Pr-doped sample at 800 °C
was higher than Pr-nondoped sample, 23.0 × 10⁻³ S/cm
and 9.0 × 10⁻³ S/cm, respectively. The value obtained for Pr-nondoped in the literature is 6.3 × 10⁻³ S/cm13.
3.2.2. Influence of oxygen partial pressure on the bulk and grain boundary electrical conductivity
Figure 9 compares the Arrhenius plots of the bulk and microscopic grain boundary electrical conductivity of the La0.9Sr0.1AlO3-δ, La0.8(Pr0.1Sr0.1)AlO3-δ and La0.7(Pr0.2Sr0.1)
Table 2. Critical Radius, Free Volume and Tolerance Factor.
Composition Radius (Å)Critical Volume (ÅFree 3)
Tolerance Factor
La0.9Sr0.1AlO3-δ 0.9016 14.06 1.011 La0.8(Pr0.1Sr0.1)AlO3-δ 0.9128 14.16 1.003 La0.7(Pr0.2Sr0.1)AlO3-δ 0.9296 14.44 0.994
Table 3. Activation energies for the bulk (Eab) and grain boundary (Eagb) and grain boundary thickness (δ
cg) at 425 °C (nm) of samples measured in air and at low oxygen partial pressure.
Composition Eab (eV) Eagb (eV) δcg at 425 °C (nm)
La0.9Sr0.1AlO3-δ In air 0.93 1.40 5.7
p(O2) = 10–22 0.96 1.81 30.4
La0.8(Pr0.1Sr0.1)AlO3-δ In air 0.85 1.24 4.4
p(O2) = 10–22 0.88 1.64 18.9
La0.7(Pr0.2Sr0.1)AlO3-δ In air 0.84 1.21 3.8
p(O2) = 10–22 0.88 1.42 10.0
Figure 5. Impedance spectroscopy spectra, measured in air at 375 °C, of the samples sintered at 1600 °C/6h.
AlO3-δ compositions measured at a low oxygen partial
pressure, PO2=10–22 atm and in air atmosphere.
All compositions showed lower bulk conductivity at low oxygen partial pressure than in air atmosphere, but the Pr-nondoped sample presented a lower decrease than the La0.7(Pr0.2Sr0.1)AlO3-δ, which was the most conductive
sample. In addition, the bulk activation energies at low oxygen partial pressure were only ~3% higher than in air atmosphere (Table 3). This small difference means that the bulk characteristic did not change significantly at low PO2. However, the microscopic grain boundary conductivities ( micro
gb
σ ) of all compositions were highly sensitive to the
oxygen partial pressure. The micro gb
σ at low P
O2 was about two
orders of magnitude lower than in air (Figure 9), while the grain boundary activation energy increased (Table 3). This behavior can be understood by analyzing the effect of PO2 on the grain boundary thickness, δgb, whose values at 425 °C are listed in Table 3. Note that δ
gb showed a significant increase
with decreasing PO2, which is consistent with the decrease in micro
gb
σ and the increase in activation energy (Table 3).
Although Pr-doped and nondoped samples displayed the same behavior in response to variations in oxygen partial pressure, the lower increase in grain boundary activation energy and δgb with the decrease in PO2 presented by the Pr-doped samples provided evidence that Pr acted positively on the grain boundary.
The lower decrease in bulk electrical conductivity of the Pr-nondoped sample under low oxygen partial pressure (Figure 9) can be attributed to the high grain boundary thickness formed in this sample under low oxygen partial pressure (Table 3), which inhibited oxygen diffusion from the bulk, thus preventing the elimination of electronic conduction.
4. Conclusions
Praseodymium as a co-dopant in Sr-LaAlO3 behaves
as an excellent sintering aid besides increasing the bulk electrical conductivity measured in air atmosphere. Oxygen ion mobility is enhanced by the favorable crystalline structure established by the Pr solid solution. At low PO2, the Pr co-doping has no effect on bulk conductivity.
The Pr co-doping has a strong effect on the grain boundary, improving the ionic conductivity due to change in the space charge layer structure. At high oxygen partial pressure, the grain boundary thickness (δgb) of Pr doped samples (3.8 and 4.4 nm) was lower than that of samples
Figure 9. Arrhenius plot of (a) bulk and (b) microscopic grain boundary electrical conductivity measured in air and at low oxygen partial pressure for samples sintered at 1600 °C/6h.
Figure 7. Arrhenius plot of microscopic grain boundary conductivity measured in air.
Figure 8. Arrhenius plot of total electrical conductivity of La0.9Sr0.1AlO3-δ and La0.7(Pr0.2Sr0.1)AlO3-δ samples sintered at
without Pr (5.7 nm). The same behavior was observed at a low oxygen partial pressure, in addition to the significant increase in space charge thickness. These results indicate that Pr improved the total electrical conductivity through its positive effect on the grain boundary.
For Pr-nondoped samples, the small difference between
bulk conductivity measured at low and high PO2 can be
attributed to the high grain boundary thickness, which
inhibits oxygen diffusion from the bulk, thereby preventing the total elimination of the electronic conduction.
Acknowledgements
The authors acknowledge CNPq (Brazil’s National Council for Scientific and Technological Development) and CAPES (Coordination for the Improvement of Higher Education Personnel) for its financial support of this work.
References
1. Fergus JW. Electrolytes for solid oxide fuel cells. Journal of Power Sources. 2006; 162:30-40. http://dx.doi.org/10.1016/j.
jpowsour.2006.06.062
2. Kharton VV, Marques FMB and Atkinson A. Transport properties of solid oxide electrolyte ceramics: a brief review. Solid State Ionics. 2004; 174:135-149. http://dx.doi.
org/10.1016/j.ssi.2004.06.015
3. Shinomiya A, Hirata Y, Sameshima S and Matsunaga N. Synthesis and Electrical Conductivity of La1−xSrxAl0.9Mg0.1O3−δ(x = 0.1– 0.4) Perovskite Solid Solution. IOP Conference Series:
Materials Science and Engineering. 2011; 18:132015. http:// dx.doi.org/10.1088/1757-899X/18/13/132015
4. Takahashi T and Iwahara H. Ionic conduction in perovskite-type oxide solid solution and its application to the solid electrolyte fuel cell. Energy Conversion. 1971; 11:105-111.
http://dx.doi.org/10.1016/0013-7480(71)90121-5
5. Hariharan R, Venkatasubramanian A and Gopalan P. Solid-state synthesis and characterization of Ca-substituted YAlO3 as electrolyte for solid oxide fuel cells. Journal of Solid State Electrochemistry. 2010; 14:1657-1666. http://dx.doi.
org/10.1007/s10008-010-1008-x
6. Arachi Y, Asai T, Yamamoto O, Takeda Y and Imanishi N. Oxygen-deficient perovskite compounds with oxide ion conduction. Solid State Ionics. 2000; 135:757-760. http://
dx.doi.org/10.1016/S0167-2738(00)00374-X
7. Sammells AF, Cook RL, White JH, Osbome JJ and MacDuff RC. Rational selection of advanced solid electrolytes for intermediate temperature fuel cells. Solid State Ionics. 1992; 52:111-123.
http://dx.doi.org/10.1016/0167-2738(92)90097-9
8. Hayashi H, Inaba H, Matsuyama M, Lan NG, Dokiya M and Tagawa H. Structural consideration on the ionic conductivity of perovskite-type oxides. Solid State Ionics. 1999; 122:1-15.
http://dx.doi.org/10.1016/S0167-2738(99)00066-1
9. Chen TY, Pan RY and Fung KZ. Effect of divalent dopants on crystal structure and electrical properties of LaAlO3 perovskite.
Journal of Physics and Chemistry of Solids. 2008; 69:540-546.
http://dx.doi.org/10.1016/j.jpcs.2007.07.039
10. Onishi T. The effects of counter cation on oxide ion conductivity: In the case of Sr-doped LaAlO3 perovskite.
International Journal of Quantum Chemistry. 2010;
110:2912-2917. http://dx.doi.org/10.1002/qua.22837
11. Sinha A, Sharma BP and Gopalan P. Development of novel perovskite based oxide ion conductor. Electrochimica Acta. 2006; 51:1184-1193. http://dx.doi.org/10.1016/j. electacta.2005.06.009
12. Fung KZ and Chen TY. Cathode-supported SOFC using a highly conductive lanthanum aluminate-based electrolyte.
Solid State Ionics. 2011; 188:64-68. http://dx.doi.org/10.1016/j. ssi.2010.09.035
13. Park JY and Choi GM. Electrical conductivity of Sr and Mg doped LaAlO3. Solid State Ionics. 2002; 154-155:535-540.
http://dx.doi.org/10.1016/S0167-2738(02)00510-6
14. Godoi GS and Souza DPF. Electrical and microstructural characterization of La0.7Sr0.3MnO3 (LSM), Ce0.8Y0.2O2 (CY) and LSM–CY composites. Materials Science and Engineering: B. 2007; 140:90-97. http://dx.doi.org/10.1016/j.
mseb.2007.04.006
15. Larson AC and Von Dreele RB. General Structure Analysis System (GSAS). Los Alamos National Laboratory Report LAUR. 1994; 86-748.
16. Toby BH. EXPGUI, a graphical user interface for GSAS.
Journal of Applied Crystallography. 2000; 34:210-213. http://
dx.doi.org/10.1107/S0021889801002242
17. Cook RL and Sammells AF. On the systematic selection of perovskite solid electrolytes for intermediate temperature fuel cells. Solid State Ionics. 1991; 45:311-321. http://dx.doi.
org/10.1016/0167-2738(91)90167-A
18. Tian C and Chan SW. Ionic conductivities, sintering temperatures and microstructures of bulk ceramic CeO2 doped with Y2O3. Solid State Ionics. 2000; 134:89-102. http://dx.doi.
org/10.1016/S0167-2738(00)00717-7