Resumo
Esse artigo apresenta uma metodologia para análise de granulometria por imagem, baseada na modelagem de energia no espaço das freqüências, utilizando a transformada Wavelet. Apresenta uma breve revisão da ferramenta da transformada Wavelet, e detalha a metodologia proposta. Os resultados apresentados foram obtidos utilizando imagens simuladas numericamente e imagens experimentais. Esses resultados mostram uma correlação importante entre a energia dos coefi cientes das Wavelets e a distribuição das dimensões dos objetos analisados.
Palavras-chave: Processamento de imagem, granulometria, Wavelet, materiais granulares.
Abstract
A methodology for granulometric image analysis based on modeling the spatial energy of frequencies, using the Wavelet transform is presented in this article. A brief review of the Wavelet Transform tool is presented, and the proposed methodology is detailed. The presented results were obtained using numerically and experimentally simulated images. These results show the relevant correlation between the energy of the Wavelet coeffi cients and the size distribution of the analyzed objects.
Keywords: Image processing, granulometry, Wavelet, granular material.
1. Introduction
The scientifi c and technological domain associated with computer vision includes many and diversifi ed applications, such as industrial automation, remote sensing, event detection for surveillance purposes, and biological image analysis (Gonzales & Woods, 2007). An interesting application for material science is the study of structures, based on image processing for the accurate estimation of specifi c characteristics (Mahadevan & Casasent, 2003). This particular type of computer vision tool provides imagery facilities for the identifi cation and/or classifi cation of objects under static or dynamic conditions (Pratt, 1991). In the last decades, the application of automatic visual inspection for geological terrain approaches has become a reality, providing advances in mining production
Elisângela Fátima Oliveira
Engenheira, MSc., Programa de Pós-Graduação em Engenharia dos Materiais - REDEMAT, Universidade Federal de Ouro Preto - UFOP E-mail: [email protected]
Andrea Gomes Campos
Bianchi
Professora Adjunta, Dra., Departamento de Física - DEFIS, Universidade Federal de Ouro Preto - UFOP
E-mail: [email protected]
Luiz de Siqueira
Martins-Filho
Professor Adjunto, Dr., Centro de Engenharia, Modelagem e Ciências Sociais Aplicadas - CECS, Universidade Federal do ABC - UFABC
E-mail: [email protected]
Romuel Figueiredo
Machado
Professor Adjunto, Dr., Departamento de Física - DEFIS, Universidade Federal de Ouro Preto - UFOP E-mail: [email protected]
Mineração
Granulometric analysis based on the energy
of Wavelet Transform coeffi cients
(Debba et al., 2006; Francus, 1998). The main purpose of these systems is to monitor the characteristics of mined material; analyzing their composition and granular aspects.
In this specifi c context, the methods traditionally employed are based on segmentation techniques (Gonzales & Woods, 2007; Mahadevan & Casasent, 2003; Francus, 1998), which involves partitioning of the image space domain, composing mutually excluded regions, where an interest feature appears uniformly and homogeneously. Even though the segmentation technique i s w i d e l y e m p l o y e d i n i m a g e processing, it presents some relevant analysis limitations when applied to natural or processed material having superposed and occluded objects in the image. Moreover, other problems can hinder segmentation efficiency, e.g. image noises, inhomogeneous/ defi cient illumination, color and texture complexity.
This article presents a method of granulometric image analysis that does not make any kind of individualization of the image objects. Instead of trying to recognize the shape and size of each object through segmentation-like procedures, we intend to obtain transformed information to analyze image homogeneity (Oliveira, 2007). The main objective is to deal with the granulometric analysis of digital images using the special energy of frequencies o b t a i n e d b y w a v e l e t t r a n s f o r m (Kaiser, 1994; Mallat, 1999; Morettin, 1999). This analysis tool will provide auxiliary information for monitoring industrialized mineral processing. The results are evaluated taking into account the statistical correlation between the spatial frequency patterns for two wavelet transform coeffi cients: approximation and details.
2. Methodology
Wavelets are functions with characteristics that have made them known as small waves. More than functions, the wavelets consist of
families of functions generated by spatial translations and scaling (dilatations or contractions) of one function (t), named mother-wavelet, as represented by the Eq. (1):
(1)
where b is the translation parameter, and a is the scale factor.
The mother-wavelet is not unique, and classic literature about wavelet transform recommends choosing the wavelet family based on the features of the analyzed phenomenon, e.g. an image or any kind of signal. The usual families are the wavelets of Haar (Stollnitz et al., 1995), Daubechies (Daubechies, 1992) and Morlets (Antoine et al., 1993).
The main properties of wavelets for the time domain are (Kaiser, 1994): (i) a wavelet is a fi nite function and it’s admissible, i.e. in spite of oscillation, it has zero average; (ii) a wavelet is a regular function, with the derivative properties of smoothness and continuity; (iii) a wavelet is a function with compact support, that means it is located in the space. These features permit wavelet approximation by the superposition on the mother-wavelets functions, resulting in a set of time-scale representations of signal, each one with a different resolution, i.e. a multi-resolution analysis.
Supposing a function ψa,b(t) presents the wavelet characteristics, the Continuous Wavelet Transform of a function f ∈ L²(ℜ) is defi ned by the convolution between the analyzed signal and the wavelet function, as represented by Eq. (2).
(2)
The wavelet function W(a,b) belongs to the intersection of two spaces, L1(ℜ) and L²(ℜ), in such a way that the function family can be orthogonal or not. The orthogonal one defi nes a wavelet basis whose main advantage is to allow the perfect reconstruction of the signal using the coeffi cients of the direct
transform (Mallat, 1999; Daubechies, 1992). Nevertheless, there are many applications of wavelet transforms where orthogonal functions are not used (Daubechies, 1992).
The discrete version of wavelet transform has several approaches. The main one is defi ned through the discretization of the convolution procedure, and can be computed using the Fast Fourier Transform (Mallat, 1999). Other methods proceed by restricting the values of the scaling and translation parameters in a discrete range, that means a = a0j and b = k b
0 a0 j, with
i, j ∈ℜ, a0 > 1, and b0 > 1 (Daubechies, 1992). Particularly, one of the most common cases is obtained using a0 = 2 and b0 = 1, resulting in the wavelet function expressed by Eq. (3).
(3)
In this context, different j values correspond to different wavelet widths. Therefore, it is strongly desirable to have a translation parameter value b dependent of j, in such a way that the narrow wavelets (high frequencies) are translated using small steps, while the wide wavelets (low frequencies) are translated using greater steps (Kaiser, 1994). The discrete wavelet transform is given by Eq. (4), where n = 2j.
(4)
The mathematical concept of multi-resolution analysis involves the study of a crescent sequence of closed subspaces Vj | j ∈ Z satisfying some specifi c properties and composing a function’s space (Kaiser, 1994; Mallat, 1999). In other words, every time a set of closed subspaces satisfi es the multi-resolution properties, there is an orthogonal wavelet basis (Φj,k : k ∈ Z) such that for each signal f ∈ L², there exists a representation composed of approximations (scale functions) and details (wavelet functions) projected in the subspace. The detail functions described by wavelets are equivalent to the function expressed by Eq. 3. The approximation or scale functions Φ originates from a family of functions that are orthogonal to the wavelets. These functions are named father-wavelets (see Eq. (5)).
(5)
The approximation representation of f is obtained using different levels of resolution, in such way that the subspace Vj is composed of approximation functions. To improve approximation, orthogonal projection of f over each Vj is performed. When the level goes from j to j+1, i.e. the representation advances with the condition VjVj+1, details will be added to the image representation and information will be improved. At each step, the approximation coeffi cient cA receives less infl uence of from the high-frequency signal (or image) components. Meanwhile, the detail coeffi cient cD consists mainly of high-frequency components and noises.
The opposite reasoning is also valid, i.e. when one approximates f of the lower resolution level, the signal information is lost (Mallat, 1999). Considering a signal represented with a given resolution (j-1), the scaling functions
Φ(x) form a basis for a signal set. In this context, the signal and its detail are combined with a fi ner resolution level j. In such way, all approximation and details contents are obtained using a successive process of decimation, called convolutions. The multi-resolution analysis is consequently responsible for the division of the original signal in different scales of resolution, named sub-band codifi cation (Kaiser, 1994). For this procedure, in the discrete wavelet transform, each signal x(t) belonging to the space Vj |Vj = Vj+1 + Wj-1 can be expressed by the basis of each space, where Wj is the orthogonal complement of the space Vj . Therefore, using the coeffi cients generated in the fi rst approximation A0(k) belonging to the scale J (Eq. (6)), the coeffi cients A1(k) and D1(k), scale j-1, can be determined (Eq. (7)).
(6)
(7)
This procedure includes signal decomposition to obtain the approximation and detail features by applying fi lters on the original signal. The resulting signal approximation corresponds to a low resolution of the signal representation, containing the low frequencies, while the resulting signal details correspond to the signal’s high frequencies, or the difference between two successive low resolution representations of the signal.
Alternatively, the signal reconstruction procedure goes on in the inverse sense of the decomposition (Oliveira, 2007). It may be initialized by departing from the coeffi cients A1(k) and D1(k) of the scale j-1, to produce the coeffi cient A0(k) of the scale j. This reconstruction operation is called synthesis.
2.1 Image analysis using wavelets
The application of the wavelet transform to a two-dimensional signal using filtering is similar to the one-dimensional procedure. The signal is transformed by fi ltering it through two fi lters, a low-pass and a high-pass. As a result, the original signal is divided into two signals containing different information.
The low-pass fi lters are also called smoothing fi lters. They present the property of maintaining the same coeffi cients for the convolution mask, independent of the image position or the invariance to translations. Another important property is the implementation of fi lters by the convolution operation, where the chosen mask defi nes the linear fi lter type to be applied. The main functions of the low-pass fi lters are to remove the small details of the original image and to attenuate noise. On the other hand, the high-pass fi lters have the function of putting the high frequencies of the original image in evidence. This action reinforces the edges and other fi ne details of the image (Stollnitz et al., 1995).
In a practical sense, the application of the low-pass and high-pass fi lters to the matrix representing the digital image corresponds to iterations of algebraic operations on lines and columns of the original matrix, in such a way that each level of iteration produces 4 sub-images with the wavelet coeffi cients (Stollnitz et al., 1995), one representing the approximation coeffi cients and the three others representing the details of the three directions on the image plan (horizontal, vertical and diagonal).
Figure 1 presents the coeffi cients decomposition for the two-dimensional wavelet transform. The scale function determines the approximation coefficients aj, the detail coeffi cients are represented by dH
j, d V
j and d D
j, corresponding
to the vertical, horizontal and diagonal directions, respectively, while the j index is associated to the resolution level.
procedure is to take into account the characteristics of wavelet family, as well as the features to be analyzed in the signal (Mallat, 1999).
For this research, the Haar wavelet family was chosen. The main reasons for this option are the compact support of this wavelet family; the simplicity of its application, including the low computational requirements; and the effi ciency and performance for detecting abrupt changes in the image (e.g. objects edges) (Stollnitz et al., 1995). The one-dimensional scale function of the Haar family is defi ned as shown in Eq. (8), and the wavelet expression is given by Eq. (9), known as the step function, with translations and dilations generating an orthonormal basis in L².
(8)
(9)
The digital image decomposition using the two-dimensional wavelet basis can be obtained in two different ways: standard and non standard decompositions (Stollnitz et al., 1995). The standard decomposition is performed by applying the one-dimensional wavelet transform in two directions of the image. Firstly, the transform is applied to the image lines, and afterwards, to the columns. The construction of this basis consists of all possible tensor products of a function of the one-dimensional basis.
In the case of the non standard decomposition, the transform application alternates lines and columns, and its two-dimensional basis is based on separable scaling and wavelet functions (Stollnitz et al., 1995). In such a way, the scale function is defi ned by Eq. (10), and the wavelets are given by Eqs. (11), (12) and (13), respectively for three directions (horizontal, vertical and diagonal).
(10)
(11)
(12)
(13)
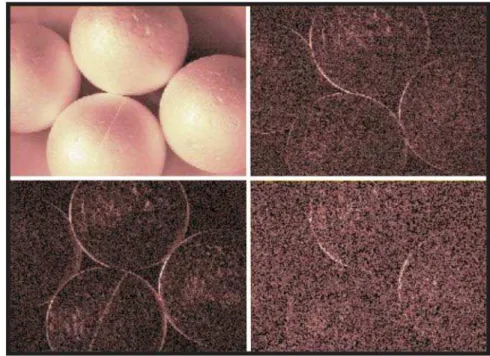
The Haar wavelet transform of images was computed using decomposition in low and high frequencies, relative to the approximation and detail coeffi cients. This transform uses Eqs. (10), (11), (12) and (13). The Figure 2 shows the results of the wavelet transform, where the superior left quadrant
correspond to the approximation coeffi cients aj, and the other quadrants corresponds to the detail coeffi cients: horizontal dH, vertical dV and diagonal dD, respectively, superior right, inferior left and inferior right.
2.2 Energy of wavelet coeffi cients
In accordance with the wavelet theory, the signal can be described in the time and frequency domains, where the signal amplitude is represented, respectively, as a function of time and as a function of each frequency. The proposed granulometric analysis is supported by the fact that the determination of the spatial scale pattern, and its variation, can be an approach to estimate the sizes of the objects composing a digital image. This hypothesis is based on the modeling of the granulometric distribution system. This modeling is supposed to be determined by the high and low frequencies of the signal, as well as the local energy distribution, so that signal features are extracted using the multi-resolution (spatial scale) framework of discrete wavelet transform.
Such assumptions became more reliable if we assumed the granulometric distribution as a texture analysis. Texture may be described roughly by its coarseness; the arbitrary spatial repetition of local pattern structures. As such, a large period implies a coarse texture; a small period implies a fi ne texture (Gonzales & Woods, 2007; Pratt, 1991). The patterns are repeated over image regions defi ning periodic homogeneous regions. This perceptual coarseness is clearly not suffi cient as a quantitative texture measure, but can at least be used as a guide for variation of texture measures.
In fact, the recent methods for texture classifi cation support the notion of spatial-frequency (multiscale) analysis that maximizes the simultaneous localization of energy in both spatial and frequency domains. Such analysis may be provided using the multi-resolution representation of the wavelet theory (Laine & Fan, 1993; Unser, 1995). Experimentally, the wavelet’s capabilities have provided a powerful discrimination tool despite their sensitivity and selectivity, compared to traditional resolution techniques (Aksoy & Haralick, 1998; Davis, 1980).
T h i s p a p e r p r e s e n t s t h e granulometric analysis of the wavelet transformed signal using the energy computations. This analysis revealed the strong relationship between the relative sizes of the objects and their associated energies (Pun & Lee, 2004). Energy determination is based on the Parseval Theorem, i.e. considering that the energy contained in the signal is equal to the summation of the energy contained in the different resolution levels of the wavelet transform (Mallat, 1999). In other words, the signal energy can be decomposed in terms of the transform coeffi cients.
Based on this reasoning, the Haar wavelet transform is applied to compute the energy coefficients. The energy corresponding to the approximation coeffi cients is obtained using Eq. (14), while the energy corresponding to the detail coeffi cients is obtained using Eq. (15), where the details of the vertical, horizontal and diagonal directions are considered. In the following computational step, the correlation between these two energies is determined using Eq. (16).
(14)
(15)
(16)
3. Results
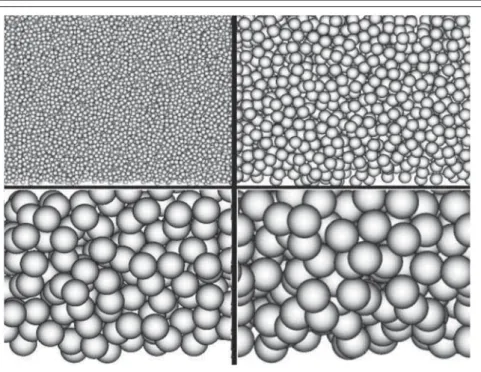
The methodology proposed in this article was validated through tests considering two image sets. The first image set is composed by numerically simulated images of piled-up spheres. Examples of these images are shown in Figure 3, where the defi ned sphere diameters are 15, 35, 75 and 90 pixels. The second set of images corresponds to experimental images of expanded polystyrene balls with different diameters. The images were taken using a digital camera, under similar illumination conditions. The experimental images were produced using balls with diameters between 15 and 90mm (Figure 2 shows an image of the balls with a 60 mm diameter).
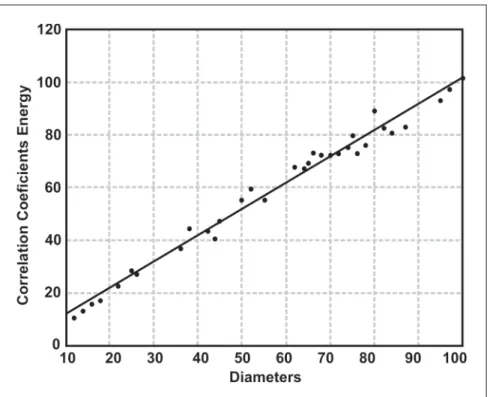
The first analysis procedure concerns the images obtained with numerical simulations. The ratio, Eratio, for the detail and approximation energies (Eqs. (14), (15) and (16)) was calculated for each image. The variation of Eratio with respect to the sphere diameters can be seen in Figure 4. Notice the linear behavior of this graph, with the uniform and growing slope of the energy ratio with the augmentation of sphere
diameter. An interesting remark: besides the different layers superposing, i.e. different pile-ups, the analysis procedure did not result in different results. In other words, the method is quite robust with respect to these pile-up variations.
The same procedure was applied to the images of expanded polystyrene balls. Figure 5 shows the graph of the energy ratio with respect to ball diameters. In this case, we obtain the same linear tendency observed in the preceding case. The correlation is superior to 95%.
3 . 1 A n a l y s i s o f
heterogeneous mining
material images
The procedure proposed herein, tested in simulated digital images and in prepared experimental images, should be applied to more realistic problems. Considering actual mining material, another aspect appears: the heterogeneity of the objects in the image, i.e. the real objects present different shapes and relative dimensions.
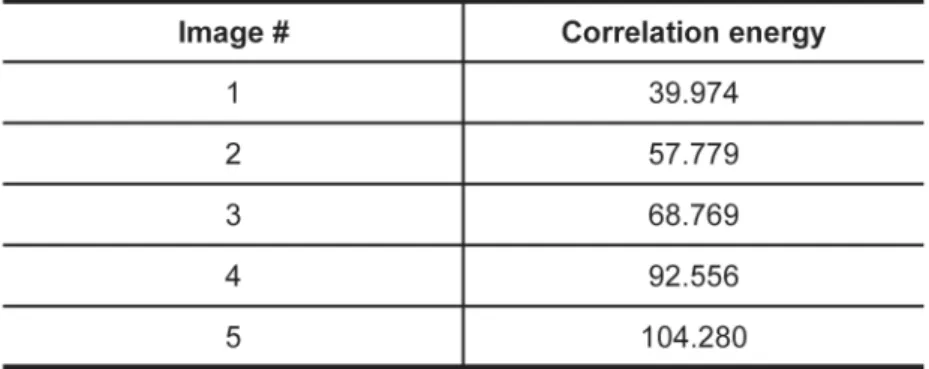
In order to evaluate the results of the energy corresponding to the wavelet transform coeffi cients for this problem, the set of images presented in Figure 6 is considered. This Figure shows 5 images of rock fragments composing different confi gurations. Image #1 is the most homogeneous, presenting fragments with quite similar dimensions. Quite to the opposite, Image #5 presents the most heterogeneous situation, where a range of objects, from large fragments to very fi ne sand can be seen. Images #2, #3 and #4 present intermediate situations of increasing heterogeneity. The presence of fine sand represents an important problem for the use of traditional techniques based on segmentation.
E v i d e n t l y, t h e q u a n t i t a t i v e evaluation of image heterogeneity is a quite diffi cult task. Diverse criterions to disparity graduation involving shapes and dimensions of objects, as well their relative concentration in each image could be proposed. As a consequence, we will restrict the analysis of these image sets to the qualitative aspects, aiming to search for the potential applications of wavelet-transform-based techniques. Even without this quantitative exactness and accuracy, it is possible to expect results pointing to the correlation between the variations of the coeffi cient’s energy and the proposed qualitative sequence of increasingly heterogeneous images (from image #1 to image #5, in Figure 6). The results of the computed correlation energy using the same mathematical expression used in the case of the simulated spheres and the expanded polystyrene balls are shown in Table 1.
These results confi rm the intuitive ordering of the images with respect to the increasing heterogeneity of fragmental aspects and distribution. And they strongly suggest that a deep study concerning this specifi c objective of evaluating the heterogeneity of a material based on the sample image analysis be performed by applying the wavelet transform technique.
Figure 3 - Samples of numerically simulated images of piled up spheres of 15, 35, 75, and 90 pixel diameters.
Figure 4 - Correlation energy vs. diameter (in pixels) variations in simulated spheres.
4. Conclusion
The results presented in this article suggest the confi rmation of the main hypothesis about the evaluation of the granulometric variation of a set of digital
problem modeling is based on spatial frequency decomposition resulting from the application of low-pass and high-pass fi lters to obtain the low and high spatial frequencies, respectively.
Moreover, the technique proposed presents aspects of robustness and capacity to obtain high correction performance in different situations, such as when analyzing images with diverse geometries and object superposition occurrence. The evaluation of this technique induces a positive conclusion about its application as an auxiliary tool for the characterization and classifi cation of particularly granular material. It may also be applied together with other tools based on conventional approaches, such as segmentation, improving signifi cantly the performance and result qualities, particularly when the image presents object superposition diffi culty.
A n o t h e r a d v a n t a g e t o b e remarked here concerns the easiness of the technique’s implementation; a consequence of the wide availability of computational packages and hardware devices designed for wavelet transform based on the Haar function. These characteristics point to practical applications for industrial processes, mainly mining and metallurgical activities, in real-time monitoring of diverse granular material for its size composition evaluation.
5. Acknowledgements
T h e a u t h o r s w o u l d l i k e t o acknowledge the support of REDEMAT/ UFOP, CNPq, FAPEMIG, and CAPES/ MEC.6. References
AKSOY, S., HARALICK, R.M. Textural features for image database retrieval, Technical report. Seattle: University of Washington, 1998. 5 p.
ANTOINE, J.P., CARETTE, P., MURENZI, R., PIETTE, B. Image analysis with two dimensional continuous wavelet transform. Signal Processing, v. 31, p. 241-272, 1993.
Figure 5 - Correlation energy vs. diameter (in mm) variations in polystyrene balls.
DAUBECHIES, I. Ten lectures on wavelets. Philadelphia: SIAM, 1992. 377 p. DAVIS, L.S. Image texture analysis
techniques survey. In: SIMON, J.C., HARALICK, R.M. (Eds.). Digital image processing. Dordrecht: D. Reidel, 1980. p. 189-201.
DEBBA, P., CARRANZA, E.J.M., VAN DER MEER, F.D., STEIN, A. Abundance estimation of spectrally similar minerals by using derivative spectra in simulated annealing. IEEE Transactions on Geoscience and Remote Sensing, v. 44, n. 12, p. 3649-3658, 2006.
FRANCUS, P. An image-analysis technique to measure grain-size variation in thin sections of soft elastic sediments.
Sedimentary Geology, v. 121, p. 289-298, 1998.
GONZALES, R.C., WOODS, R.E. Digital image processing. Lebanon: Pearson Prentice Hall, 2007. 976 p.
JAWERTH, B., SWELDENS, W. An overview of wavelet based multiresolution analysis. SIAM Review, v. 36, n. 3, p. 377-412, 1994.
KAISER, G. A friendly guide to wavelets. Boston: Birkhauser, 1994. 325 p. LAINE, A., FAN, J. Texture classifi cation
by wavelet packet signatures. IEEE Transactions on Pattern Analysis and Machine Intelligence, v. 15, n. 11, p. 1186-1191, 1993.
Table 1 - Correlation energy of wavelet coeffi cients for the rock fragment images.
MAHADEVAN, S., CASASENT, D. Automated image processing for grain boundary analysis.
Ultramicroscopy, v. 96, p. 153-162, 2003.
MALLAT, S. A wavelet tour of signal processing. San Diego: Academic Press, 1999. 637 p. MORETTIN, P.A. Ondas e ondaletas: da análise de Fourier à análise de ondaletas. São
Paulo: Editora da USP, 1999. 272 p.
OLIVEIRA, E.F. Estudo da granulometria em imagens via a modelagem das freqüências espaciais. Ouro Preto: Universidade Federal de Ouro Preto, 2007. 87 p. (Dissertação de Mestrado).
PRATT, W.K. Digital image processing. New York: John Wiley & Sons, 1991. 698 p. PUN, C., LEE, M. Extraction of shift invariant wavelet features for classifi cation of images
with different sizes. IEEE Transactions on Pattern Analysis And Machine Intelligence, v. 26, n. 9, p. 1228-1233, 2004.
STOLLNITZ, E.J., DEROSE, T.D., SALESIN, D.H. Wavelets for computer graphics: a primer.
IEEE Computer Graphics and Applications, v. 15, n. 4, p. 75-85, 1995.
UNSER, M. Texture classifi cation and segmentation using wavelet frames. IEEE Transactions on Image Processing, v. 4, n. 11, p. 1549-1560, 1995.
Artigo recebido em 25/10/2008 e aprovado em 20/10/2009.