! " # $# % &
' ( ) " *
! " # $# % &
"
! " # $# % &
The present paper shows experimental results about soot suppression on a laboratorial scale jet free diffusion flame of liquefied petroleum gas submitted to acoustic oscillations. The experiments were conducted to verify the influence of amplitude and frequency of oscillations in the regions of soot formation and suppression through the flame. To quantify the soot presence the laser induced incandescence was utilized. The results show combinations of frequency and amplitude of oscillation which the presence of soot is close to zero.
Keywords: pulsating combustion, soot presence, diffusive flame
Introduction
1
The pulsating combustion process has been object of important researches because it may offer several advantages for energy generation, such as: fuel savings, lower partially oxidized pollutant formation, increased convective heat transfer rates, and reduced investment when compared with conventional technologies (Zinn, 1996). Pulsating combustion can be considered as a combustion process in which the state parameters are submitted to oscillatory conditions; therefore, they change periodically with time (Zinn, 1986). For pulsating flames, the temporal or special correlations are organized and higher amplitudes are reached (Libby and Williams, 1994).
In 1777, Byron Higgins (cited by Zinn, 1986) related the first example of pulsating combustion, the singing flame. It was a flame anchored in a hydrogen burner positioned in a vertical tube, generating a considerable high amplitude sound as consequence of the excitation of the fundamental acoustic mode or one of the harmonics. The pulsating combustion occurrence depends on the burner characteristics, the flame structure and the tube. The phenomenon has been known since 1777, but the first attempts to use the advantages of pulsating combustion process only happened in the beginning of the twentieth century, influenced by the development of internal combustion engines. The first applications were in propulsion systems and gas turbine power plants.
Some combustors are especially designed for the situation in which the combustion is the responsible for the excitation of the acoustic oscillations, for example the Rijke-tube combustor (Carvalho et al., 1989). On the other hand, for conventional combustion chambers, an external actuator is necessary to induce the oscillations, such as speakers strategically positioned in the burner or on the chamber wall. The external actuators can also be used in chambers where the flame is sufficient to induce the oscillation; the idea is to amplify or to diminish the amplitude, because those self-pulsating-chambers have narrow amplitude and frequency ranges.
In addition, to the increase the combustion efficiency, other important characteristic of pulsating combustion is the possibility of
Paper accepted January, 2009. Technical Editor: Demétrio Bastos Neto
low pollutants emissions. The presence of oscillations enhances the rate of reactants mixing process; so that, it is possible a combustion process with reduced presence of partial oxidation pollutants, as soot, carbon monoxide (CO), and unburned hydrocarbons (UHC). Consequently, several researches have been conducted to understand how the presence of the acoustic oscillation can change the flame structure and the impact on the pollutants emissions. Yoshida et al. (2001) have studied the presence of an acoustic field in turbulent jet diffusion flames, and they observed that at the resonant conditions the transient from laminar to turbulent flow is enhanced, and consequently the turbulent intensity of the flow increases markedly. But the long predominantly diffusive flames are normally not able to auto-excite acoustically the confined combustion, neither to amplify the oscillations in the case of external actuation, as presented by Ferreira et al. (2006). However, a previous work of Ferreira et al. (2005) shows that flames predominantly diffusive are more susceptible than premixed flames to strong changes in the combustion gases composition when an external acoustic field is applied. When the acoustic oscillation is applied to an originally diffusion flame, the traditional structure of this kind of flame changes to look like a predominant premixed flame, with large quantities of oxygen into the jet fuel side, as the results presented by Rocha et al. (2006).
The present work is concerned to the soot suppression by acoustic oscillated combustion of laminar diffusion flames of Liquefied Petroleum Gas (LPG). In spite of the low practical application of laminar diffusion flames, it is frequently used as a research tool in fundamental studies of soot formation in combustion systems and, hence, has a large literature associated with it (Turns, 1996).
The chemistry and physics of soot formation in diffusion flames are exceedingly complex, but they (chemistry and physics) can be summarized in four steeps: 1) formation of precursor species (polycyclic aromatic hydrocarbon – PAH); 2) particle inception; 3) surface growth and particle agglomeration; 4) soot oxidation. For more details of soot formation in combustion, Glassman (1998) provides a general review.
oxidant concentration is close to zero and exposed to the bath of species from pyrolizing fuel. At some instant, the soot particle can pass through an oxidizing region of the flame; in the case of jet flame this region is invariably the flame tip. Therefore, the total soot emission is the difference between the soot formed in the flame inner region and soot oxidized in the flame tip.
As the presence of oscillations increases the turbulence level (Yoshida et al., 2001) and the oxygen in the inner side of the flame (Turns, 1996), there are expectations of lower soot formation and enhancement of soot reduction. Saito et al. (1998) have studied the soot suppression by acoustic oscillated combustion in free diffusion flames. The authors pointed that for laminar flow region the efficiency of soot suppression is 50%, while the efficiency exceeds 90% in the turbulent flow region. The experiments of Saito et al. also showed that the flame temperature for acoustic oscillation combustion was higher than non-oscillated combustion, and they considered that the acoustic oscillation enhanced the mixing of the fuel gas and surrounding air. Therefore, these two new aspects, more temperature and oxygen, caused the re-oxidation of soot particles.
In this context, the present work shows the experimental investigation of the soot presence in a LPG jet free diffusion flame with and without the acoustic oscillation to verify the influence of frequency and amplitude of oscillation. The fuel flow was acoustically excited before the burner exit by a speaker strategically positioned. The experiments were conducted for 0.14 g/s of LPG. To quantify the soot presence the laser inducing incandescence induced (LII) was utilized.
Experimental Setup
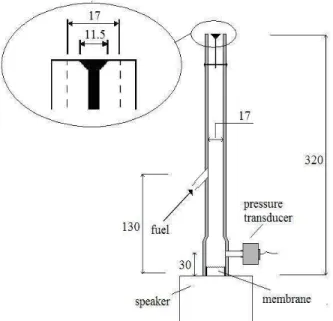
Figure 1 shows the LPG laboratorial scale burner. In the burner inner duct 0.14 g/s of gas fuel flows, measured by an appropriated rotameter, and at the base of this duct a speaker was coupled to acoustically excite the flow. In the duct exit a flame holder disc was positioned to maintain the flame close to the burner, especially in the case with acoustic oscillation. The signal of a Kistler 7261 piezoelectric pressure transducer at 3.0 cm above the speaker was considered as the reference of acoustic excitation condition. The concept of the burner was developed by Caldeira Pires et al. (1999).
Figure 1. Schema of LPG laboratorial scale burner. The burner dimensions
The speaker was fed by a sinusoidal signal generated by a Hewlett-Packard - HP 3310A function generator, and amplified by a Proximity-750AP (100/300W) amplifier. The speaker power was 50 W and the impedance was 16 Ohms. The piezoelectric pressure transducer signals were amplified by a Kistler 5006 charge amplifier and monitored by a Tektronix 7633 oscilloscope. The piezoelectric pressure transducer specifications are: measuring range -1 to 10 bar, maximum pressure 12 bar, resolution 1.5 x 10⁻⁵ bar, sensitivity 2200 pC/bar. Figure 2 shows the system of the acoustic actuation and amplitude identification.
Figure 2. Experimental setup.
The frequency was adjusted on the function generator, and this value is the reference for the experiment. The uncertainty adopted for the frequency is the equipment uncertainty, maximum 1% for the range performed here. On the other hand, the amplitude is measured by the piezoelectric pressure transducer and its uncertainty was determined by calibration. The present work transducer and a standard transducer are coupled into a chamber fed by a pulsed flow, and results are compared for different frequencies and amplitude. The uncertainty is calculated for the point of 95% probability in “Students t” curve:
1 2 1 2
1 2 2
100 95
A A A
IA = ⋅ − + ⋅σ + ⋅σ , (1)
Where A is the average amplitude, σ is the SD and the subscripts 1 and 2 are related to the standard and used transducers, respectively. For the frequencies and amplitudes performed here, the maximum uncertainty for the acoustic pressure amplitude was 5%.
To observe the soot presence in the flames it was utilized the laser inducing incandescence (LII), which principle is based on the interaction between the laser radiation and the soot particles (Vander Wal et al., 1997; and Schraml et al., 2000). The absorption of laser radiation for power density equal or higher than 1 x 10⁷ W.cm-2 increases the soot particle temperature to 4000 K. At this level of temperature the particles issue radiation (incandescence) is close to the emission of a black body. The intensity of the issued radiation is linearly proportional to the soot concentration (Vander Wal et al., 1997).
The incandescence in soot particle was obtained by a pulsed CO2
of focal distance was used. The soot radiation was collected using a quartz lens of 100 mm of focal distance and a diameter of 2”. The flame image is projected directly to the monochromator slit of 500 µm for all experiments. In the monochromator outside a photomultiplier Hamamatsu R977 of 750 V is positioned to measure the light intensity in the specific wavelength, generating a voltage signal, which after amplified is read in an oscilloscope. The results of soot presence are in voltage signal (mV), what is proportional to soot concentration, and each result presented here is the mean value of 32 samples.
The laser energy was measured with a Gentec Joulemeter, model PRJ-M and its accuracy is ≤ 10%. The measurement of laser energy is an average of 10 lasers pulses and the deviation was around 10% pulse-to-pulse.
Results and Comments
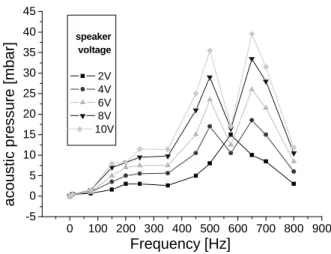
To observe burner resonant frequencies, constant voltages were applied to the speaker (the maximum voltage allowed to the speaker is 10 V) and the acoustic pressures were measured by the piezoelectric transducer for several frequencies (0 to 800 Hz). Figure 3 shows that there are two resonant peaks, 500 Hz and 650 Hz. At resonant frequencies it is possible to reach higher pressure amplitude, which plays an important role in the soot suppression. However, the soot behavior with the acoustic oscillation was also investigated in other frequencies: 250 Hz, 450 Hz, and 800 Hz.
0 100 200 300 400 500 600 700 800 900
-5 0 5 10 15 20 25 30 35 40 45
speaker voltage
2V 4V 6V 8V 10V
Frequency [Hz]
a
c
o
u
s
ti
c
p
re
s
s
u
re
[
m
b
a
r]
Figure 3. Acoustic pressure versus frequency of oscillation for different speaker voltage.
The soot signals were obtained in jet center line in three different distances from the burner, 3 cm, 6 cm, and 10 cm. The center line is not probably the region of higher soot concentration, but it is the most difficult soot suppression region, due to the difficulty of oxygen presence to oxidize the fuel and to reduce the soot formation or to oxidize the soot formed. Rocha et al. (2006) showed that the acoustic oscillation introduces oxygen into the jet fuel side of a diffusion flame; however, in the center line region the oxygen concentration is lower. So, the center line is an important region to the study of soot suppression by acoustic oscillation.
As presented in the next figures, for non-oscillation case (frequency 0), the soot presence increases from 3 cm to 10 cm, indicating that the region of investigation is a zone of soot formation for the non-pulsating diffusion flame.
0 2 4 6 8 10 12
0 200 400 600 800 1000 1200 1400 1600
Position 3cm 6cm 10cm
s
o
o
t
s
ig
n
a
l
[m
V
]
acoustic pressure [mbar]
Figure 4. Soot signal versus acoustic pressure for 250 Hz.
For a determined frequency, the pressure amplitude was increased until it reached the limit of speaker voltage, 10 V. Figures 4, 5, 6, 7 and 8 show the soot presence with the increase of acoustic pressure for the frequencies 250 Hz, 450 Hz, 500 Hz, 650 Hz, and 800 Hz, respectively.
Figures 4 to 8 show the general behavior of soot presence reduction with the increase of acoustic pressure. However, there are some particularities according to the frequency and position of analysis. In case of excitation frequency of 250 Hz, Fig. 4, the global tendency was the reduction of soot presence. But for the positions 6 cm and 10 cm the soot presence was practically the same when the acoustic field was applied, indicating that flame region became a non-soot formation region. For 250 Hz the maximum acoustic pressure was 11.3 mbar (corresponding to 10 V), and the soot reduction at 10 cm was from 1521 mV to 480 mV.
0 5 10 15 20 25
0 200 400 600 800 1000 1200 1400 1600
Position 3cm 6cm 10cm
s
o
o
t
s
ig
n
a
l
[m
V
]
acoustic pressure [mbar]
Figure 5. Soot signal versus acoustic pressure for 450 Hz.
0 5 10 15 20 25 30 35 0
200 400 600 800 1000 1200 1400 1600
s
o
o
t
s
ig
n
a
l
[m
V
]
acoustic pressure [mbar] Position
3 cm 6 cm 10 cm
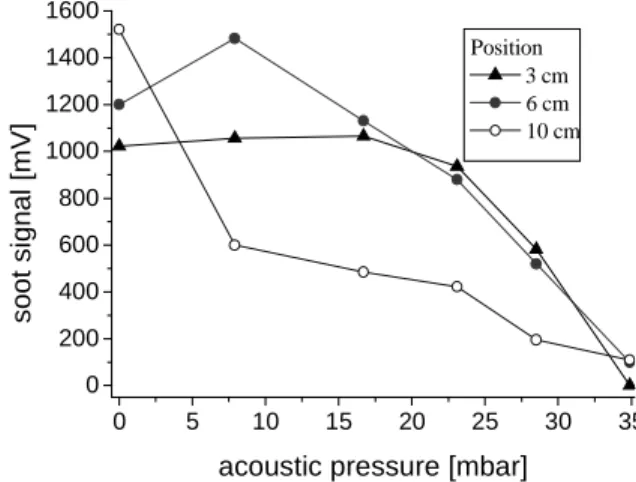
Figure 6. Soot signal versus acoustic pressure for 500 Hz.
In the case of 500 Hz, which is a resonant frequency, a particular behavior for soot suppression is observed in Fig. 6. In this case, the maximum acoustic pressure for 10 V in the speaker was 35 mbar. Until 15 mbar the region between 3 cm and 6 cm was kept as a zone of soot formation; the soot signal increased between these points. On the other hand, the region between 6 cm and 10 cm changed to soot reduction or oxidation region. Above 15 mbar, there is practically no more soot formation between 3 cm and 6 cm, and a good part of the soot formed until 3 cm above the burner exit is oxidized between 6 cm and 10 cm. In 35 mbar, the soot signal in the jet fuel center line is close to zero.
In case of 650 Hz, also a resonant frequency, Fig 7 shows the same tendency comparing to that of 500 Hz frequency; however, the region between 3 cm and 6 cm changes rapidly to a non-soot formation zone, between 6 cm and 10 cm is a soot reduction zone, and for 33 mbar the soot signal is practically zero in all positions.
The maximum acoustic pressure for 800 Hz was 11.6 mbar, when the speaker voltage reached 10 V, and the results presented in Fig. 8 show that acoustic field was not efficient to reduce the soot presence and that in some cases, the soot signal increased.
0 5 10 15 20 25 30 35 40
0 200 400 600 800 1000 1200 1400 1600
s
o
o
t
s
ig
n
a
l
[m
V
]
acoustic pressure [mbar]
position 3 cm 6 cm 10 cm
Figure 7. Soot signal versus acoustic pressure for 650 Hz.
0 2 4 6 8 10 12
0 200 400 600 800 1000 1200 1400 1600 1800
position 3 cm 6 cm 10 cm
s
o
o
t
s
ig
n
a
l
[m
V
]
acoustic pressure [mbar]
Figure 8. Soot signal versus acoustic pressure for 800 Hz.
The good results for soot suppression at the resonant frequencies and the bad results for higher frequencies, for example 800 Hz, can be related to the behavior of the acoustic wave displacement outside the burner. Flügel (2006) investigated experimentally the influence of the acoustic wave displacement in the alcohol spray combustion excited acoustically. In this experimental setup, the speaker excites the air combustion flow. In case of resonance frequencies based on displacement calculations, a particle that follows the flow passes through fixed positions close to the burner exit more than twice, and the number of times the particle passes through a fixed position intensifies when the acoustic pressure increases. However, for frequencies higher than 700 Hz, the acoustic displacement is wretched, and no modifications in combustion gases composition were observed, mainly in partial oxidation combustion gases, carbon monoxide and unburned hydrocarbons. In addition, Rocha et al. (2006) show the acoustic excitation in diffusion flames at the resonance frequencies that introduces large quantities of oxidant in the fuel side of the flame, like a partial premixed flame. So, based on the considerations of Flügel (2006) and Rocha et al. (2006) for the present experiment, it is possible to imagine that at resonance frequencies higher acoustic displacements are reached, and the mixing between reactants intensifies. Then, the higher presence of oxygen in the region of soot formation creates a competition between fuel oxidation mechanism and soot formation that is favorable to fuel oxidation, due to faster reactions, and less soot is observed in this region. And for soot reduction region, the increase of oxygen concentration accelerates the soot oxidation.
Conclusions
The present work is a fundamental experimental study about the soot behavior when a laminar diffusion flame of LPG is submitted to an acoustic field. Different conditions of frequency and acoustic pressure were investigated, and the soot signal was observed in the jet fuel center line by incandescence induced by laser. The main conclusions are listed below:
imposed, practically zero soot signal was detected in 3 cm above the burner.
2. The reducing of soot formation and the increase of soot oxidation are enhanced when the acoustic pressure increases. So, as the acoustic answer is better for the resonant frequencies, then higher values for acoustic pressure could be reached until the speaker voltage limit (10 V), and as consequence, good results for soot suppression could be also reached for the resonant frequencies 500 Hz and 650 Hz. 3. For higher frequencies studied here, 800 Hz for example, the
presence of acoustic field is not efficient to reduce the soot presence. It is in accordance with others authors (Flügel, 2006; and Rocha et al., 2006), that observed little influence of higher frequencies to change the combustion dynamic, mainly as consequence of the weak displacement of the acoustic wave outside the burner. However, this conclusion cannot be generalized, because the present study was performed until 800 Hz, and higher frequencies must be investigated.
In spite of the important results observed here, it is just an introduction to the knowledge about how the pulsating combustion can be used to control or to suppress the soot presence in flames, or in combustion devices. The next step of this research is to compare radial profiles of soot presence, temperature, oxygen concentration, and radicals of hydrocarbons combustion (C2 and CH for example)
to better understand the interference of the acoustic field in the soot formation and oxidation mechanisms.
References
Caldeira Pires, A.A., Lacava, P.T., Ferreira, D.S. and Carvalho, J.A., 1999, “Effect of frequency and amplitude of oscillation on the premixed flame structure” (in Portuguese), Proceedings of XV Brazilian Congress of Mechanical Engineering, Águas de Lindóia, Brazil.
Carvalho, J.A., Ferreira, M.A., Bressan, C. and Ferreira J.L.G., 1989, “Definition of heater location to drive maximum amplitude acoustic oscillations in a Rijke tube”, Combustion and Flame, Col. 7, No. 1, pp. 17-27.
Ferreira D.S., Lacava, P.T., Carvalho Jr., J.A. and Ferreira M.A., 2005, “Experimental aspects of partially premixed pulsating combustion”, Proceedings of 3rd International Energy Conversion Engineering Conference, San Francico, USA.
Ferreira, D.S., Lacava, P.T., Ferreira, M.A. and Carvalho Jr., J.A., 2006, “The influence of the flame structure on the combustion oscillations in a cylindrical chamber”, Proceedings of: 12th AIAA/CEAS Aeroacoustics Conference/27th AIAA Aeroacoustics Conference, Cambridge, USA.
Flügel, A.D., 2006, “Experimental Investigation of the Acoustic Field Influence in the Sprays Burning” (in Portuguese), Master Degree Thesis, Instituto Tecnológico de Aeronáutica, São José dos Campos, Brazil, 149 p.
Glassman, I., 1998, “Soot formation in combustion process”, Proceedings
of 22nd International Symposium on Combustion, Pittsburgh, 295 p.
Libby, P.A. and Williams, F.A., 1994, “Turbulent Reacting Flows’, New York: Academic Press.
Rocha, A.M.A., Carvalho Jr., J.A. and Lacava P.T., 2006, “Application of pulsating combustion in the Delft jet diffusion flame burner”, Brandbrief TU Delft, Vol. 13, No. 1, pp. 22-25.
Saito, M., Sato, M. and Nishimura A., 1998, “Soot supression by acoustic oscillated Combustion”, Fuel, Vol. 77, No. 9/10, pp. 973-978.
Santoro, R.J., Yeh, T.T., Horvath and Semerjian, H.G., 1987, “The Transport and Growth of Soot Particles in Laminar Diffusion Flames”, Combustion Sciense and Thecnology, Vol. 53, pp. 89-115.
Schraml, S., Dankers, S., Bader, K., Will, S. and Leipertz, A., 2008, “Soot temperature measurements and implications for time-resolved laser-induced incandescence (TIRE-LII)”. Combustion and Flame, Vol. 120, pp. 439-512.
Turns, S.R., 1996, “An introduction to Combustion”, Ed. McGraw-Hill, New York, USA.
Vander Wal, R.L., Jensen, K.A. and Choi, M.Y., 1997, “Simultaneous laser-induced emission of soot and polycyclic aromatic hydrocarbons within a gas-jet diffusion flame”, Combustion and Flame, Vol. 109, pp. 399-413.
Yoshida, H., Koda, M., Ooishi, Y., Kobayashi, K.P. and Saito, M., 2001, “Super-Mixing Combustion Enhanced by Resonace Between Micro-shear Layer and Acoustic Excitation”, International Journal of Heat and Fluid Flow, Vol. 22, pp. 372-379.
Zinn, B.T., 1986, “Pulsating Combustion”, In: Weinberg F.J., ed., Advanced Combustion Methods, Academic Press: London, pp. 113-181.