The role of the FEF
50%/0.5FVC ratio in the
diagnosis of obstructive lung diseases*
O papel da razão FEF50%/0,5CVF no diagnóstico dos distúrbios ventilatórios obstrutivos
Marcelo Tadday Rodrigues, Daniel Fiterman-Molinari, Sérgio Saldanha Menna Barreto, Jussara Fiterman
Abstract
Objective: To evaluate the contribution of a new coefficient, the FEF50%/0.5FVC ratio, obtained from the maximal
expiratory flow-volume curve, to the diagnosis of obstructive lung disease (OLD); to test this coefficient in differentiating among patients considered normal, those with OLD and those with restrictive lung disease (RLD); and to determine cut-off points for each functional diagnosis, as well as the probability for each diagnosis based on individual values. Methods: A prospective, cross-sectional study analyzing the pulmonary function of patients referred to the Porto Alegre Hospital de Clínicas, in Porto Alegre, Brazil, between January and December of 2003. We collected demographic and spirometric data. The patients were divided into three groups: normal; OLD; and RLD. We calculated the FEV1/FVC and FEF50%/0.5FVC ratios, and we compared the mean FEF50%/0.5FVC values among the groups. We used Pearson’s correlation test in order to compare FEF50%/0.5FVC with FEV1/FVC. The patients
were again divided into two groups: those with OLD and those without OLD. We calculated the likelihood ratio for different cut-off points. Results: The mean age of the patients was 55.8 ± 14.7 years. There were significant differences among the groups in terms of the mean FEF50%/0.5FVC (2.10 ± 0.82, 2.55 ± 1.47 and 0.56 ± 0.29,
respectively, for normal, RLD and OLD; p < 0.001). There was a positive correlation between FEF50%/0.5FVC and FEV1/FVC in the OLD group (r = 0.83). We found that an FEF50%/0.5FVC < 0.79 strongly suggests OLD, whereas an FEF50%/0.5FVC > 1.33 practically excludes this diagnosis. Conclusions: The FEF50%/0.5FVC ratio is a potentially
useful parameter in the differential diagnosis of OLD and correlates positively with the FEV1/FVC ratio. Keywords: Pulmonary disease, chronic obstructive; Spirometry; Respiratory function tests.
Resumo
Objetivo: Avaliar a contribuição de um novo coeficiente, a razão FEF50%/0,5CVF, medida através da curva
fluxo-volume máximo expiratório, no diagnóstico dos distúrbios ventilatórios obstrutivos (DVOs); testar esse coefi-ciente na diferenciação entre grupos de pacoefi-cientes normais, com DVO e com distúrbio ventilatório restritivo (DVR); e estabelecer pontos de corte para cada um dos diagnósticos funcionais e a probabilidade para cada diagnóstico a partir de valores individuais. Métodos: Estudo transversal, prospectivo, com a análise de testes de função pulmonar de 621 pacientes encaminhados ao Hospital de Clínicas de Porto Alegre entre janeiro a dezembro de 2003. Foram coletados dados demográficos e espirométricos. Os pacientes foram divididos conforme o diagnóstico funcional em três grupos: normal; DVO; e DVR. Foram calculadas as razões VEF1/CVF e FEF50%/0,5CVF, e as médias de FEF50%/0,5CVF foram comparadas entre os grupos. Para correlacionar FEF50%/0,5CVF com VEF1/CVF, utilizou-se a correlação de Pearson. Os pacientes foram, então, divididos em dois grupos: com e sem DVO. Foram calculadas as razões de verossimilhança para diferentes pontos de corte. Resultados: A média de idade dos pacientes foi de 55,8 ± 14,7 anos. Houve diferenças significativas nos valores médios de FEF50%/0,5CVF entre os grupos (2,10 ± 0,82, 2,55 ± 1,47 e 0,56 ± 0,29, respectivamente, para normal, DVR e DVO; p < 0,001). Houve uma correlação positiva do FEF50%/0,5CVF com VEF1/CVF no grupo DVO (r = 0,83). Valores de FEF50%/0,5CVF < 0,79 mostraram-se fortes indicadores de DVO e valores > 1,33 praticamente afastam esse diagnóstico. Conclusões: A razão FEF50%/0,5CVF é um parâmetro potencialmente útil para discriminar DVOs, correlacionando-se positivamente com o VEF1/CVF.
Descritores: Doença pulmonar obstrutiva crônica; Espirometria; Testes de função respiratória.
* Study carried out at the Pontifícia Universidade Católica do Rio Grande do Sul – PUCRS, Pontifical Catholic University of Rio Grande do Sul – São Lucas Hospital, Porto Alegre, Brazil.
Correspondence to: Jussara Fiterman. Avenida Ipiranga, 6690, Centro de Pesquisa Clínica, CEP 90610-000, Porto Alegre, RS, Brasil. Tel 55 51 3336-5043. E-mail: [email protected]
Financial support: None.
The objective of this study was to test the contribution of FEF50% at isovolume, by means of the FEF50%/0.5FVC ratio (FEF at 50% of FVC divided by 0.5 of FVC), to the diagnosis of obstructive lung disease and to determine the probability of diagnosis based on individual values.
Methods
This was a prospective, cross-sectional study analyzing the PFTs performed in the Pulmonary Physiology Clinic of the Pulmonology Department of the Hospital de Clínicas de Porto Alegre (HCPA, Porto Alegre Hospital de Clínicas), in Porto Alegre, Brazil, between January and December of 2003. All tests were performed as part of the routine medical treatment of patients who sought treatment at the facility or were referred to it by their physicians for any diag-nosis. The study was approved by the Research Ethics Committee of the HCPA.
Spirometry was performed using a Jaeger FlowScreen Pro spirometer (Erich Jaeger GmbH & CoKG, Würtzburg, Germany), which provides flow-volume curves, time-volume curves (initial VC; FVC; FEV1; FEV1/FVC; MEF at 50% of FVC [MEF50%]; MEF25%; mean MEF between 25-75% of expiratory volume; PEF; maximal inspiratory flow at 50% of FVC; and forced inspiratory volume in one second) and maximal voluntary ventilation, in accordance with the standards established by the Brazilian Thoracic Association (BTA) and the American Thoracic Society (ATS).(1,5) Plethysmography was performed using a Jaeger MasterScreen Body plethysmograph (Erich Jaeger GmbH & CoKG). All of the components of the plethysmograph are based on a powerful computerized system with a large storage capacity. All of the equipment conforms to the standards established by the European Respiratory Society and the ATS.(6)
The tests were performed by technicians certified by the BTA, in accordance with the BTA Pulmonary Function Test Guidelines.(1) The curves were analyzed and reviewed by at least two pulmonologists. The curves considered technically inappropriate, in accordance with the BTA Pulmonary Function Test Guidelines,(1) were reobtained or excluded from the analysis.
Demographic data were collected, as were data regarding indications for PFTs. The following parameters were analyzed: FVC; FEV1;
Introduction
Pulmonary function tests (PFTs) can be used in various clinical scenarios, including the description of lung diseases, assessment of severity, diagnosis, determination of prog-nosis, treatment planning, observation of the clinical evolution over time and observation of treatment-related changes. The data obtained via spirometry can be used in order to detect abnormalities in individuals without known lung disease, in preoperative tests, in health examina-tions and in clinical screening.(1)
The interpretation of PFTs takes into account the reason why these tests were requested. When performed in patients with known disease, PFTs should be able to respond to the specific ques-tions raised by the requesting party.(2)
In most cases, simple spirometry provides sufficient information for the diagnosis of lung diseases. However, differentiating these diseases based solely on conventional spirometry might not be possible in some cases, and complemen-tary resources, which are not always available, might be necessary.
The representation of a maximal expiratory flow-volume curve—recorded during a forced expiratory maneuver—focuses on the greatest mechanical marker of the obstructive process, which is the reduction in instantaneous maximal expiratory flow (MEF), that is, at various lung volume levels. The reduction in expiratory flow can then be visualized in more detail in a flow-volume graph than in a flow-volume-time graph, which is expressed by the integration of flows. Therefore, the flow-volume curve expresses the instantaneous maximal flows obtained during FVC, and the interpretation of its segments can contribute to the diagnosis of lung diseases. Recent studies, the results of which are still controversial, have sought to demonstrate the importance of simple tests such as FEV1/FEV6 in the evaluation of lung diseases. One group of authors(3) showed that the FEV
Pulmonary Function Test Guidelines.(1) Of those, we excluded 88 PFTs of patients who had mixed obstructive and restrictive lung disease. The remaining 621 PFTs were used for the analysis. The mean age of the patients was 55.8 ± 14.7 years, and 330 (53.1%) were male. The clinical indications for performing PFTs were as follows: COPD (in 32.2%); asthma (in 12.9%); interstitial disease (in 14.9%); investigation of dyspnea (in 4.7%); and other (in 35.6%).
In the study sample, 313 patients (50.4%) had OLD, 59 (9.5%) had RLD and 249 (40.1%) were considered normal. Regarding age, there was a statistically significant difference among the three groups (p < 0.001). In comparing the groups with each other, we found a difference between the OLD and RLD groups (p = 0.007) and between the OLD and normal groups (p < 0.001). However, no difference was found between the RLD and normal groups. Regarding FEV1, there was a statistically significant difference among the groups (p < 0.001). A significant difference was found between the OLD and normal groups VC; RV; TLC; FEF50%; FEF75%; and DLCO. In
addi-tion, the following ratios, as calculated based on the parameters measured, were analyzed: FEV1/FVC and FEV1/VC. The values obtained were compared with the predicted values for the population studied, as proposed in the reference table devised by Crapo et al.,(7) with predicted lower and upper limit values, and were expressed as absolute values and as percentages of the predicted values.
The data obtained and the ratios calculated were tabulated, after which the patients were divided into three groups based on the func-tional diagnosis: obstructive lung disease (OLD); restrictive lung disease (RLD); and normal. The patients classified as having OLD were those who had an FEV1 below the predicted lower limit and an FEV1/FVC lower than 0.7. The patients diagnosed with RLD were those whose TLC was below the predicted lower limit. Individuals for whom all of the parameters were within the predicted limits were classified as normal.
The coefficient was calculated using the equation FEF50%/0.5FVC, which was applied to each test for each of the groups. The means of the groups were then compared in order to identify differences and cut-off values for the diagnosis and differentiation of lung diseases based on this coefficient.
Statistical analysis
One-way ANOVA was used in order to analyze the differences among the groups, followed by Tukey’s honestly significant difference post-hoc test.
In order to calculate the likelihood ratio, the RLD and normal groups were combined into a single group, and the analysis came to involve the comparison between patients with OLD (OLD group) and those without OLD (no-OLD group). The Student’s t-test for independent samples was used in order to analyze the differences between the groups. The level of significance was set at
α = 0.05. Pearson’s correlation test was used in order to determine the correlation between the FEV1/FVC and FEF50%/0.5FVC ratios.
Results
We included 709 consecutive PFTs of patients 18 years of age or older whose curves met the acceptance criteria established in the BTA
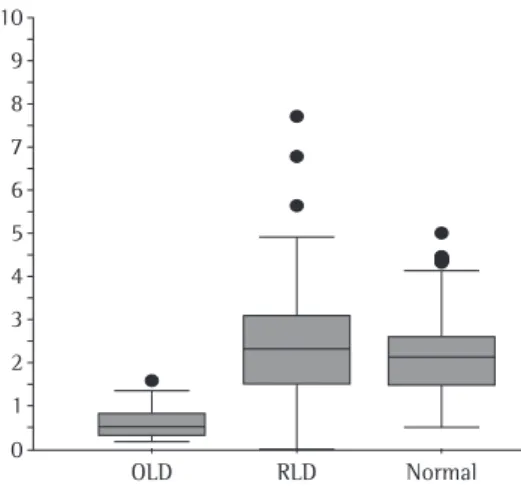
Table 1 - FEF50%/0.5FVC ratio in patients with obstructive lung disease, in those with restrictive lung disease and in those considered normal.
Group Mean ± SD Median Minimum Maximum OLD 0.56 ± 0.29 0.49 0.14 2.48 RLD 2.55 ± 1.47 2.32 0.26 7.69 Normal 2.10 ± 0.80 2.11 0.51 4.98 OLD: obstructive lung disease; and RLD: restrictive lung disease.
10
9
8
7
6
5
4
3
2
1
0
OLD RLD Normal
Discussion
The FEF50%/0.5FVC ratio is a valid param-eter for use in the differential diagnosis of lung diseases, especially those that are obstructive, as a marker of airflow. In our study, the values of this parameter were different in the distinct groups, being accurate to differentiate among patients with OLD, those with RLD and those considered normal.
The flow-volume curve represents a dynamic process, and the analysis of its different segments can be an important, advanced diagnostic tool, with new correlations being frequently reported.(8,9)
Airflow limitation occurs in varying degrees, and, therefore, its sensitivity and specificity can vary depending on the target population. Since spirometry, in any of its forms, is a performance test, if a large number of patients who are older, sick or more debilitated are tested, its specificity will be lower (more false-positive results); simi-larly, its sensitivity will be lower in a population with mild airflow limitation than in a population with severe airflow limitation.(10)
The clinical usefulness of a diagnostic test is mainly determined by the accuracy with which it identifies the target disease.(9) In the present study, the measure of accuracy of the test was the LR.
Our results indicate that an FEF50%/0.5FVC value below 0.79 is a good indication of airflow limitation and that a value above 1.33 virtually excludes that possibility.
We used a sample consisting of patients who were submitted to PFTs in the Pulmonary Physiology Unit of the Pulmonology Department of the HCPA. Those patients underwent PFTs for different reasons, which makes the sample representative of the total number of patients who are referred for such tests.
(p < 0.001) and between the RLD and normal groups (p < 0.001). However, no significant difference was found between the OLD and RLD groups.
Regarding FEF50%, we found a statistically significant difference among the three groups (p < 0.001). When the groups were compared with each other, these differences remained, in all possible combinations (p < 0.001).
The analysis of the FEF50%/0.5FVC ratio is presented in Table 1 and in Figure 1. There was a statistically significant difference among the three groups (p < 0.001). When the groups were compared with each other, statistically significant differences were found in all possible combinations (p < 0.001).
When comparing the OLD and no-OLD groups, we found that the difference in the FEF50%/0.5FVC ratio was statistically significant (p < 0.001). This result is presented in Table 2.
The different cut-off points for each quin-tile of the FEF50%/0.5FVC ratio, as well as their frequencies and likelihood ratios (LRs), are presented in Table 3. The cut-off points were determined so that the ratios were equidistant from the null value (LR = 1).
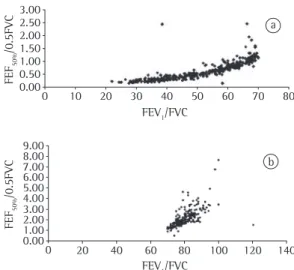
The correlation between FEV1/FVC and FEF50%/0.5FVC was positive for the OLD group (r = 0.83) and the no-OLD group (r = 0.64). These correlations are presented in Figures 2a and 2b, respectively.
Table 2 - FEF50%/0.5FVC ratio in patients with obstructive lung disease and in those without obstructive lung disease.
Group FEF50%/0.5FVC Obstructive lung disease 0.56 ± 0.29* No obstructive lung disease 2.19 ± 0.99* *p < 0.001.
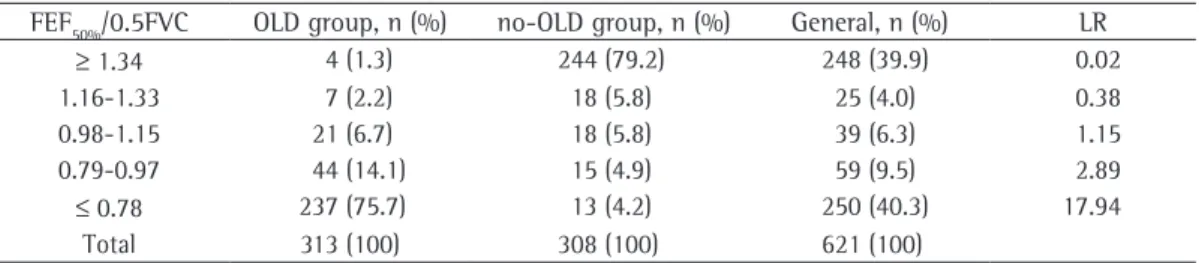
Table 3 - Likelihood ratios and cut-off points for patients with and without obstructive lung disease. FEF50%/0.5FVC OLD group, n (%) no-OLD group, n (%) General, n (%) LR
≥ 1.34 4 (1.3) 244 (79.2) 248 (39.9) 0.02
1.16-1.33 7 (2.2) 18 (5.8) 25 (4.0) 0.38
0.98-1.15 21 (6.7) 18 (5.8) 39 (6.3) 1.15
0.79-0.97 44 (14.1) 15 (4.9) 59 (9.5) 2.89
≤ 0.78 237 (75.7) 13 (4.2) 250 (40.3) 17.94
Total 313 (100) 308 (100) 621 (100)
reproducible portion that is effort-independent at lung volumes below 70% of FVC(12) stimulates the search for an indicator that can facilitate the differential diagnosis of lung diseases. Midflows are employed for that purpose, in an attempt to eliminate confounding factors related to the effort-independent portion of the flow-volume curve and the terminal portion of the flow, which depends on lung elastic recoil.
Since small airway obstruction is an early change in many obstructive diseases,(13) it is desirable that parameters that reflect distal flows be found. In this context, FEF25-75% and FEF50% seem to reflect flow at low lung volumes more accurately.(13)
The use of midflows or terminal flows in the diagnosis of lung diseases faces the problem of the wide range of reference values.(13)
In a study investigating whether FEF50% and FEF25-75% correlated or whether the difference between them reflected the degree of airflow obstruction,(14) it was concluded that the two indices, despite not being identical, are highly correlated and that the ratio between them is reasonably constant. Therefore, the practice of describing the two indices in spirometry is unnecessary. In addition, those authors recom-mended that FEF50% be given preference.
Midflow adjusted for volume, FEF50%/0.5VC, could be used in order to facilitate the defi-nition of the functional diagnosis. However, the use of flows adjusted for FVC, in order to reduce variability and facilitate the interpreta-tion in restrictive diseases, has met with variable success.(14) The division of FEF
50% by half of the VC implies adjustment for true volume, that is, maximal flow adjusted for volume at which it is being obtained: FEF50%/0.5FVC. Although it is unexpected, perhaps because it was not prac-ticed by Knudson et al.,(15) who adjusted maximal flows for total FVC, we considered the concep-tual relevance, this being the original compo-nent of the approach of this study.
One group of authors(16) highlighted the value of the shape of the flow-volume curve by dividing mean flows by the change in volume. These relationships consist of assessments of the flow-volume curve that are not only quali-tative but also quantiquali-tative. The FEV1/FVC ratio is obtained from volume-time spirometry rather than from the flow-volume curve, which The most common clinical diagnosis was
obstructive disease, especially COPD and asthma. The higher incidence of a clinical diag-nosis of COPD in the sample explains the fact that the patients in the RLD and normal groups were younger than were those in the OLD group (p = 0.007 and p < 0.001, respectively).
In order to discriminate the patients with OLD, the cases were stratified into two groups: OLD and no-OLD. We observed that the FEF50%/0.5 ratio was able to differentiate the patients with OLD from the other patients.
In 1957, one group of authors(11) developed the concept that if flow-pressure graphs were viewed in terms of flow and volume during a FVC maneuver, more information would be available without the need to measure conductive pressure. Those authors also made important observa-tions regarding how the relaobserva-tionships among pressure, flow and volume behave, as follows: (a) except at high lung volumes, relatively little effort (and, consequently, low pressure) was necessary to achieve instantaneous MEF during an FVC maneuver; and (b) instantaneous MEF is effort-dependent near TLC, whereas it is essen-tially effort-independent throughout most of the VC. Forced expiratory tests should also be evaluated in this way, the initial portion being less reproducible.
The understanding that the maximal expiratory flow-volume curve has a relatively
3.00 2.50 2.00 1.50 1.00 0.50 0.00
0 10 20 30 40 50 60 70 80
FEF
50%
/0.5FVC
FEF
50%
/0.5FVC
FEV1/FVC
9.00 8.00 7.00 6.00 5.00 4.00 3.00 2.00 1.00 0.00
0 20 40 60 80 100 120 140
FEV1/FVC
3. Lundgren FL, Cabral MM, Clímaco DC, de Macedo LG, Coelho Mde A, Dias AL. Determination of the efficacy of FEV6 as a surrogate for FVC in the diagnostic screening for chronic obstructive pulmonary disease through the comparison of FEV1/FVC and FEV1/FEV6 ratios. J Bras Pneumol. 2007;33(2):148-51.
4. Soares AL, Rodrigues SC, Pereira CA. Airflow limitation in Brazilian Caucasians: FEV1/FEV6 vs. FEV1/FVC. J Bras Pneumol. 2008;34(7):468-72.
5. Standardization of Spirometry, 1994 Update. American Thoracic Society. Am J Respir Crit Care Med. 1995;152(3):1107-36.
6. Clausen JL, Coates AL, Quanjer PH. Measurement of lung volumes in humans: review and recommendations from an ATS/ERS workshop. Eur Respir J. 1997:10(6):1205-6. 7. Crapo RO, Morris AH, Gardner RM. Reference spirometric
values using techniques and equipment that meet ATS recommendations. Am Rev Respir Dis. 1981;123(6):659-64.
8. Jaeschke R, Guyatt GH, Sackett DL. Users’ guides to the medical literature. III. How to use an article about a diagnostic test. B. What are the results and will they help me in caring for my patients? The Evidence-Based Medicine Working Group. JAMA. 1994;271(9):703-7. 9. Gilbert R, Auchincloss JH Jr. The interpretation of the
spirogram. How accurate is it for ‘obstruction’? Arch Intern Med. 1985;145(9):1635-9.
10. Hyatt RE, Schilder DP, Fry DL. Relationship between maximum expiratory flow and degree of lung inflation. J Appl Physiol. 1958;13(3):331-6.
11. Mead J, Turner JM, Macklem PT, Little JB. Significance of the relationship between lung recoil and maximum expiratory flow. J Appl Physiol. 1967;22(1):95-108. 12. Ren CL. What is the best way to measure lung function?
Chest. 2003;123(3):667-8.
13. Pereira CA, Barreto SP, Simões JG, Pereira FW, Gerstler JG, Nakatani J. Valores de referência para espirometria em uma amostra da população brasileira adulta. J Pneumol. 1992;18(1):10-22.
14. Bar-Yishay E, Amirav I, Goldberg S. Comparison of maximal midexpiratory flow rate and forced expiratory flow at 50% of vital capacity in children. Chest. 2003;123(3):731-5.
15. Knudson RJ, Slatin RC, Lebowitz MD, Burrows B. The maximal expiratory flow-volume curve. Normal standards, variability, and effects of age. Am Rev Respir Dis. 1976;113(5):587-600.
16. Hyatt RE, Scalon PD, Nakamura M, editors. Interpretation of pulmonary function tests: a practical guide. Philadelphia: Lippincott Williams & Wilkins; 1997. 17. Meyer FJ, Ewert R, Hoeper MM, Olschewski H, Behr J,
Winkler J, et al. Peripheral airway obstruction in primary pulmonary hypertension. Thorax. 2002;57(6):473-6. 18. Green M, Mead J, Turner JM. Variability of maximum
expiratory flow-volume curves. J Appl Physiol. 1974;37(1):67-74.
currently seems to be included in spirometry only as an ornament.
Another group of authors(9) found that the FEF50%/FVC% (70%) or FEV1/FVC% (70%) ratio has a sensitivity of 0.92 and a specificity of 0.91 for obstruction and that the FEV1/FVC% (70%) or FEF50%/FVC% (60%) ratio has a sensitivity of 0.89 and a specificity of 0.97 for obstruction. More recently, peripheral airways were evaluated in patients with pulmonary arterial hyperten-sion, the FEF75% terminal flows being adjusted for their true volume (0.25FVC), with consistent results.(17) Therefore, the instantaneous flows obtained from the flow-volume curve can be more logically adjusted for their true instanta-neous volumes as a functional diagnostic tool.
In order to determine the diagnostic power of the FEF50%/0.5FVC ratio in the differential diagnosis of lung diseases, specifically in differ-entiating patients with obstructive disease from those with nonobstructive disease, it would be necessary to compare this ratio with that consid-ered the gold standard, the FEV1/FVC ratio.
In summary, considering that the correla-tion between the FEV1/FVC and FEF50%/0.5FVC ratios was shown to be high and that the former has been well-established as a marker of airflow,(18) it would also be prudent to state that FEF50%/0.5FVC has its applicability, contrib-uting to the early diagnosis of lung diseases. Early expression can be used since instanta-neous flows, assessed using the flow-volume curve, occur before the integration of flows that make it possible to determine FEV1, which, when altered, is no longer a pathophysiological marker of early obstruction.
References
1. Sociedade Brasileira de Pneumologia e Tisiologia. Diretrizes para Testes de Função Pulmonar. J Pneumol. 2002;28(Suppl 3):S1-S238.
About the authors
Marcelo Tadday Rodrigues
Pulmonologist. Pontifícia Universidade Católica do Rio Grande do Sul – PUCRS, Pontifical Catholic University of Rio Grande do Sul – São Lucas Hospital, Porto Alegre, Brazil.
Daniel Fiterman-Molinari
Medical Student. Universidade Federal do Rio Grande do Sul – UFRGS, Federal University of Rio Grande do Sul – School of Medicine, Porto Alegre, Brazil.
Sérgio Saldanha Menna Barreto
Professor. Universidade Federal do Rio Grande do Sul – UFRGS, Federal University of Rio Grande do Sul – School of Medicine, Porto Alegre, Brazil.
Jussara Fiterman