i
TATIANA FICHE SALLES TEIXEIRA
INTER-RELATION OF FECAL MICROBIOTA, INTESTINAL
PERMEABILITY, ENDOTOXEMIA AND INTESTINAL INFLAMMATION MARKERS ON OBESITY AND THE DEGREE OF INSULIN RESISTANCE
VIÇOSA
MINAS GERAIS - BRASIL 2013
ii
iii AGRADECIMENTOS
À Deus por tudo e aos meus pais pelo apoio incondicional. Posso ir para a direita ou esquerda, que Eles estão comigo. Aos meus irmãos e familiares pela torcida. Ao meu amado, por estar ao meu lado trazendo amor, alegria, carinho e tranquilidade.
À minha materna orientadora Profa. Maria do Carmo Gouveia Peluzio pela oportunidade, ensinamentos, incentivo, torcida, carinho e confiança. Obrigada pelos quase 10 anos de convivência.
Aos Professores Leandro Licursi de Oliveira e Ângela Aparecida Barra pela coorientação. Ao Prof. Leandro por aguentar tantas perguntas e ajudar a encontrar o caminho certo das análises.
Ao Prof. Seppo Salminen por me receber na Finlândia e ceder todos os recursos e protocolos para as análises da microbiota. À Profa. Célia Lúcia Luces F Ferreira por intermediar a minha ida para a Finlândia.
À Profa. Rita de Cássia Gonçalves Alfenas pelas contribuições e por aceitar participar da minha qualificação e desta banca.
Às Professoras Rita de Cássia Gonçalves Alfenas, Neuza Maria Brunoro Costa e Josefina Bressan pela dedicação e sugestões oportunas ao Projeto Amendoim, cujos voluntários também fizeram parte do meu trabalho.
À Profa. Jacqueline Isaura Alvarez Leite e à Manoela Maciel por aceitarem participar desta banca.
À Profa. Giana Zarbato Longo por me ensinar a trabalhar no software STATA e por carinhosamente sempre me atender para sanar dúvidas.
Ao Eduardo Pereira, pelo auxílio nas análises de permeabilidade intestinal.
Às minhas queridas colegas de trabalho Ana Paula Boroni Moreira, Raquel Duarte Moreira Alves e Viviane Silva Macedo. Vocês tornaram tudo mais leve, alegre, e organizado. Obrigada pela amizade. Aprendi muito com vocês.
iv
À técnica de enfermagem Maria Aparecida Viana Silva, e às estagiárias Fernanda Fonseca Rocha e Laís Emília da Silva por carinhosamente nos auxiliar.
A todos os voluntários que participaram e fizeram este trabalho possível.
Aos meus colegas de LABIN e LAMECC, ao Toninho pela companhia diária, dando apoio, compartilhando momentos de descontração e risadas no cafezim. Em especial ao Luis Fernando Moraes pelas ajudas, e claro pelo cafezim.
À Rita Stampini por estar sempre pronta a ajudar com as burocracias institucionais, e com muita simpatia.
À Profa. Maria do Carmo Gouveia Peluzio, Ana Paula Boroni Moreira, Damiana Diniz Rosa e Alessandra Barbosa Ferreira Machado, pela dedicação ao livro Microbiota Gastrointestinal – evidências de sua influência na saúde e doença, e a todos os colaboradores dos capítulos. Aguardo ansiosamente pelo lançamento do mesmo.
Aos meus amigos de perto e lá de longe, que compartilham as alegrias e angústias, e que colorem a minha vida. Não preciso citar nomes. Em especial à Elis que carinhosamente me acolheu em sua casa por várias vezes.
À equipe do Laboratório de Análises Clínicas, em especial ao Alexandre Azevedo Novello, e aos técnicos do setor de diagnóstico por imagem, Wanderson Luís Batista, Divino Paulo de Carvalho e Daniela Almeida Duarte, pelos serviços prestados.
À Coordenação de Aperfeiçoamento de Pessoal de Nível Superior (CAPES), pela concessão da bolsa de doutorado, à Fundação de Amparo à Pesquisa do Estado de Minas Gerais (FAPEMIG) pelo financiamento de parte do projeto de pesquisa.
Finalmente e principalmente, à Universidade Federal de Viçosa, ao Departamento de Nutrição e Saúde e a todos os professores que fizeram parte da minha formação, da graduação ao doutorado.
v SUMÁRIO
LISTA DE ABREVIATURAS ... vii
RESUMO ... ix
ABSTRACT ... xi
1. GENERAL INTRODUCTION ... 1
References ... 3
2. AIMS OF THE STUDY ... 5
2.1. General aim ... 5
2.2. Specific aims ... 5
3. ARTICLES ... 6
3.1 . Article 1 (review): Metabolically obese normal weight and metabolically healthy obese: what are the main characteristics of these phenotypes? ... 6
Abstract ... 6
2. Fat depots and metabolic disorders ... 8
3.Clinical and anthropometric characteristics of different metabolic phenotypes ... 14
4. Benefits of weight loss ... 17
5.Controversies ... 18
6. Conclusion ... 22
7. References ... 33
3.2. Article 2 (review): Network between endotoxins, high fat diet, microbiota and bile acids on obesity ... 43
Abstract ... 43
1. Introduction ... 44
2. Endotoxins: terminology and general aspects ... 45
3. Insulin signaling and resistance to its action ... 47
4. Lipopolysaccharides signaling pathways and insulin sensitivity ... 49
5. Effects of LPS on adipose tissue and intestines ... 50
6. Endotoxins and fatty acids signaling pathways ... 56
7. Diet composition and the influence on endotoxins absorption ... 59
8. Microbiota, intestinal permeability, endotoxins and high fat diet inter-relationship ... 61
9. Bile acids: the missing point ... 66
vi
11. References ... 77
3.3. Article 3 (review in Press) Intestinal permeability measurements: general aspects and possible pitfalls ... 94
Abstract ... 94
1. Introduction ... 95
2. Methods... 96
3. Factors underlying increased intestinal permeability ... 96
4. General aspects of intestinal permeability tests ... 97
5. Possible pitfalls in intestinal permeability tests ... 99
6. Additional markers to indicate alteration in barrier function ... 102
7. Conclusion ... 104
8. References ... 115
3.4. Article 4 (Original): Intestinal permeability, lipopolysaccharides and degree of insulin resistance in men: are they correlated? ... 130
Abstract ... 130
1. Introduction ... 131
2. Methods... 131
3. Results ... 135
4. Discussion ... 136
5. References ... 142
3.5. Article 5 (original): Body mass index is better than plasma lipopolysaccharides in clustering subjects with higher degree of insulin resistance ... 147
Abstract ... 147
1.0. Introduction ... 148
2.0. Methods ... 149
3.0. Results ... 151
4.0. Discussion ... 152
5. References ... 159
3.6. Article 6 (original published) Faecal levels of Bifidobacterium and Clostridium coccoides but not plasma lipopolysaccharide are inversely related to insulin and HOMA index in women ... 163
4. FINAL CONSIDERATIONS ... 169
ANNEX 1 – Ethical Committee Approval ... 171
vii LISTA DE ABREVIATURAS
ALT: alanine aminotransferase ANOVA: analysis of variance AOAH: acyloxyacyl hydrolase AP: alkaline phosphatase AST: aspartate aminotransferase AT: adipose tissue
BA: bile acids
BMI: body mass index CRP: C-reactive protein
DXA: dual-energy X-ray absorptiometry eCB: endocannabinoid system
EU/ml: endotoxin units per milliliter FIAF: fasting-induced adipose factor
FXR: farnesoid X receptor HDL: high-density-lipoprotein HF: high fat
HOMA: homeostasis assessment model IEC: intestinal epithelial cells
IGT: impaired glucose tolerance IP: intestinal permeability
IR: insulin resistance IRO: insulin-resistant obese IRS: insulin receptor substrate ISO: insulin-sensitive obese L/M: lactulose/mannitol ratio LBP: LPS binding protein LDL: low density lipoprotein LPS: lipopolysaccharides LTA: lipoteichoic acids
MCP-1: Monocyte chemotatic protein-1 MetS: metabolic syndrome
viii MONW: metabolically obese normal weight
MyD88: myeloid differentiation factor-88 NEFA: non-esterified fatty acids
NFkB: nuclear factor kappa beta
OHR: overweight or obese at higher risk SAT: subcutaneous adipose tissue SHP: small heterodimer partner
T2DM: type 2 diabetes mellitus TG: triglycerides
TJ: tight junctions TLR: toll-like receptors
TNF: tumor necrosis factor alpha VAI: visceral adiposity index VAT: visceral adipose tissue
ix RESUMO
TEIXEIRA, Tatiana Fiche Salles, D.Sc., Universidade Federal de Viçosa, dezembro de 2013. Inter-relation of fecal microbiota, intestinal permeability, endotoxemia and intestinal inflammation markers on obesity and the degree of insulin resistance.
Orientadora: Maria do Carmo Gouveia Peluzio. Coorientadores: Leandro Licursi de Oliveira e Ângela Aparecida Barra.
x
xi ABSTRACT
TEIXEIRA, Tatiana Fiche Salles, D.Sc., Universidade Federal de Viçosa, December, 2013. Inter-relation of fecal microbiota, intestinal permeability, endotoxemia and
intestinal inflammation markers on obesity and the degree of insulin resistance.
Adviser: Maria do Carmo Gouveia Peluzio. Co-advisers: Leandro Licursi de Oliveira and Ângela Aparecida Barra.
xii
1 1. GENERAL INTRODUCTION
The interaction between biological, social and psychological factors contributes to the establishment and maintainance of obesity, which becomes a chronic and progressive condition associated with health complications. However, the expansion of adipose tissue does not necessarily leads to diseases in humans. The tolerable threshold level of adiposity differs between subjects and is possibly influenced by environmental and genetic factors.1 Therefore, there is a current trend to use terms such as benign/ metabolically healthy or malign/unhealthy obese condition in accordance with the absence or presence of metabolic alterations, respectively.2-3
The main metabolic alteration associated with the malign/unhealthy condition of obesity is insulin resistance (IR),3 which in turn associates with other dysfunctions such as glucose intolerance, dyslipidemia and endothelial dysfunction. Hence, the risks for the development of cardiovascular diseases, diabetes and hepatic steatosis are higher in the presence of both obesity and IR.4
The development of insulin resistance has been classically attributed to the production and secretion of inflammatory mediators, due to adipose tissue hypertrophy (induced by excessive caloric intake), associated with infiltration of specialized immune cells (such as macrophages) in this tissue. The progression of this condition increases the activation of inflammatory pathways and secretion of cytokines, such as TNF, that reduces the hability to store triglycerides (from diet or endogenous origin) into adipose tissue and stimulates lipolysis. In consequence, there is an increased delivery of free fatty acids and triglycerides into the circulation, which can be deposited in other organs such as the liver, skeletal muscle and heart. The ectopic deposition of fat impairs cellular processes such as oxidative mitochondrial phosphorylation and glucose transport induced by insulin, triggering IR.5 Therefore, the restoration of metabolic functions seems to depend on the resolution of the chronic inflammatory state, which is suggested as a central biological aspect of the morbidities associated with obesity.
2
action of insulin.7 Additionaly, these receptors are specialized in the recognition of pathogen-associated molecular patterns.1 The endotoxins, among which lipopolysaccharides (LPS) derived from microorganisms stands out, are true ligands to TLRs able to induce inflammatory responses. Higher concentration of plasma endotoxins seems to increase the risk of chronic diseases related to subclinical inflammatory state.8-9
In fact, the subcutaneous infusion of LPS causes similar consequences to the high fat intake by animals: deregulation of inflammatory tonus, increased fasting glucose and insulin, increased body weight, liver and adipose tissue.10 The definition of how the concentration of LPS increase in the circulation is as complex as the molecular mechanisms activated by LPS signaling. Two main mechanisms have been suggested: incorporation of LPS into chylomicrons11 and passage through the paracellular space due to the increase in intestinal permeability.12-13 Changes in the composition of gastrointestinal microbiota have been evidenced in obesity and associated to the increase of LPS absorption and intestinal permeability in animals.13-14
Evidences that demonstrate that obese subjects show increased intestinal permeability and that this favors the occurrence of endotoxemia are still scarce. The studies that detect higher level of circulating LPS in subjects with diabetes, obesity and/or cardiovascular diseases did not assess intestinal permeability.9,15-18 It has been demonstrated in humans, animals and cell culture that exposure to higher fat content increases the concentration of LPS in the circulation.11,18,19,20
3
aspects in the same group of obese subjects. Therefore, more studies in this area are still needed.
References
1. Gregor MF, Hotamisligil GS. Inflammatory mechanisms in obesity. Ann Rev Immunol 2011; 29:415-45.
2. Magkos F, Fabbrini E, Mohammed BS, Patterson BW, Klein S. Increased whole-body adiposity without a concomitant increase in liver fat is not associated with augmented metabolic dysfunction. Obesity 2010;18:1510-15. 3. Kantartzis K, Machann J, Schick F, Rittig K, Machicao F, Fritsche A, Häring
HU, Stefan N. Effects of a lifestyle intervention in metabolically benign and malign obesity. Diabetologia 2011;54:864-68.
4. Reaven GM. The insulin resistance syndrome: definition and dietary approaches to treatment. Annu Rev Nutr 2005;25:391-406.
5. Guilherme A, Virbasius JV, Puri V, Czech MP. Adipocyte dysnfunctions linking obesity to insulin resistance and type 2 diabetes. Nat Rev Mol Cell Biol 2008;9:367-77.
6. Könner AC, Brüning JC. Toll-like receptors: linking inflammation to metabolism. Trends Endocrinol Metabol 2011;22:16-23.
7. Shi M, Kokoeva MV, Inouye K, Tzameli I, Yin H, Flier JS. TLR4 links innate immunity and fatty acid-induced insulin resistance. J Clin Invest 2006;116:3015-25.
8. Erridge C. Endogenous ligands of TLR2 and TLR4: agonists or assistants? J Leukoc Biol 2010;87:989-99.
9. Pussinen PJ, Havulinna AS, Lehto M, Sundvall J, Salomaa V. Endotoxemia is associated with an increased risk of incident diabetes. Diabetes Care 2011;34:392-97.
10. Cani PD, Amar J, Iglesias MA, Poggi M, Knauf C, Bastelica D, et al. Metabolic endotoxemia initiates obesity and insulin resistance. Diabetes 2007;56(7):1761-1772.
11. Ghoshal S, Witta J, Zhong J, de Villiers W, Eckhardt E. Chylomicrons promote intestinal absorption of lipopolysaccharides. J Lipid Res 2009;50:90-7.
4
Increased intestinal permeability in obese mice: new evidence in the pathogenesis of nonalcoholic steatohepatitis. Am J Physiol 2007;292:G518-25. 13. Cani PD, Possemiers S, Van de Wiele T, Guiot Y, Everard A, Rottier O, et al.
Changes in gut microbiota control inflammation in obese mice through a mechanism involving GLP-2-driven improvement of gut permeability. Gut 2009;58:1091-103.
14. Cani PD, Bibiloni R, Knauf C, Waget A, Neyrinck AM, Delzenne NM, Burcelin R. Changes in gut microbiota control metabolic endotoxemia-induced inflammation in high-fat diet–induced obesity and diabetes in mice. Diabetes 2008;57:1470-81.
15. Wiedermann CJ, Kiechl S, Dunzendorfer S, Schratzberger P, Egger G, Oberhollenzer F, et al. Association of endotoxemia with carotid atherosclerosis and cardiovascular disease : Prospective results from the bruneck study. Journal of the American College of Cardiology 1999;34(7):1975-81.
16. Lepper PM, Schumann C, Triantafilou K, Rasche FM, Schuster T, Frank H, et al. Association of Lipopolysaccharide-Binding Protein and Coronary Artery Disease in Men. Journal of the American College of Cardiology 2007;50:25-31. 17. Lassenius MI, Pietiläinen KH, Kaartinen K, Pussinen PJ, Syrjänen J, Forsblom
C et al. Bacterial endotoxin activity in human serum is associated with dyslipidemia, insulin resistance, obesity and chronic inflammation. Diabetes Care 2011; 34:1809-1815.
18. Pendyala S, Walker JM, Holt PR. A high-fat diet is associated with endotoxemia that originates from the gut. Gastroenterology 2012; 142:1100-1101.
19. Erridge C, Attina T, Spickett CM, Webb DJ. A high fat diet meal induces low-grade endotoxemia: evidence of a novel mechanism of postprandial inflammation. Am J Clin Nutr 2007; 1286-92.
5 2. AIMS OF THE STUDY
2.1. General aim
Investigate the association between intestinal permeability, intestinal inflammation markers, endotoxemia and fecal microbiota with obesity and the degree of insulin resistance.
2.2. Specific aims
Correlate intestinal permeability and the concentration of plasma LPS, as well as their association with the degree of insulin resistance;
Correlate the concentration of fecal markers of intestinal inflammation with intestinal permeability and endotoxins;
Investigate the inter-relation between body adiposity, plasma LPS and the degree of insulin resistance;
Compare the abundance of specific bacteria from fecal microbiota between lean and obese subjects;
6 3. ARTICLES
3.1 . Article 1 (review): Metabolically obese normal weight and metabolically healthy obese: what are the main characteristics of these phenotypes?
Tatiana F S Teixeira, Raquel D M Alves, Ana Paula B Moreira, Maria do Carmo G Peluzio
Abstract
The aim of this review is to discuss the influence of fat depots on insulin resistance and the main characteristics of metabolically obese normal weight and metabolically healthy obese phenotypes. Medline/Pubmed and Science Direct were searched for papers related to the terms metabolically healthy obesity, metabolically obese normal weight, adipose tissue and insulin resistance. Normal weight and obesity might be heterogeneous in regard to its effects. Fat distribution and lower insulin sensitivity are the main factors defining phenotypes within the same body mass index. There are still some controversies to be solved regarding these terms. Future studies exploring these phenotypes will help to better understand the role of adiposity and/or insulin resistance in the development of metabolic alterations.
7 1. Introduction
The role of total adiposity in metabolic disorders is not precisely defined. Adiposity increases due to positive energy balance, sedentary lifestyle, genetic predisposition, psychosocial factors,1-3 and possibly the gut microbiota profile.4-5 A progressive increase in the prevalence and/or severity of morbidities and in the risk of mortality occurs as adiposity increases and obesity is established.2-3 Hyperglycemia, dyslipidaemia, and hypertension are often associated with abdominal obesity and insulin resistance (IR) and their concomitant occurrence identify subjects at great risk (i.e, metabolic syndrome, MetS) of developing chronic diseases.6-7
It has been more than 20 years since IR was suggested to be the central metabolic disability that in long-term entails type 2 diabetes mellitus (T2DM), hypertension, and cardiovascular diseases.7-9 IR occurs when higher insulin levels are necessary to maintain normal or only slightly impaired glycemia, while -cell dysfunction with decrease in insulin levels leads to severe glucose intolerance and T2DM.8-10 Although there is a strong association between obesity and IR, an obese subject can abstain from T2DM if a compensatory pancreatic -cell response is nearly perfect. On the other hand, even normal weight subjects may develop IR, T2DM, and other metabolic disorders.8
A link between generalized or central obesity and metabolic disorders such as IR is currently assumed.11-14 The degree of IR can rise with fat mass.11 However, as stated by Virtue and Vidal-Puig11 „at the individual level, the association between the degree of obesity and development of IR may not be so clear cut‟. Besides, the role of different fat depots on the development of metabolic complications is still open to controversy.15
Surprisingly, a body mass index (BMI) over 30 kg/m2 per se, does not necessarily lead to metabolic disorders.16 Indeed, some obese subjects, classified by means of their BMI, may have better metabolic profile than predicted.17 Obesity may represent an adaptation to re-establish a new homeostatic state under a high availability of food/calories18 in a way that expansion of adipose tissue might help to maintain a normal blood glucose and lipid profile.
8
the anthropometric, body composition, and biochemical characteristics of MONW and MHO subjects as well as the controversies regarding these terms.
2. Fat depots and metabolic disorders
Adipose tissue is a clustering of cells (adipocytes and stromal cells) specialized in fat storage and capable of secreting adipokines and impacting on whole metabolism and immune cells.2,15 Brown and white adipose tissues differ in their functionality: the first dissipate energy as heat (thermogenesis), while the latter is more associated with the endocrine and storage functions. The white adipose tissue can be found deeply and superficially beneath the skin (subcutaneous adipose tissue - SAT) and within the peritoneal cavity (visceral adipose tissue - VAT).11,19-22 Conversely, abdominal fat is not synonymous of VAT. Therefore, waist circumference is a measurement of abdominal fat but does not discriminate between VAT and SAT.21,23-25 Lam et al.22 emphasizes the importance of carefully interpreting studies that uses the collective term „visceral fat‟. Different anatomical localization within peritoneal cavity (e.g. perirenal, omental, mesenteric) may imply different impact on metabolism.22,25
The distribution of fat, particularly the VAT, may be influenced by aging, gender (usually in men is higher), menopause, smoking, sedentary lifestyle, and nutritional factors (high-energy and high-fat diet, fructose).13,21,25 The development of metabolic diseases may be a consequence of body weight and fat gain, but it is also related to fat depot location (visceral vs. subcutaneous, central vs. peripheral), hypertrophy or hyperplasia of adipocytes, liver fat and IR, as well as to the adipokines profile.2,3,15 Therefore, the use of body mass index by itself for obesity diagnostics could lead to misclassification of risk if the percentage and localization of body fat is not considered.
2.1. Fat depot location
VAT is often considered „hazardous‟13,21,23,26 even representing only 7-15% of total body fat.27 Liposuction of abdominal SAT did not significantly alter metabolic profile in the short-term28 or even after a long-term longitudinal assessment.29 The reduction of VAT might be more appropriate for metabolic improvement.
9
subjects release large amounts of NEFA and glycerol. The excess of substrates availability affects different sites. In the liver, these substrates are converted into triglycerides (lipogenesis) and glucose (gluconeogenesis). The increase in intramyocellular lipids in skeletal muscle cells impairs insulin sensitivity and decreases the glucose uptake and glucose partitioning to glycogen. There is also impairment of insulin secretion in pancreatic islets leading to glucose intolerance. In parallel, insulin sensitivity in adipocytes decreases increasing lipolysis and NEFA supply. This partially explains the complex relationship between obesity, NEFA, IR, and dyslipidemia.7,31,32
In fact, Nielsen et al.33 verified that obese had higher plasma NEFA than lean subjects and also a greater splanchnic NEFA uptake.33 As visceral fat increases, its lipolysis accounts for an increasing proportion of hepatic NEFA delivery. However, the relative contribution of visceral fat mass in NEFA pool varies among subjects differing in their body composition and fat distribution.33 The proportion of portal NEFA derived from VAT was greatly lower than the relative amount derived from lipolysis of SAT. Fatty acids released by SAT depots get into the venous circulation and reach splanchnic tissues by the arterial circulation. The excessive fatty acid released from VAT could be an important factor in developing hepatic IR, but it is unlikely to be the major factor in the pathogenesis of IR in skeletal muscle.34 Thus, both fat depots are important suppliers of NEFA to the liver and SAT may play a key role as an initiating factor in the process of fat overflow to other ectopic sites.
Higher level of the mRNA expression of pro-inflammatory genes such as chemotatic factors is a clear distinction between VAT and deep and superficial SAT.20 Tumor necrosis factor-α, macrophage inflammatory protein, and interleukin-8 were also highly expressed within VAT from T2DM subjects.35 Additionally, fasting glucose was positively correlated with mRNA expression of these molecules in VAT, while fasting insulin was positively associated with expression of serum amiloid-A and IL-1α.35The „bad‟ fame of VAT is also related to higher propensity to express inflammatory mediators related to the recruitment and activation of immune cells.
10
and/or cell size may alter the interpretation of expression of genes of interest still needs elucidation.20
In an epidemiological study, an increment in fat depots, including subcutaneous, increased the risk of calcification in vascular beds.14 The higher expression of nuclear factor kappa beta (NFkB) and leptin in SAT and the positive association between fasting insulin and the expression of a molecule regulating adipogenesis (cAMP response element-binding protein) in SAT indicates the possibility that this tissue contributes to the systemic inflammation and IR.35 The differences found in gene expression of different regions of SAT (upper abdomen, lower abdomen, flank, and hip) may have pathophysiological implications when adiposity increases. Genes involved in the complement and coagulation cascades, immune responses, insulin signaling, urea cycle, and amino acids metabolism were highly expressed in the lower abdomen compared to the flank or hip.36 It seems that both, VAT and SAT in the abdominal area are unfavorable to the metabolism. However, McLaughlin et al.27 observed that SAT might exert a protective role. Insulin sensitive subjects showed significantly larger SAT depots and regression analysis indicated that increased SAT was associated with a decrement in the risk of being insulin resistant.27
Impairment in -cell function might not be due to obesity per se. Elevated plasma NEFA concentration can be a metabolic derangement contributing to defects in compensatory -cell response, as proposed by the lipotoxicity hypothesis. However, it is also possible that increased NEFA is a consequence of the reduced anti-lipolytic effect of insulin in cases where impaired insulin secretion is observed.37 Lower VAT, lower fat intermediates in ectopic sites, greater capacity of organs such as muscle and liver for fat utilization rather than storage, and higher capacity for storing fat in SAT may help to preserve insulin sensitivity in some obese subjects.6,38,39
2.2. Hypertrophy and hyperplasia
The adipocyte size is an important histological characteristic to be considered in metabolic disabilities.30 Hypertrophied intra-abdominal adipocytes are characterized by a hyper-lipolytic state, which is resistant to the anti-hyper-lipolytic effect of insulin and provides large amounts of NEFA.31
11
positively with fasting glucose, insulin, homeostasis model assessment (HOMA), and the hepatic enzyme -glutamyl transferase.40 Of note, subcutaneous adipocytes were larger than visceral.40 However, adipocytes hypertrophy in omental depots can be more hazardous than in subcutaneous depots.30 In fact, higher omental-adipocyte diameter was found in obese women with IR,41,42 and it was correlated with the degree of IR and hepatic steatosis. Curiously, subcutaneous adipocytes size was also associated with the degree of liver fatness, but had no association with metabolic parameters.41 Therefore, VAT hypertrophy seems to be more linked to IR.
The hyperplasia of visceral adipocytes is possibly dependent on the overflow of chemical energy from the inefficient storage of fat by the subcutaneous depots. Probably, an enhanced adipogenic capacity of subcutaneous depots protects against metabolic syndrome since it may contribute to a lower rate of omental adipocytes hypertrophy.15,41,42
2.3. Liver fat and insulin resistance
Tarantino et al.43 observed positive correlation between HOMA and severity of hepatic steatosis in young individuals. In addition, IR was not associated with BMI and adiposity. They questioned if high fat content in liver could be the breaking point between “benign” and “progressive malign” obesity.43
Non-alcoholic fatty liver disease (NAFLD) is considered to be one of the consequences of adipose tissue IR. NAFLD can progress toward more severe stages such as steatohepatitis, fibrosis, and cirrhosis. Nevertheless, in some subjects it is maintained as „simple steatosis‟. Therefore, the terms „metabolically malign‟ and „metabolically benign‟ are also being used to describe the phenotypes of liver disease.44
12
consequence of fat accumulation and is characterized by dyslipidemia and increased hepatic glucose production with hepatic IR.44 Subjects with fatty liver showed a high-risk metabolic profile compared to subjects without fatty liver. This profile was characterized by higher BMI, waist circumference, SAT and VAT, fasting glucose, HOMA, TG, blood pressure, higher prevalence of T2DM, IR and MetS, as well as lower high-density lipoprotein (HDL). Fatty liver remained associated with dyslipidemia and dysglycemia even after adjusting analysis for VAT.46
Ectopic fat in the liver may be more important than visceral fat in the determination of metabolic disabilities in obesity.38 Magkos et al.47 found that a marked increased BMI, total body fat, and VAT was not associated with increased IR or alterations in very low density lipoprotein (VLDL) and VLDL-apo-B-100 metabolism in obese subjects without increased intra-hepatic TG content. The fat content of liver was associated with metabolic dysregulation, supporting the conclusion that increasing whole-body adiposity does not cause additional metabolic disabilities in the absence of increased intra-hepatic TG. Subjects classified as class III obese had nearly twice the volume of VAT than those classified as class I obese, despite having the same amount of intra-hepatic TG.47
2.4. Adipokines profile and inflammation
A chronic inflammatory status is often associated with obesity and IR.48 Adipose tissue plays a central and primary role in inflammation level, which influences insulin sensitivity.49 The infiltration of immune cells is an orchestrating event to induce inflammation and is higher in VAT than SAT.40 The mechanisms for the accumulation of immune cells within the adipose tissue are not fully understood. Changes in the degree of adiposity might modulate the number and phenotype of immune cells. Adipocytes and stromal cells express signaling mediators that attract inflammatory cells (such as neutrophils, macrophages, mast cells, lymphocytes).49 These cells secrete various cytokines (IL-1 , IL-6, IL-8, TNF, and MCP-1) that alter the pattern of expression and secretion of adipokines and cytokines in adipose tissue. This may constitute both a cause and a consequence of adipose tissue inflammation. These mediators in turn, entail adipose tissue dysfunction and impairment of insulin sensitivity, both locally and systemically.15,50
13
correlate with insulin sensitivity that explained 98% of the variation in glucose infusion rate.30 It is suggested that increased VAT mass in obesity without an adequate support of vascularization might lead to hypoxia, macrophage infiltration, and inflammation.30
Recently, gut microbiota has also been suggested to be involved in systemic inflammation and metabolic disorders.22,51,52 The main hypothesis is that gut inflammation, which can be induced by genetic, high fat diet and microbial dysbiosis, leads to increased intestinal permeability and delivery of bacteria and/or bacterial molecules, such as lipopolysaccharides (LPS) to the circulation.22,52,53 As mesenteric fat is contiguous with the gut it would be directly affected by these inflammatory triggering molecules. This would activate mesenteric adipocytes hypertrophy, and increase pro-inflammatory gene expression and cytokine production. Consequently, macrophage infiltration and its activation would be increased in this fat depot. Furthermore, expanding mesenteric fat mass would provide increased fatty acid flux to the liver, which in the long term could result in an inflammed, steatotic, and insulin resistant liver.22
Three human studies partially support this hypothesis. Positive correlations between intestinal permeability markers and waist/abdominal circumferences,54,55 visceral and liver fat,54 insulin and HOMA indices were reported.55 Microbiota composition differed between lean and obese women, while LPS levels were similar.56 Even so, there are reports of higher LPS in obese and diabetic subjects.57-59 In animal model, high saturated fat diet (HFD) increased adipocytes size in all fat depots and also macrophage infiltration in mesenteric and epididymal fat. Mesenteric fat from HFD mice showed higher mRNA levels of TNF-α and IL-6 and was considered „as a metabolically distinct visceral fat depot with the most prominent pro-inflammatory nature‟. In parallel, changes in microbiota and intestinal permeability were also reported.51
In general, an unfavorable or pathogenic phenotypic profile is characterized by adipocytes hypertrophy, visceral and ectopic fat deposition, and pro-inflammatory mediators‟ profile. Considering the association of visceral fat, NEFA flux, and dyslipidemia (hypertriglyceridemia), „Visceral adipose index‟ has been proposed by Amato et al.24 as a possible marker of adipose tissue dysfunction. Its equation encompasses waist circumference, BMI, plasma TG and HDL and may help assess cardiometabolic risk.24
14
modulate insulin sensitivity; 2) The Inflammation Hypothesis: VAT from obese secretes chemokines that promote macrophage infiltration and activation. The activation of immune cells, by LPS for example, results in secretion of inflammatory molecules that interfere with insulin signaling; and 3) The Adipose Tissue Expandability Hypothesis: when an individual´s capacity to increase fat mass is reached, lipid is deposit in ectopic sites and through a lipotoxic mechanism causes IR. These theories are not necessarily unrelated, conversely, one probably complements the other.11,21,25,31
3.Clinical and anthropometric characteristics of different metabolic phenotypes
Among European, Canadian, and North-American subjects, the prevalence of normal weight with metabolic alterations varies from 2.6 to 8.1%, while overweight/obese without MetS represented 2.1 to 37% of the overall sample.17,60-63 According to Wildman‟s study, as a percentage of each BMI group, 51.3% of overweight and 31.7% of obese subjects were classified as MHO, while 23.5% of normal-weight subjects were MONW.62 The high prevalence of MetS in normal-weight and slightly overweight subjects (BMI 18.5-26.9 kg/m2) indicates that metabolic disabilities may also need to be screened in persons with a BMI at the upper end of the normal-weight and lower end of the overweight spectrum.64 The purpose of this section is to present the different criteria used to define MHO and MONW phenotypes (Table 1) and to present physical and biochemical characteristics found in different studies (Tables 2 and 3).
3.1.Metabolically obese normal weight (MONW)
In 1980´s, Ruderman et al.65 discussed about individuals who are not obese by standard weight tables, but who have metabolic disabilities that are characteristically associated with adult-onset obesity. Hyperinsulinism and hypertrophied adipocytes were pointed as major characteristics of MONW.65
15
Screening adiposity in subjects with a normal BMI could also help to identify those at higher risk for metabolic disabilities.68 MONW women showed higher levels of inflammatory markers such as C-reactive protein (CRP), TNF, IL-6, IFN- , IL-1 , which were correlated with higher adiposity.69 Upper body fat percentage tertile was accompanied by higher age, BMI, waist and hip circumferences, LDL, TG, and HOMA, and lower lean mass, HDL, and insulin sensitivity. Lean subjects with MetS were more prevalent in upper tertiles of body fat than in lower tertiles.68 MONW subjects showed larger total and central body fat70, subcutaneous and visceral abdominal adiposity.66-67 Adiposity was positively correlated with HOMA,70 while visceral fat areas were also positively correlated with serum levels of TG, glucose infusion rate, and fasting insulin in MONW subjects.67 Visceral adiposity, even in lean women, might be the key for an accentuated unfavorable metabolic profile, characterized by higher glucose, insulin, and total cholesterol levels than non-MONW women.69
Physical activity, energy expenditure66 and resting metabolic rate71 were lower in MONW subjects compared to control group. Sedentary lifestyle may lead to adiposity increment and higher cholesterol among MONW women since hormones such as leptin, adiponectin, and ghrelin did not differ between these group of women.70
Young women with a BMI lower than 26 kg/m2 could be at a higher risk for impaired insulin sensitivity and for associated comorbities if body fat percentage is higher than 30%.66,71 Most of the studies involving MONW have different criteria and usually a small sample size. However, Conus et al.72 highlighted the consistency of some observations: (i) the prevalence of MONW can reach values as high as 45% of a group, depending on the criteria, age, BMI, and ethnicity; (ii) the main characteristics that distinguishes MONW from control subjects are altered insulin sensitivity, atherogenic lipid profile, higher blood pressure, and abdominal/visceral adiposity, as well as, lower physical activity; and (iii) MONW subjects are at higher risks for T2DM and cardiovascular diseases.72
3.2.Metabolically healthy obese (MHO)
16
There is no standardized method to identify MHO individuals for research protocols or in clinical practice. Usually, most of the studies use the BMI for the definition of obesity (30 kg/m2). The use of body fat percentage (25% for men and 30% for women) would increase the prevalence of obesity in comparison to BMI as shown by Ortega et al.73 Stratification of subjects into quartiles based on clamp, Matsuda and HOMA indices are used to define MHO or insulin sensitive obese (ISO), and insulin resistant obese (IRO).74
The use of different methods to identify MHO subjects resulted in differences in the mean values for peripheral fat mass and HDL. Still, it was possible to cluster biochemical characteristics for MHO subjects:39 lower plasma TG, apolipoprotein B, ferritin as well as lower TG/HDL ratio, fasting insulin, and HOMA values in comparison to „at risk‟ subjects.39,75 Other studies also reported lower glucose,76 total-cholesterol, and LDL as well as significantly higher values of HDL.60,63,75 A better renal function is also reported for MHO compared to IRO subjects, who showed higher serum creatinine levels and lower glomerular filtration rate.76 In one study, diet composition and physical activity did not differ between obese phenotypes.77
When the group of comparison is composed of metabolically healthy normal weight (MHNW) subjects, MHO showed higher waist circumference,74,76 fat mass, blood pressure, carotid intima-media thickness,74 insulin, non-HDL cholesterol, CRP levels, and lower HDL.32,74 This could indicate that the concept of MHO is not appropriate. However, Sesti et al.76 reported that MHO subjects - although exhibited, by selection, significantly higher BMI, and waist circumference - showed no differences in blood pressure, total cholesterol, TG, fasting plasma glucose, fasting insulin, insulin like growth factor-1, and insulin sensitivity compared to MHNW after adjusting for age, gender, and BMI. In this type of analysis, obesity per se is not the biggest issue for metabolic complications. Corroborating this hypothesis, Calori et al.17 verified that insulin sensitive groups (non-obese vs. obese) presented similar metabolic profile. The insulin-sensitive groups were younger, had lower heart rates, higher plasma HDL, lower fibrinogen and TG, as well as a lower prevalence of T2DM and MetS compared to insulin resistant groups.17
17
alanine aminotransferase (ALT) and aspartate aminotransferase (AST), which were lower in MHO women compared to women classified as „at risk‟.79 Non-obese and obese subjects with IR also showed higher levels of hepatic enzymes compared to non-obese insulin sensitive subjects.17 Higher levels of these enzymes seem to reflect fat accumulation in the liver, which could entails hepatic IR.79
Hormonal differences after a oral glucose tolerance test may explain propensity to impaired glucose homeostasis of „at risk‟ obese phenotype. „At risk‟ obese subjects showed higher plasma glucose-dependent insulinotropic polypeptide (GIP), lower post-glucose load glucagon-like peptide-1 (GLP-1), higher glucagon levels in baseline and after glucose load, indicating inappropriate glucagon suppression.80
As discussed earlier, inflammatory status may influence metabolic alterations. Philips & Perry81 found lower concentrations of the protein C3, an acute-phase response protein with a central role in the innate immune system, in MHO and metabolically healthy non-obese subjects. An important consideration is that other inflammatory markers such as TNF-α, CRP, IL-6, PAI-1 and white blood cells count were lower in MHO, but depending on the metabolic health definition.
4. Benefits of weight loss
Weight loss should lead to metabolic benefits, especially on insulin sensitivity, independently of the type of obesity. Preliminary data showed that a 6-month energy-restricted diet reduced similarly and significantly the body weight (6-7%, including 7-10% loss of fat mass) in MHO and „at risk‟ obese postmenopausal women. However, only „at -risk‟ group improved the insulin sensitivity (26%), while MHO group showed a reduction of 13%.82 The authors concluded that an energy-restricted diet associated with small reductions in body fat may improve whole body insulin sensitivity, except for a subset of individuals.82
18
considered a key pathophysiological feature of these diseases. An early pharmacological treatment of IRO subjects in association with a lifestyle intervention may be considered as an appropriate therapeutic approach.83
The lack of homogeneity in treatment responses between obese individuals indicates that a phenotypic characterization may be needed to tailor the treatment according to the individual‟s characteristics/demand. The „fit-fat‟ or metabolically healthy but obese individuals are under interest because they constitute a model that may provide insight into the pathogenesis of IR. It is unclear why these obese subjects are at lower risk of metabolic complications. Lower visceral adiposity and ectopic accumulation of fat, despite a high body fat content, lower pro-inflammatory systemic activation may be involved in this protection.84
5.Controversies
Metabolic risk status is heterogeneous according to the BMI range. IR was observed in 7.7% and 55.7% of normal weight and obese subjects, respectively. Regardless of BMI, those with MetS or IR, were at a significant 4- to 11-fold increased multivariable relative risk of incident T2DM in comparison to normal weight subjects without MetS or IR. Overweight or obese without MetS and overweight insulin-sensitive subjects were not at increased risk for T2DM. However, ISO subjects were at about 3-fold increased risk relative to normal-weight subjects without IR. A quick look to this finding would indicate that even in the absence of IR, obesity by itself might be diabetogenic. Nevertheless, in the absence of metabolic disabilities, obesity did not increase the risk for cardiovascular disease and was a relatively weak risk factor for incident T2DM.61
19
cut-off points or standardized criteria are still a need to strengthen the discussion of limits for benign and malign obesity classification, if this really exists.
The dynamism of fat storage is more complicated than simply „eat less, spend more‟ formula. The use of drugs such as antibiotic shows that changes in the gut microbiome may also modulate adiposity, hepatic lipid, cholesterol, and TG metabolism.88 Depending on the changes induced in the microbiota, an increase88 or a decrease in body weight may be observed.89 This portrays the complexity of the relation between adiposity, IR, and metabolic complications.
Insulin sensitivity is the main differentiating factor between benign vs. malign obesity, „metabolically healthy‟ vs. „at risk‟ or insulin resistant.17,90
Nevertheless, Czech et al.45 emphasize the huge challenges for understanding insulin signaling mechanisms and their dysfunctions. An enormous number of relevant studies associated with insulin metabolism are available (more than 100,000), making it time-consuming the task of „separating fact from fiction‟. Still, confirmatory studies remain necessary to solve controversies about insulin action.
20
omental fat, but not subcutaneous, promotes abdominal obesity, since glucocorticoid receptors are expressed by adipocytes and stromal cells, and are also potent stimulators of adipocytes differentiation.26
Fat distribution has been suggested to be an important determinant of metabolic abnormalities. However, a propesctive cohort study, compared mortality risk between different phenotypes with emphasis in abdominal obesity. Metabolically healthy abdominal obese had a significant higer risk than non-abdominal obese individuals, but not different from metabolically unhealthy abdominal obese.93 Contrary, Mangee et al.94 reported that total fat percentage did not differ between MHO and at risk subjects, while nuchal SAT thickness and VAT mass were signicantly lower in MHO subjects.
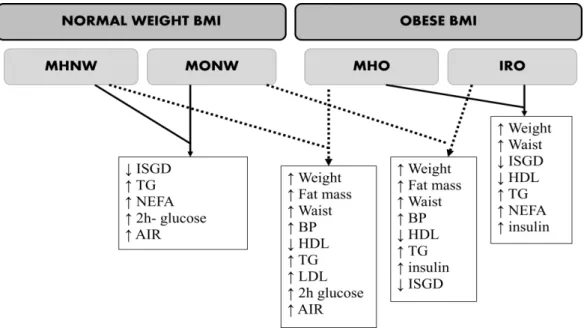
Studies comparing all the phenotypes are still rare. The results from Sucurro et al.37 accomplishing the normal weight and obese BMI range and the different metabolic phenotypes are depicted in Figure 1. The comparisons (MHNW vs. MHO; MONW vs. IRO and MHO vs. IRO) tend to show that being obese does worsen metabolic profile.37 Another study, reported that MHO and IRO phenotypes were associated with higher mortality risk compared with MHNW. Obesity was associated with an increased risk for all cause mortality, regardless of whether the obese patients presented IR or a clustering of metabolic risk factors95 or if they were classified as healthy or unhealthy.86 These findings advocate to the importance of obesity reduction in all obese individuals
The comparison MHNW vs. MONW in Figure 1 shows that others factors rather than weight, total fat mass and waist circumference may be associated with a worse profile. Of note, both genders were included in this study, and for most parameters, the „higher‟ levels does not necessarily mean beyond normal limits. Considering for example MetS criteria threshold96, only IRO group presented mean TG and waist circumference above threshold (> 150 mg/dl and > 102 cm, respectively), while the other groups (MHNW, MHO, MONW) showed values below the threshold.37
21
with normal-fat subjects. The authors suggested that fitness should be included in future research as it is a relevant confounder.73
Given that prevalence of MHO-like subjects is higher in younger-than 4063 and obese subjects with MetS are older than MHO, during aging, transition from obese and apparently healthy to obese with a clustering of risk factors may occur.61-62 Thus, duration of obesity might change the healthy phenotype. In a short follow-up period (3 y), MHO subjects showed a higher incidence of cardiometabolic risk factors and thicker intima-media of the common carotid than normal weight group. Weight gain was significantly associated with the development of these factors, independently of the BMI.98 Other prospective cohort also describes that overweight/obese subjects were at higher risk of developing metabolic syndrome in comparison to normal weight.99 The risk of becoming diabetic was higher in unhealthy obese subjects, while in MHO the risk was lower but still significant. Insulin resistance estimated by means of HOMA-IR at baseline contributed to the explanation of type 2 diabetes risk. The development of obesity in non-obese subjects was also significantly associated with the incidence of diabetes in the follow-up. In addition, depending on the criteria adopted for classification of phenotypes, 30.1-46.9% of MHO subjects at baseline became metabolically non-healthy by the 6-year follow-up.87As suggested by Pataky et al.90, the prevention of the aggravation of obesity is important to any subgroup of obese subjects. MHO individuals may still be at risk for other obesity related complications such as sleep apnea, cancer, and musculoskeletal problems.60
Interestingly, MONW Korean-elderly subjects had the highest risk of death from all causes during 10 years follow-up than overweight subjects without metabolic syndrome and MHO. In addition, MONW subjects had higher systolic blood pressure, serum glucose and triglycerides levels and prevalence of diabetes and hypertension than the MHO phenotype.101 This may point to the importance of ethnicity and genetic factors.
22
find studies including subjects defined as at risk/IRO showing all biochemical values within desirable range. Even so, in the majority of studies (78.6%), IRO subjects did not present metabolic abnormalities (i.e., mean values above reference values), at least at the time of evaluation. Surprisingly, 40% of the studies including MONW subjects reported at least one biochemical alteration in this subgroup. Therefore, more studies in this field, especially follow-up studies, are needed and should investigate other blood markers that may distinguish better these phenotypes biochemically. Mangee et al.94 results suggest uric acid as the best predictor of MetS among juveniles and adults classified as metabolically unhealthy and also as a considerable discriminator between obesity phenotypes.
6. Conclusion
In conclusion, excess weight has been considered a signal of current or future health problems. A subgroup of obese has emerged as a category that possibly escapes common metabolic disorders, at least for a certain period. Obesity and normal weight might be heterogeneous in regard to its effects and is less deleterious in the absence of IR. Metabolic abnormalities associated with MetS seem to depend on the absence or presence of IR, especially hepatic, and inflammatory signaling activation. A consensus regarding the criteria used to define metabolic health is needed.
The relationship between adiposity and metabolic disabilities, including IR, or even mortality is more complex than it appears. The concept of „metabolic set point‟ proposed by Virtue and Vidal-Puig11 highlights the importance of individuality. The idea is that each individual has its own level of body weight and adipose tissue expansion beyond which metabolic homeostasis and capacity to buffer lipids will be compromised. This impairment may be even greater as visceral fat accumulation increases, as also demonstrated for normal weight subjects. Visceral adiposity seems to be a strong characteristic associated with higher risk, independently of body mass index. For some individuals, extra pounds may not be as detrimental as in others, especially if this excess is deposited in subcutaneous depots. However, the contribution of subcutaneous fat to metabolic disorders should not be underestimated.
23
MHO subjects are permanently protected from the development of co-morbidities in long-term. The real meaning of the term „metabolically healthy obesity‟ is still controversial and more studies in this field are of great interest. Although the term MHO makes sense, being obese may bring other problems related to joints, sleep apnea and respiratory problems, depression and several cancers, independently of phenotype. Finally, the „lean appearance‟ is not necessarily synonymous of health. What MONW and obese at risk have in common? Of note, the influence of ethnicity, genetic polymorphisms and gender should be further explored in future studies including all body size phenotypes.
24 Figure 2 – Categorization of glucose and lipid profile parameters means according to reference values from the 17 studies represented in table 3. Biochemical parameters from
25
Table 1 – Criteria for definition of different body size phenotypes in different studies: metabolically healthy normal weight (MHNW), metabolically obese normal weight (MONW), metabolically healthy obese (MHO) and insulin resistant obese (IRO)
Ref Method Criteriaa
(68) Body fat percentage
(by bioelectrical impedance)
MONW: >23.1% for men (n=1017) and >33.3% for women (n=1045)
(69) Body fat percentage
(by DXA)
MONW: >30% for women (n=20)
(70) HOMA MONW: HOMA >1.69 (n=12)
Non-MONW: HOMA <1.69 (n=84)
(17) HOMA MHNW: HOMA <2.5 (n=708)
Nonobese-IR: HOMA 2.5 (n=923)
ISO: HOMA <2.5 (n=43)
IRO: HOMA 2.5 (n=337)
(32) HOMA MHO: absence of T2D, of IR (HOMA>3.6 for males and 3.13 for females), MetS and history of treatment with lipid-lowering drugs (n=314)
MHNW: the same criteria as considered for MHO, but also normal weight (n=1173)
IRO: HOMA >3.6 for males and 3.13 for females (n=843)
(43) HOMA ISO: HOMA <1.95 (n=21)
IRO: HOMA 1.95 (n=21)
26
clamp (glucose disposalb) MHNW: >8 ml.min-1.kg-1 of FFM (n=58)
(74) Euglycemic-hyperinsulinemic clamp (glucose disposalb)
MHO: >13.2 mg/min x kgFFM (n=20)
IRO: <9.9 mg/min x kgFFM (n=40)
(82) Euglycemic-hyperinsulinemic clamp (glucose disposalb)
(glucose disposalb)
MHO: 73.9 µmol min-1[kg FFM]-1 (n=30)
Low insulin sensitivity: 49.9 µmol min-1[kg FFM]-1 (n=30)
(37) Euglycemic-hyperinsulinemic clamp (glucose disposalb)
MHO: >12.3 mg/min x kgFFM (n=22)
IRO: <8.7 mg/min x kgFFM (n=43)
MONW: <10.2 mg/min x kgFFM (n=27)
MHNW: >12.3 mg/min x kgFFM (n=55)
(97) Euglycemic-hyperinsulinemic clamp (glucose disposalb)
MHO: 11.6 mg/min x kgFFM (n=18)
At risk: <10.6 mg/min x kgFFM (n=18)
(30) Euglycemic-hyperinsulinemic clamp (glucose disposalb)
MHO: >70 µmol x kg-1 x min-1 (n= 30)
IRO: <60 µmol x kg-1 x min-1 (n= 30)
(38) Oral glucose tolerance test to calculate ISIc
ISO: upper quartile of ISI (n=31)
IRO: in the lower 3 quartiles of ISI (n=96)
(76) Oral glucose tolerance test to calculate ISIc
MHO: 76.8 mg x L2 x mmol-1 x mU-1 x min-1 (n=106)
IRO: 61.3 mg x L2
x mmol-1 x mU-1 x min-1 (n=212)
27
Matsuda índex: MHO (upper quartile; n=26); ‘at risk’ (lower three quartiles, n=78)
HOMA: MHO (lower quartile; n=28); ‘at risk’ (upper quartile; n=28)
Wildman´s criteria: MHO having 0–1 cardiometabolic disabilities (SBP/DBP ≥1γ0/85 mmHg, TG ≥1.7 mmol/l, glucose ≥5.6 mmol/l, HOMA >5.13, hsCRP >0.1 mg/l, HDL-C <1.3 mmol/l) (n=26); ‘at risk‟ (2 disabilities; n=84)
Kareli´s criteria: MHO (meeting 4 out of 5 metabolic factors: HOMA ≤β.7, TG ≤1.7 mmol/l, HDL ≥1.γ mmol/l, LDL ≤β.6 mmol/l, hsCRP ≤γ.0 mg/l) (n=β6); „at risk’ (meeting less than 3; n=85)
(85) Comparison of 3 methods HOMA: MHO (HOMA < 2.5) (n=228); MUO (n=932)
ATP-III: MHO 2 MetS criteria (fasting glucose 5.6 mmol/L or T2D medication; SBP130 or DBP 85 mmHg or antihypertensive medication; TG 1.7 mmol/L or cholesterol-lowering medications; HDL <1.04 mmol/L (males) and <1.3 mmol/L (females); waist >102 cm (males), >88cm (females) (n=513); MUO (n=647)
Combined: MHO 1 criteria (HOMA 1.95 or T2D medication; TG 1.7 mmol/L or cholesterol-lowering medications; HDL <1.04 mmol/L (males) and <1.3 mmol/L (females); LDL 2.6 mmol/L; total cholesterol 5.2 mmol/L (or cholesterol-lowering medication) (n=99); MUO (n=1061)
(73) Biochemical parameters, BMI or BF%
MHO: BF 25% (men) and 30% (women) or BMI 30 kg/m2+ meet 1 of the metabolic disabilities (SBP/DBP 130/85 mmHg;
TG 1.7 mmol/L, HDL <1.03 mmol/L (males) and <1.3 mmol/L (females); fasting glucose 5.55 mmol/L; history of physician diagnosis of hypertension or T2D) (n=5959 for BF criteria) (n=1738 for BMI criteria)
(62) Biochemical parameters (n=5440) Cardiometabolic disabilities(CA): BP (130/85 mmHg), fasting TG 1.69 mmol/l, HDL <1.03 mmol/l (men) and <1.29 mmol/l (women), fasting glucose 5.55 mmol/l, HOMA >5.13, hsCRP >0.1 mg/l
MHNW: BMI <25 kg/m2 and <2 CA (n=26.4%)
MONW: BMI <25 kg/m2 and 2 CA (n=8.1%)
MHO: BMI 30 kg/m2 and <2 CA (n=9.7%)
28
(41) Biochemical parameters MHO: no history of cardiovascular, respiratory or metabolic diseases, not taking medications, normal thyroid status, glucose 5.6 mmol/L, blood pressure 135/85, TG/HDL ratio 1.65 (men) e 1.32 (women) (n=15)
MUO: failure to meet at least one of the criteria above (n=14)
(63) Biochemical parameters MHO: BMI 30 kg/m2, HDL 40 mg/dL, absence of T2D and absence of hypertension (n=36)
(42) Biochemical parameters MHO: without MetS (n=37)
MetS: three or more components: waist 85 cm, TG 1.7 mM; HDL <1.29 mM; SBP 130 mmHg or DBP 85 mmHg; fasting glucose 5.6 mM (n=28)
(60) Biochemical parameters MHO: when 4 out of 5 biochemical parameters are met below cut-off points proposed for lipid profile (TG 1.7 mmol/l; total cholesterol 5.2 mmol/l; HDL 1.3 mmol/l and LDL 2.6 mmol/l and HOMA 1.95) (n=19)
(100) Biochemical parameters MHO: when 4 out of 5 biochemical parameters are met below cut-off points proposed for lipid profile (TG 1.7 mmol/l; HDL 1.3 mmol/l and LDL 2.6 mmol/l) and HOMA 2.7, hs(?)-CRP levels ( 3mg/l) (n=32)
MONW, metabolically obese normal weight; DXA, dual energy X-ray absorptiometry; HOMA, homeostasis model assessment; MHNW, metabolically healthy normal weight; ISO, insulin-sensitive obese; IRO, insulin resistant obese; MHO, metabolically healthy obese; hsCRP, high-sensitive C-reactive protein; MetS, metabolic syndrome;SBP, systolic blood pressure; DBP, diastolic blood pressure; TG, triglycerides; MUO, metabolically unhealthy obese; T2D, type 2 diabetes.
aNormal weight group defined considering BMI > 18.5 and <24.9 kg/m2, obese BMI 30 kg/m2, nonobese BMI > 18.5 and <30 kg/m2 .
bGlucose disposal (M) or glucose infusion rate (GIR): mean rate of glucose infusion during the last 45-60 min of the clamp examination (steady-state). Expressed as
milligrams per minute per kilogram fat free mass (MFFM) or µmol x min -1
x [kg FFM]-1.
29
Table 2 – Physical characteristics of different body size phenotypes: metabolically healthy normal weight (MHNW), metabolically obese normal weight (MONW), metabolically healthy obese (MHO) and insulin resistant obese (IRO)
Ref Sample BMI Fat mass
(%)
Lean mass (kg)
Waist (cm) Visceral fat (cm2) SAT (cm2)
(17) 708 NW (392F/316M) 23.8 ± 2.8a - - 82 ± 9a - -
923 MONW (512F/411M) 25.8 ± 2.3b - - 89 ± 10b - -
43 MHO (31F/12M) 32.5 ± 4.3c - - 94.4 ± 4c - -
337 IRO (191F/146M) 33.3 ± 3.4d - - 104 ± 11d - -
(37) 55 NW (44F/11M) 22.6 ± 1.9a 27.5 ± 8.5a 44.9 ± 7.9a 76 ± 9a - - 27 MONW (18F/9M) 23.4 ± 1.6a 29.6 ± 9.2a 44.7 ± 10a 79 ± 9a - - 22 MHO (19F/3M) 34.5 ± 4.7b 42.1 ± 20.3b 51.3 ± 12.2b 98 ± 9b - - 43 IRO (28F/15M) 36.4 ± 6.4b 45.7 ± 19.2b 54.7 ± 15.5b 106 ± 12c - -
(66) 58 NW (F) 21.5 ± 2.0 27.4 ± 5.5a 40.3 ± 4.0 - 35 ± 14a 160 ± 78a 13 MONW (F) 22.5 ± 2.0 31.8 ± 5.9b 38.9 ± 5.1 - 44 ± 16b 213 ± 61b
(69) 20 NW (F) 19.2 ± 1.5a 23.3 ± 2.2a - 65.1 ± 3.9a - -
20 MONW (F) 22.6 ± 1.9a,b 34.9 ± 5.0b - 72.3 ± 4.9a,b - -
20 OHR (F) 27.9 ± 4.6b 42.9 ± 7.3b - 85.8 ± 10.2b - -
(70) 84 NW (F) 21.8 ± 2.5 25.04 ± 5.8a 41.6 ± 4.1a - - -
12 MONW (F) 21.9 ± 3.4 32.2 ± 8.2b 37.6 ± 3.2b - - -
(30) 30 MHO (20F/10M) 45.1 ± 1.3 50.5 ± 7.0 - 132 ± 5.2a 138 ± 27a 935 ± 124 30 IRO (20F/10M) 45.2 ± 1.2 51.2 ± 5.8 - 138 ± 8.1b 316 ± 91b 890 ± 110
(32) 594 NW (M) 22.5 (22.4-22.7)b - - 84.5 (83.8-85.2)b - -
120 MHO (M) 32.8 (32.3-33.3)a - - 110.2
(108.3-112.1)a
- -
579 NW (F) 22.2 (22.1-22.4)a - - 78.6 (78-79.3)a - -
194 MHO (F) 34.4 (33.6-35.1)b - - 103.6
(101.9-105.3)b
30
(38) 54 NW (45F/9M) - 26.9 ± 1.0a - 79.2 ± 1.0a - -
31 MHO (19F/12M) - 36.6 ± 1.3b - 104.6 ± 1.7b - -
96 IRO (59F/37M) - 36.9 ± 0.8b - 107.4 ± 1.0b - -
(39) 28 MHO (F) 34.1 ± 3.0 - 42.4 ± 4.5a 104.7 ± 9.1 190.2 ± 44.4a 529.5 ± 97.4 28 OHR (F) 34.6 ± 2.8 - 47.4 ± 6.6b 107.5 ± 7.6 229.8 ± 54.3b 501.4 ± 89.0
(42) 37 MHO (F) 27.2 ± 1.6 - - 93.1 ± 5.6 - -
28 MetSO (F) 28.1 ± 2.3 - - 95.4 ± 7.8 - -
(60) 19 MHO (F) 33.5 ± 5.2 46.2 ± 9.7 44.7 ± 6.6 91.5 ± 5.9 - - 135 OHR (F) 34.4 ± 5.5 45.7 ± 11.4 45.4 ± 6.0 98.5 ± 9.7 - -
(63) 36 MHO (34F/2M) 43.6 ± 8.6 50.0 ± 5.5 - 103.2 ± 12.2a - -
88 OHR (78F/10M) 43.4 ± 8.9 50.5 ± 4.0 - 116.7 ± 13.9b - -
(74) 73 NW (F) 23.8 ± 2.8a 26.3 ± 7.8a 42.6 ± 6a 76.8 ± 8a - -
20 MHO (F) 37.7 ± 9.9b 51 ± 19b 44 ± 15a 100 ± 13b - -
40 IRO (F) 39 ± 7.4 43.5 ± 13.8b 56 ± 10b 108 ± 14b - -
(75) 22 MHO (F) 32.3 ± 4.1 47.7 ± 4.8 40.4 ± 3.8a 96.3 ± 8.6 - - 22 OHR (F) 34.8 ± 3.9 45.5 ± 4.4 47.4 ± 7.6b 102.1 ± 9.2 - -
(76) 122 NW (70F/52M) 23.9 ± 1.6a - 49 ± 9a 86 ± 9a - -
106 MHO (62F/44M) 34.2 ± 5.6b - 55 ± 10b 105 ± 10b - -
212 IRO (124F/88M) 35.2 ± 5.1b - 55 ± 12b 111 ± 11c - -
(79) 26 MHO (F) 33.6 ± 2.7 - 42.1 ± 4.1a 103.6 ± 7.0 175.8 ± 43.9a - 78 OHR (F) 34.2 ± 2.8 - 44.8 ± 6.2b 107.2 ± 9.5 209.2 ± 47.8b -
(83) 26 MHO (12F/14M) - - - 106.1 ± 1.9 - -
77 IRO (34F/43M) - - - 108.1 ± 1.1 - -
31
Table 3 – Biochemical characterization of different body size phenotypes: metabolically healthy normal weight (MHNW), metabolically obese normal weight (MONW), metabolically healthy obese (MHO) and insulin resistant obese (IRO)
Ref Sample Glucose (mmol/l) Insulin (pmol/l) HOMA TC (mmol/l) HDL (mmol/l) LDL (mmol/l) TG (mmol/l)
(17) 708 NW (392F/316M) 4.8 ± 0.5a 50 ± 13a 1.8 ± 0.5a 5.9 ± 1.1a 1.5 ± 0.4a 3.9 ± 1.0a 1.15 ± 0.6a
923 MONW (512F/411M) 5.4 ± 1.1b 112 ± 70b 4.6 ± 3.7b 6.2 ± 1.1b 1.3 ± 0.4b 4.2 ± 1.0b 1.56 ± 1.0b 43 MHO (31F/12M) 4.8 ± 0.3a 56 ± 13a 2 ± 0.4a 6.2 ± 1.2a 1.5 ± 0.3a 4.1 ± 1.0a 1.26 ± 0.6a 337 IRO (191F/146M) 6.0 ± 1.7c 154 ± 70c 7.2 ± 5.6c 6.1 ± 1.1a,b 1.2 ± 0.3c 4.1 ± 1.1b 1.7 ± 0.9c
(37) 55 NW (44F/11M) 4.8 ± 0.6 55.5 ± 55.5a - 4.8 ± 0.9 1.6 ± 0.4a 2.8 ± 0.7a 0.86 ± 0.4a
27 MONW (18F/9M) 4.9 ± 0.5 55.5 ± 20.8a - 4.9 ± 0.9 1.5 ± 0.4a 3.1 ± 0.9a 1.0 ± 0.6b 22 MHO (19F/3M) 4.8 ± 0.5 76.4 ± 34.7a - 5.1 ± 1.0 1.4 ± 0.3b 3.2 ± 0.8b 1.1 ± 0.4c 43 IRO (28F/15M) 5.1 ± 0.5 118 ± 48.6b - 5.2 ± 0.9 1.2 ± 0.4b 3.2 ± 0.8a,b 1.8 ± 0.8d
(66) 58 NW (F) 4.4 ± 0.3 49 ± 15a - 4.5 ± 0.7a 1.5 ± 0.3 2.7 ± 0.8 2.4 ± 1.0
13 MONW (F) 4.4 ± 0.4 60 ± 20b - 5.3 ± 0.9b 1.7 ± 0.5 3.1 ± 0.9 2.4 ± 0.7
(69) 20 NW (F) 5.2 ± 0.18 45.8 ± 9.7 1.4 ± 0.1a 4.6 ± 0.45a 1.79 ± 0.17 2.77 ± 0.9 0.75 ± 0.12a
20 MONW (F) 5.1 ± 0.16 44.4 ± 12.5 1.5 ± 0.2a,b 4.87 ± 0.67a,b 1.76 ± 0.32 2.69 ± 0.63 0.97 ± 0.16a,b 20 OHR (F) 5.4 ± 0.11 63.2 ± 7.6 2.2 ± 0.6b 5.65 ± 0.63b 1.82 ± 0.51 3.0 ± 0.91 1.26 ± 0.19b
(70) 84 NW (F) 4.65 ± 0.3b 30.6 ± 12.1b 0.91 ± 0.4b 4.4 ± 0.9b 1.68 ± 0.4 2.3 ± 0.7 0.82 ± 0.3
12 MONW (F) 4.8 ± 0.3a 70.3 ± 13.7a 2.19 ± 0.5a 5.1± 1.4a 1.69 ± 0.4 3.0 ± 1.6 0.85 ± 0.3
(30) 30 MHO (20F/10M) 5.2 ± 0.2a 29.8 ± 14a - 4.9 ± 0.9 1.4 ± 0.2a 2.9 ± 0.9 1.2 ± 0.4a
30 IRO (20F/10M) 5.7 ± 0.4b 104.7 ± 30b - 5.2 ± 1.0 1.0 ± 0.3b 3.1 ± 0.9 1.9 ± 1.2b
(32) 594 NW (M) 5.1 (5.1-5.2) 46.6 (44.5-48.1)a 1.5 (1.4-1.6)a 4.9 (4.8-5.0) 1.3 (1.3-1.4)a 4.9 (4.8-5.0) 1.2(1.1-1.3)
120 MHO (M) 5.2 (5.1-5.3) 68.1 (63.1-73.2)b 2.2 (2.1-2.4)b 5.0 (4.8-5.2) 1.2 (1.2-1.3)b 5.0 (4.8-5.2) 1.3 (1.2-1.4) 579 NW (F) 4.94 (4.9-4.98) 41.6 (39.5-43.7)a 1.3 (1.2-1.4)a 4.96 (4.87-5.06) 1.66(1.62-1.7)a 2.83(2.74-2.91)a 1.03(0.95-1.12) 194 MHO (F) 4.97 (4.9-5.05) 63.8 (61.8-66.6)b 2.0 (1.9-2.1)b 4.99 (4.8-5.16) 1.44(1.39-1.49)b 3.03(2.89-3.18)b 1.13(1.03-1.24)
(38) 54 NW (45F/9M) 5.1 ± 0.08a 37.0 ± 2.01a 1.43 ± 0.1a 5.1 ± 0.13 1.57 ± 0.05a 3.12 ± 0.1 1.1 ± 0.05a
31 MHO (19F/12M) 5.06 ± 0.07a 39.03 ± 2.01a 1.45 ± 0.06a 5.03 ± 0.08 1.37 ± 0.05b 3.02 ± 0.1 1.6 ± 0.33a,b 96 IRO (59F/37M) 5.4 ± 0.004b 90.9 ± 4.03b 3.63 ± 0.15b 4.98 ± 0.08 1.26 ± 0.02b 3.27 ± 0.1 1.49 ± 0.11a,b
(39) 28 MHO (F) 5.3 ± 0.4 87.5 ± 26.4a