Revista Brasileira de
Engenharia Agrícola e Ambiental
Campina Grande, PB, UAEA/UFCG – http://www.agriambi.com.br
v.20, n.6, p.533-538, 2016
Gas exchange and leaf contents in bell pepper
under energized water and biofertilizer doses
Francisca R. M. Borges
1, Thales V. de A. Viana
1, Albanise B. Marinho
2,
Luis G. Pinheiro Neto
3& Benito M. de Azevedo
1DOI: http://dx.doi.org/10.1590/1807-1929/agriambi.v20n6p533-538
A B S T R A C T
The objective of this study was to evaluate the effect of energized water and bovine biofertilizer doses on the gas exchange and NPK contents in leaves of yellow bell pepper plants. The experiment was conducted at the experimental area of the Federal University of Ceará, in Fortaleza-CE, Brazil, from June to November 2011. The experiment was set in a randomized block design, in a split-plot scheme; the plots were composed of treatments with energized and non-energized water and the subplots of five doses of liquid biofertilizer (0, 250, 500, 750 and 1000 mL plant-1 week-1). The following variables were analyzed: transpiration, stomatal conductance, photosynthesis and leaf contents of nitrogen (N), phosphorus (P) and potassium (K). Water energization did not allow significant increases in the analyzed variables. The use of biofertilizer as the only source of fertilization was sufficient to provide the nutrients N, P and K at appropriate levels for the bell pepper crop.
Trocas gasosas e teores foliares no pimentão
sob água energizada e doses de biofertilizante
R E S U M O
Objetivou-se, neste trabalho, avaliar o efeito da aplicação de água energizada e doses de biofertilizante bovino, nas trocas gasosas e nos teores foliares de NPK em plantas de pimentão amarelo. O experimento foi realizado na área experimental da Universidade Federal do Ceará, em Fortaleza–CE, no período de junho a novembro de 2011. O delineamento experimental foi em blocos casualizados no esquema de parcelas subdivididas, constituídas pelos tratamentos água energizada e não energizada e as subparcelas por cinco doses de biofertilizante líquido (0, 250, 500, 750 e 1000 mL planta-1 semana-1). Foram analisadas as seguintes variáveis: transpiração, condutância estomática, fotossíntese e teores foliares de nitrogênio (N), fósforo (P) e potássio (K). A energização da água não possibilitou elevações significativas nas variáveis analisadas. O uso do biofertilizante como única fonte de adubação foi suficiente para disponibilizar os nutrientes NPK em níveis adequados para a cultura do pimentão.
Key words:
Capsicum annuum L. organic fertilization photosynthesis
Palavras-chave:
Capsicum annuum L. fertilização orgânica fotossíntese
1 Universidade Federal do Ceará/Departamento de Engenharia Agrícola. Fortaleza, CE. E-mail: robevania_b@hotmail.com (Corresponding author); thales@ufc.br; benito@ufc.br
2 Universidade da Integração Internacional da Lusofonia Afro-Brasileira/Instituto de Desenvolvimento Rural. Redenção, CE. E-mail: albanise@unilab.edu.br 3 Instituto Federal de Educação, Ciência e Tecnologia do Ceará. Sobral, CE. E-mail: luis.neto@ifce.edu.br
Introduction
Water is an essential factor in agriculture and there is the need for searching new technologies aiming its better use (Charlo et al., 2009). After an energization treatment using Aquatron®, water can become more available to plants, since,
when pumped to the device, it receives an energy charge that makes its molecules freer, promoting higher absorption (Aquatron, 2015).
Evaluating the production of yellow pepper irrigated with
energized water and biofertilizer doses, Borges et al. (2014)
concluded that this water treatment did not promote significant alterations in the cultivation under ideal water conditions.
Organic fertilizers, such biofertilizers, have been studied
in vegetables (Sediyama et al., 2014) and constitute strategic
alternatives for yield increment and reduction in production costs, contributing to the balanced supply of macro and micronutrients (Rodrigues et al., 2009; Patil, 2010). Menezes Junior et al. (2008) reported that the addition of biofertilizer met the nutritional requirements of papaya in micronutrients. Melo et al. (2013) observed that this input increased the yields of bean and corn.
There is information in the literature evidencing the benefits of using organic sources in agriculture; however, studies involving the effects of organic fertilization on gas exchanges are still scarce. Thus, this study aimed to evaluate the effect of the application of energized water and biofertilizer doses on gas exchanges and leaf contents of N, P and K of bell pepper (Capsicum annum L.).
Material and Methods
The experiment was carried out at the experimental area of the Agrometeorological Station, at the Federal University of Ceará (UFC), in the municipality of Fortaleza-CE, Brazil, and started in May 2011. According to Köppen’s classification, the climate of the region is Aw’, rainy tropical, with high temperatures and rainy season predominantly from January to May, annual means in the period from 1981 to 2011 of: rainfall, 1,606.3 mm; temperature, 27.0 ºC and evapotranspiration, 1,832.7 mm.
The experiment used the bell pepper cultivar ‘Sunny F1’, with cycle of 173 days after transplantation (DAT). Plants were
cultivated in 40-L pots (plastic buckets), filled with a 5-cm layer
of crushed stone and the rest of its volume completed with a mixture of sand and soil, classified as Red Yellow Argisol (EMBRAPA, 2006), at the proportion of 1:1. A substrate sample collected at the depth of 0.2 m was homogenized and sent to the laboratory for the determination of the chemical attributes shown in Table 1, according to EMBRAPA (1997).
The treatments were distributed in randomized blocks in a split-plot scheme, with four replicates. Plots were represented by two water treatments (energized and non-energized) and subplots by five doses of liquid bovine biofertilizer (0, 250, 500, 750 and 1000 mL plant-1 week-1), considering three plants for
evaluation, in a total of 120 experimental units.
Water energization was performed using the device Aquatron® Green Machine, which consists of two parts: an
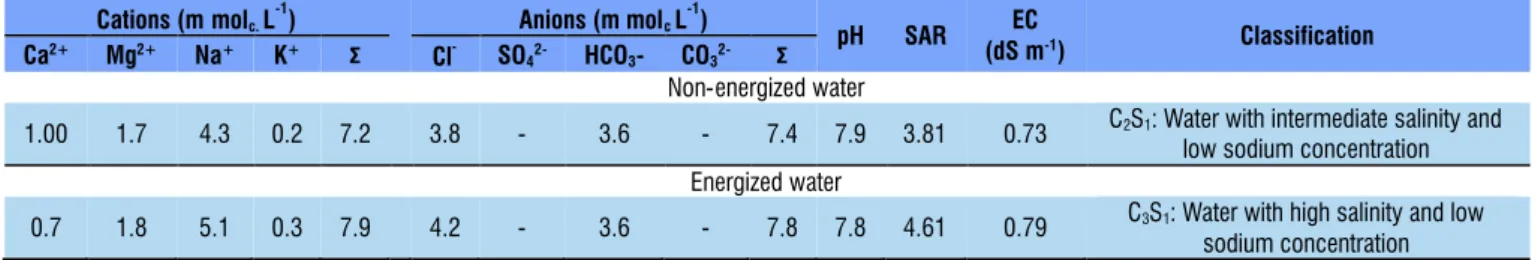
electronic control panel and an energy chamber. The controller sends electromagnetic signals to the electrodes installed inside the energy chamber, through which the water passes and is subjected to energization. These signals are converted to ultra-low-frequency (ULF) waves and, according to the manufacturer, they modify the arrangement of the water molecule (from polygonal to a more linear structure), breaking its surface tension and thus facilitating its absorption by the root system. Water chemical analyses are shown in Table 2.
Irrigation was performed using a drip system, which had one line of emitters per plant row and one emitter per plant, with mean flow rate of 8 L h-1. Water was daily supplied and
the irrigation time was calculated based on the evaporation measured in a Class A pan. As to the biofertilizer, the doses were divided into two applications per week.
The aerobic biofertilizer was produced in a 760-L polyethylene container with a mechanical agitator using bovine
manure, water, cow milk, PT-4-O (accelerator of composting of organic residues), bone flour, MB4 stone powder, brown
sugar and milk. Samples of the biofertilizer were collected and chemically analyzed according to EMBRAPA (2009), showing the following results: N, P, K, Ca and Mg (g L-1): 0.2, 0.1, 0.8,
4.3 and 0.7, respectively, pH = 7.23 and EC = 4.10 dS m-1.
At 67 and 173 DAT, five recently-developed leaves were collected per treatment for the determination of N, P and K contents, through the methods of micro-Kjeldahl, colorimetry and flame photometry, respectively (Malavolta, 1997). Gas
Source: Laboratory of Soils and Water for Irrigation/IFCE of Limoeiro do Norte. C – Carbon; OM – Organic matter; SB – Sum of exchangeable bases; CEC – Cation exchange capacity; V – Base saturation; SSP – Sodium saturation percentage
Chemical characteristics
C OM
pH P
mg dm-3
K Ca Mg Na H+Al SB CEC V SSP
g kg-1 mmol
cdm-3 %
12.83 22.12 7.0 1.064 3.68 41.5 33.5 5.61 5.8 84.3 90.1 94 0
Table 1. Chemical analyses of the substrate (soil + sand)
Source: Laboratory of Soils and Water for Irrigation/IFCE of Limoeiro do Norte. ∑ = sum; SAR – Sodium adsorption rate; EC – Electrical conductivity Cations (m molc.L
-1
) Anions (m molcL
-1
)
pH SAR EC
(dS m-1) Classification
Ca2+ Mg2+ Na+ K+
Σ Cl- SO42- HCO3- CO32- Σ
Non-energized water
1.00 1.7 4.3 0.2 7.2 3.8 - 3.6 - 7.4 7.9 3.81 0.73 C2S1: Water with intermediate salinity and
low sodium concentration Energized water
0.7 1.8 5.1 0.3 7.9 4.2 - 3.6 - 7.8 7.8 4.61 0.79 C3S1: Water with high salinity and low
sodium concentration
exchanges (photosynthesis, transpiration and stomatal conductance) were measured at 100 DAT (plants were still in the reproductive stage) using an infrared gas analyzer (IRGA
- LI 6400 XT, LICOR), in an open system, with air flow of
300 mL min-1 and measurements between 9 and 12 h, in fully
expanded leaves.
The results were subjected to analysis of variance and, when significant, to regression analysis. Means referring to water energization were compared by Tukey test, when applicable, with P < 0.05, using the computer program Assistat (Silva & Azevedo, 2002). Biofertilizer doses were evaluated through regression and the equations that best fitted to the data were selected based on the significance of the regression coefficients at the significance levels of 0.01 and 0.05 by F test and on the highest coefficient of determination (R2).
Results and Discussion
According to the summary of the analysis of variance (Table 3), water energization did not promote significant effect on the studied variables, except for the leaf contents of K at 67 DAT. Biofertilizer doses had effect on the leaf contents of N and P at 67 DAT and N, P and K at 173 DAT. There was significant interaction of Water energization x Biofertilizer doses for the variables transpiration, N at 67 DAT and K at 173 DAT.
The comparative analysis of the means by Tukey test for K contents at 67 DAT, as a function of water energization, is shown in Figure 1. According to the results, under the conditions of this experiment, non-energized water caused a
4.6% lower K content in the sampled bell pepper leaves.
The observed K contents are within the range considered as adequate for the crop, according to Trani & Raij (1996). The mean
K content of 48.9 g kg-1 was higher than that reported by Araújo
et al. (2007), 42.98 g kg-1 in bell pepper treated with biofertilizer.
Interactions between nutrients can facilitate or hamper their absorption by plants. These processes of antagonism or synergism between nutrients may have affected the effect of water energization, since the process increases the efficiency of application of biofertilizers and the absorption of some nutrients, such as N and K (Aquatron, 2015).
P contents linearly decreased with the increase in biofertilizer doses (Figure 2).
This tendency can be explained by the source-sink relationship based on the number of fruits obtained at each dose. In the control and at the lowest dose, the mean number
of fruits per plant was 7, which is surpassed by the doses of 750 and 1000 mL plant-1 week-1, which showed mean of 10
fruits per plant. At 67 DAT, the plant was already producing fruits and the contents of P were possibly being transferred to the sink (fruits).
At all biofertilizer doses, the mean P contents remained within the range considered as adequate for the crop, varying from 2 to 8 g kg-1 (Trani & Raij, 1996). The highest P content
(4.6 g kg-1) was observed at the dose zero and is higher than
that reported by Santoro et al. (2013), 2.4 g kg-1.
Leaf N contents in bell pepper at 173 DAT as a function of biofertilizer doses best fitted to a quadratic polynomial regression model (Figure 3). The N content reached its
*Significant F test at 0.05; **Significant by F at 0.01; nsNot significant, CV – Coefficient of variation; DF – Degrees of freedom; DAT – Days after transplantation Source of variation DF
Mean square
A gs E N P K N P K
67 DAT 173
Water energization (En) 1 4.290ns 0.003ns 7.009ns 0.056ns 0.011ns 37.969* 0.023ns 0.036ns 15.769ns
Residue (a) 4 50.205 0.016 1.832 1.409 0.088 1.981 3.454 0.994 7.881
Biofertilizer (Bio) 4 12.666ns 0.007ns 1.402ns 14.602* 0.289* 4.378ns 6.548* 0.857** 46.050*
Interaction En x Bio 4 15.272ns 0.009ns 2.995* 14.790* 0.107ns 9.891ns 4.027ns 0.232ns 46.050*
Residue (b) 16 6.601 0.004 0.737 3.583 0.065 5.059 1.767 0.085 10.444
CV – a (%) - 49.73 49.07 22.39 3.74 6.77 2.87 9.18 14.32 6.38
CV – b (%) - 18.03 24.00 14.20 5.97 5.82 4.59 6.57 4.19 7.34
Table 3. Summary of the analysis of variance for the values of photosynthesis (A), stomatal conductance (gs), transpiration (E) and leaf contents of N, P and K as a function of the application of energized and non-energized water and different doses of biofertilizer in bell pepper
43 44 45 46 47 48 49 50 51 52
Energized Non-energized
Kc
on
te
nt
s(
gk
g
-1)
Water energization 50.1
47.8
Figure 1. Potassium (K) contents in bell pepper leaves at 67 days after transplantation, as a function of irrigation with energized and non-energized water
4.0 4.1 4.2 4.3 4.4 4.5 4.6 4.7
0 200 400 600 800 1000
P67DAT= 4.6475 - 0.0005*x R = 0.822
Pc
on
te
nt
s(
gk
g
-1)
Biofertilizer doses (mL plant-1week )-1
maximum value of 20.80 g kg-1 at the dose of 275 mL plant-1
week-1; in this period, N contents remained below the
recommended range (Trani & Raij, 1996), but the crop was in the fruiting stage and, probably, the nutrients of the leaves might have been exported to the fruits.
Considering the P contents in the same period and the biofertilizer doses, the data best fitted to an increasing linear function, with R2 of 0.59. P contents ranged from 6.81 to 7.26
g kg-1. Under these conditions, the following equation was
generated: P173DAT = 6.596 + 0.0007**x. Therefore, there was
an inversion of the tendency, compared with the analysis performed at 67 DAT. This positive influence of biofertilizer doses observed at the end of the harvests probably occurred because of the accumulation of nutrients for a new cultivation cycle. These results corroborate those of Menezes Júnior et
al. (2014), who observed P accumulations increasing linearly
with the increment in biofertilizer doses, but are different from those of Alves et al. (2009), who reported increase in P contents with the biofertilizer doses, which, when high, reduced these contents.
At 100 DAT, the transpiration rate of bell pepper as a function of biofertilizer doses, when plants were irrigated with energized water, best fitted to a quadratic polynomial model, with coefficient of determination of 0.31, generating the following equation: Eenerg. = 6.6503 – 0.0017x + 0.000002*x2.
Plants showed transpiration rate of 6.29 mmol m-2 s-1 with the
estimated dose of 425 mL plant-1 week-1. The transpiration rate
data obtained with the application of non-energized water at 100 DAT, as a function of biofertilizer doses, fitted to an
increasing linear model (Figure 4). The values of transpiration
rate varied from 5.59 to 6.93 mmol m-2 s-1.
The application of biofertilizer at different doses with evident increase in the application of organic matter and nutrients and daily irrigation interval may have caused improvement in soil and plant water conditions, leading to the maintenance of absorption of water and cell turgor, allowing gas exchanges between the plants and the environment (Taiz & Zeiger, 2009).
Silva et al. (2011) report that the beneficial effects of the application of bovine biofertilizer on transpiration are due to the stimulus to the action of proteins and organic solutes, resulting in better nutritional conditions in the soil and in the plants. Similar results were found by Freire et al. (2014), who
observed an increment of 97.7% in the transpiration rate of
yellow passion fruit under treatments with bovine biofertilizer and utilization of mulch. Sarmento et al. (2011), evaluating organic sources and times of incorporation in beet cultivation, observed that transpiration did not show significant variations as a function of the applied treatments.
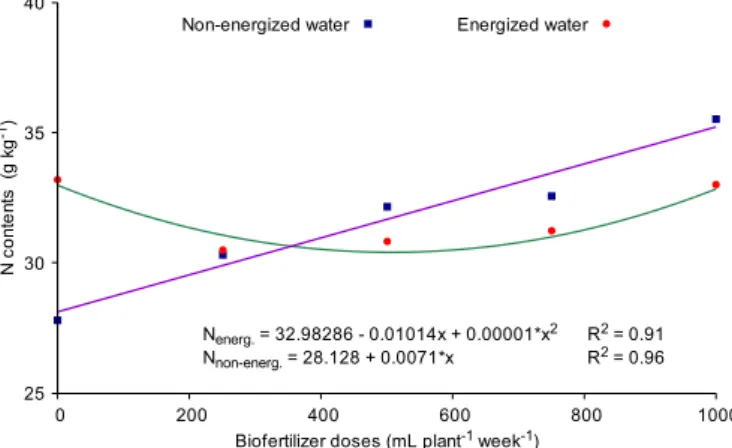
The significant interaction of Water energization x Biofertilizer doses for the N contents at 67 DAT is shown in Figure 5.
For irrigation with non-energized water, there was an increasing linear tendency for the values obtained in the period, as the biofertilizer doses increased. The highest biofertilizer dose caused the highest N content; however, when plants were irrigated with energized water, the N content fitted to a quadratic polynomial model, reaching the lowest value of
30.41 g kg-1 at the biofertilizer dose equivalent to 507 mL
plant-1 week-1.
The mean N contents in bell pepper leaves are within the range considered as adequate for the crop (Trani & Raij, 1996), except for the control treatment, irrigated with non-energized water, which showed N content of 27.78 g kg-1; the other
treatments showed variation from 30.33 to 35.53 g kg-1 of N.
Alves et al. (2009), evaluating the nutritional status of bell pepper (Capsicum annuum L.), observed N contents from
18.0 18.5 19.0 19.5 20.0 20.5 21.0 21.5
0 200 400 600 800 1000
N = 20.045714 + 0.005487x - 0.000007**x
R = 0.83
173DAT 2
2
Nc
on
te
nt
s(
gk
g
-1)
Biofertilizer doses (mL plant-1week )-1
Figure 3. Nitrogen (N) contents in leaves of bell pepper at 173 days after transplantation (DAT), as a function of different doses of biofertilizer
4.0 4.5 5.0 5.5 6.0 6.5 7.0 7.5
0 200 400 600 800 1000
Enão energ.= 5.6789 + 0.0011*x R = 0.832
Tr
ans
pi
rati
on
rate
(m
mo
lm
-2
s
-1)
Biofertilizer doses (mL plant-1week )-1
Non-energized water Energized water
Figure 4. Transpiration rate of bell pepper plants at 100 days after transplantation, as a function of irrigation with energized and non-energized water and doses of liquid biofertilizer
Figure 5. Nitrogen (N) contents in leaves of bell pepper at 67 days after transplantation, as a function of irrigation with energized and non-energized water and doses of liquid biofertilizer
25 30 35 40
0 200 400 600 800 1000
Nenerg.= 32.98286 - 0.01014x + 0.00001*x2 R = 0.912 Nnon-energ.= 28.128 + 0.0071*x R = 0.962
Nc
on
te
nt
s(
gk
g
-1)
Biofertilizer doses (mL plant-1week )-1
30.88 to 33.50 g kg-1, which are consistent with those found
in the present study. Cavalcante et al. (2010) and Duarte et al. (2010), working under field conditions, observed increase in N contents in okra and watermelon plants fertilized with goat, cattle and chicken manure as organic sources, respectively.
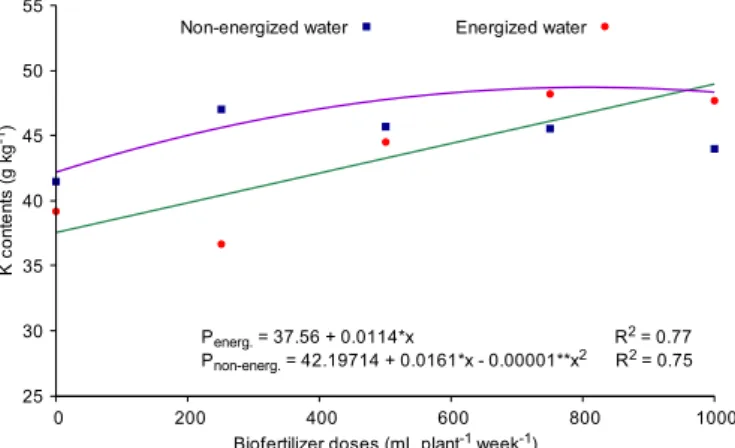
At 173 DAT, only K contents were influenced by the interaction of Water energization x Biofertilizer doses (Figure 6). The highest K content for non-energized water with the
increase in biofertilizer doses was equal to 48.59 g kg-1, obtained
at the dose of 800 mL plant-1 week-1. Considering the data for
energized water as a function of the applied biofertilizer doses, there was a linear fit and the highest K content was equal to
47.7 g kg-1 at the highest dose of biofertilizer.
As observed in the present study, Sedyiama et al. (2014)
evaluated the use of biofertilizers based on swine manure in colored pepper and found adequate values of nutrients in the leaves, thus indicating that the biofertilizer promoted adequate nutrition for the plants, probably because of its composition. These results differ from those obtained by
Oliveira et al. (2014), who analyzed the nutritional status and
characteristics related to the yield of pepper fruits in response to the application of liquid biofertilizers and observed that, except for calcium contents, the evaluated nutrients were below the range considered as adequate for the crop.
Assistat. Versão 7.5 Beta por Francisco de A. S. e Silva.
DEAG-CTRN-UFCG – Atualizado em 04/03/2011. Disponível em <http://www. assistat.com> 4 Mar. 2014.
Araújo, E. N.; Oliveira, A. P.; Cavalcante, L. F.; Pereira, W. E.; Brito, N. M.; Neves, C. M. L.; Silva, É. Produção do pimentão adubado com esterco bovino e biofertilizante. Revista Brasileira de
Engenharia Agrícola e Ambiental, v.11, p.466-470, 2007. http:// dx.doi.org/10.1590/S1415-43662007000500003
Borges, F. R. M.; Pinheiro Neto, L. G.; Viana, T. V. A.; Marinho, A. B.; Azevedo, B. M. Cultivation of yellow peppers using energized and non-energized waters and different doses of biofertilizers.
Revista Brasileira de Agricultura Irrigada, v.8, p.334-342, 2014. http://dx.doi.org/10.7127/rbai.v8n400183
Cavalcante, L. F.; Diniz, A. A.; Santos, L. C. F.; Rebequi, A. M.; Nunes, J. C.; Brehm, M. A. S. Teores foliares de macronutrientes em quiabeiro cultivado sob diferentes fontes e níveis de matéria orgânica. Semina: Ciências Agrárias, v.31, p.19-28, 2010. http://
dx.doi.org/10.5433/1679-0359.2010v31n1p19
Charlo, H. C. O; Castoldi, R.; Fernandes, C.; Vargas, P. F.; Braz, L. T.
Cultivo de híbridos de pimentão amarelo em fibra da casca de
coco. Horticultura Brasileira, v.27, p.155-159, 2009. http://dx.doi.
org/10.1590/S0102-05362009000200006
Duarte, A. K. A.; Cardoso, M. O.; Figueiredo, L. Crescimento e macronutrientes em mudas de melancia sob doses de adubo
orgânico no substrato. Horticultura Brasileira, v.28, p.1633-1638,
2010.
EMBRAPA - Empresa Brasileira de Pesquisa Agropecuária. Manual de métodos de análises de solo. 2. ed. Rio de Janeiro, Ministério da Agricultura e do Abastecimento, 1997. 212p.
EMBRAPA – Empresa Brasileira de Pesquisa Agropecuária. Centro Nacional e Pesquisa em Solos. Sistema Brasileiro de Classificação de Solos. Brasília: Embrapa SPI; Rio de Janeiro: Embrapa Solos, 2006. 306p.
EMBRAPA - Embrapa Solos. Manual de análises químicas de solos, plantas e fertilizantes. Brasília: Embrapa Informação Tecnológica; Brasília: Embrapa Solos, 2009. 627p.
Freire, J. L. O.; Dias, T. J.; Cavalcante, L. F.; Fernandes, P. D.; Lima Neto, A. J. Rendimento quântico e trocas gasosas em maracujazeiro amarelo sob salinidade hídrica, biofertilização e cobertura morta.
Revista Ciência Agronômica, v.45, p.82-91, 2014. http://dx.doi. org/10.1590/S1806-66902014000100011
Malavolta, E. Avaliação do estado nutricional das plantas: Princípios e aplicações. 2.ed. Piracicaba: Potafos, 1997. 319p.
Melo, W. B.; Oliveira, F. S.; Santos, J. G. R.; Arnaud, E. R.; Maracaja, P. B. Crescimento de plantas de milho e feijão adubadas com biofertilizantes líquidos em sistema de consorciação. Revista Verde de Agroecologia e Desenvolvimento Sustentável, v.8,
p.104-108, 2013.
Menezes Júnior, J. C.; Cavalcante, L. F.; Mesquita, E. F.; Campos, V. B.; Oliveira, A. D. Teores de micronutrientes nas folhas do mamoeiro e no solo tratado com biofertilizante bovino. Revista Verde de Agroecologia e Desenvolvimento Sustentável, v.3, p.56-63, 2008.
Menezes Júnior, J. C.; Mesquita, E. F.; Cavalcante, L. F. Teores foliares de macronutrientes em mamoeiro cultivado em solo adubado com
biofertilizante. Revista Magistra, v.26, p.169-177, 2014.
25 30 35 40 45 50 55
0 200 400 600 800 1000
Penerg.= 37.56 + 0.0114*x R = 0.772 Pnon-energ.= 42.19714 + 0.0161*x - 0.00001**x2 R = 0.752
Kc
on
te
nt
s(
gk
g
-1)
Biofertilizer doses (mL plant-1week )-1
Non-energized water Energized water
Figure 6. Potassium (K) contents in leaves of bell pepper at 173 days after transplantation, as a function of irrigation with energized and non-energized water and doses of liquid biofertilizer
Conclusions
1. Water energization allowed significant increase only in potassium contents.
2. The use of biofertilizer as the only source of fertilization was sufficient to provide the nutrients N, P and K at adequate levels for the bell pepper crop.
Literature Cited
Alves, G. S.; Santos, D.; Silva, J. A.; Nascimento, J. A. M.; Cavalcante, L. F.; Dantas, T. A. G. Estado nutricional do pimentão cultivado em solo tratado com diferentes tipos de biofertilizantes. Acta
Scientiarum, v.31, p.661-665, 2009. http://dx.doi.org/10.4025/ actasciagron.v31i4.731
Aquatron. Aquatron green machine. < http://slideplayer.com.br/
Oliveira, J. R.; Gomes, R. L. F.; Araújo, A. S. F.; Marini, F. S.; Lopes, J. B.; Araújo, R. M. Estado nutricional e produção da pimenteira com uso de biofertilizantes líquidos. Revista Brasileira de Engenharia
Agrícola e Ambiental, v.18, p.1241-1246, 2014. http://dx.doi. org/10.1590/1807-1929/agriambi.v18n12p1241-1246
Patil, N. M. Biofertilizer effect on growth, protein and carbohydrate content in stevia rebaudiana var bertoni. Recent Research in
Science and Technology, v.2, p.42-44, 2010.
Rodrigues, A. C.; Cavalcante, L. F.; Oliveira, A. P.; Sousa, J. T.; Mesquita, F. O. Produção e nutrição mineral do maracujazeiro-amarelo em solo com biofertilizante supermagro e potássio. Revista Brasileira
de Engenharia Agrícola e Ambiental, v.13, p.117-124, 2009. http:// dx.doi.org/10.1590/S1415-43662009000200002
Santoro, B. L.; Sato, L. M.; Brunhara, J. P. B.; Peres, J. G; Souza, C. F. Monitoramento da distribuição de uma solução no solo via fertirrigação por gotejamento. Revista Irriga, v.18, p.572-586, 2013. http://dx.doi.org/10.15809/irriga.2013v18n3p572
Sarmento, A. L. R.; Pereira, F. H. F.; Silva, M. C.; Medeiros, J. E.; Freire,
E. C. B. S. Fontes e tempo de incorporação de estercos no cultivo da beterraba. Revista Verde de Agroecologia e Desenvolvimento Sustentável, v.6, p.50-58, 2011.
Sediyama, M. A. N.; Santos, M. R.; Vidigal, S. M.; Pinto, C. L. de O.; Jacob, L. L. Nutrição e produtividade de plantas de pimentão colorido, adubadas com biofertilizante de suíno. Revista Brasileira
de Engenharia Agrícola e Ambiental, v.18, p.588-594, 2014. http:// dx.doi.org/10.1590/S1415-43662014000600004
Silva, F. de A. S. e; Azevedo, C. A. V. de. Versão do programa computacional Assistat para o sistema operacional Windows.
Revista Brasileira de Produtos Agroindustriais, v.4, p71-78, 2002. http://dx.doi.org/10.15871/1517-8595/rbpa.v4n1p71-78
Silva, F. L. B.; Lacerda, C. F. de; Sousa, G. G.; Neves, A. L. R.; Silva,
G. L.; Sousa, C. H. C. Interação entre salinidade e biofertilizante
bovino na cultura do feijão-de-corda. Revista Brasileira de Engenharia Agrícola e Ambiental, v.15, p.383-389, 2011. http://
dx.doi.org/10.1590/S1415-43662011000400009
Taiz, L.; Zeiger, E. Fisiologia vegetal. 4.ed. Porto Alegre: Artmed,
2009. 819p.
Trani, P. E.; Raij, B. van. Hortaliças. In: Instituto Agronômico de