EXPLORING CORTICAL BONE DENSITY THROUGH THE
ULTRASOUND INTEGRATED REFLECTION COEFFICIENT
DENSIDADE ÓSSEA CORTICAL ANALISADA PELO
COEFICIENTE DE REFLEXÃO ULTRASSÔNICA
D
anielP
attersonM
atusin1, a
lDoJ
oséF
ontes-P
ereira1, P
aulot
aDeuC
arDozor
ibeiror
osa1, t
hiagob
arboza2,3,
s
ergioa
ugustol
oPes Des
ouza2,3, M
arCoa
ntôniovonK
rüger1, W
agnerC
oelhoDea
lbuquerqueP
ereira11. Biomedical Engineering Program, Instituto Alberto Luiz Coimbra de Pós-Graduação e Pesquisa de Engenharia (COPPE), Universidade Federal do Rio de Janeiro (UFRJ), Rio de Janeiro, RJ, Brazil.
2. Laboratório de Marcação de Células e Moléculas (LMCM), Department of Radiology, School of Medicine, Universidade Federal do Rio de Janeiro (UFRJ), Rio de Janeiro, RJ, Brazil. 3. Laboratório microPET/SPECT/CT, Centro Nacional de Biologia Estrutural e Bioimagem (CENABIO), Universidade Federal do Rio de Janeiro (UFRJ), Rio de Janeiro, RJ, Brazil.
Citation: Matusin DP, Fontes-Pereira AJ, Rosa PTCR, Barboza T, Souza SAL, von Krüger MA, Pereira WCA. Exploring cortical bone density through the ultrasound integrated reflection coefficient. Acta Ortop Bras. [online]. 2018;26(4):255-9. Available from URL: http://www.scielo.br/aob.
Work conducted at the Laboratório de Ultrassom/Programa de Engenharia Biomédica [Ultrasound Laboratory/Biomedical Engineering Program]/Universidade Federal do Rio de Janeiro. Correspondence: Universidade Federal do Rio de Janeiro – UFRJ/Instituto Alberto Luiz Coimbra de Pós-Graduação e Pesquisa de Engenharia - COPPE/Programa de Engenharia Biomédica. Av. Horácio Macedo, 2030, Rio de Janeiro, RJ, Brazil; PO Box 68.510. 21941-914. patter.daniel@gmail.com
O
riginala
rticle DOI: http://dx.doi.org/10.1590/1413-785220182604177202All authors declare no potential conflict of interest related to this article.
Article received in 05/15/2017, approved in 05/21/2018.
ABSTRACT
Objective: This work evaluates the relationship between ul-trasonic reflection and bone density from fourteen cylindrical bovine cortical bone samples (3.0-cm thick). Methods: Twenty US reflection signals per sample were acquired along the bone surface (2.0-mm step). The Integrated Reflection Coefficient (IRC) from each signal was compared to Quantitative Com-puted Tomography (QCT). Results: Seven IRC and QCT curves presented Pearson’s Correlation R-values above 0.5. For weak correlation curves, QCT and IRC showed similar trends in several segments. Conclusion: IRC was sensitive to bone density varia-tion. Level of Evidence: Experimental Study, Investigating a Diagnostic Test.
Keywords: Ultrasonics. Cortical bone. Bone and Bones.
Tomog-raphy. Bone density.
RESUMO
Objetivo: Este estudo avalia a relação entre a reflexão ultrassônica e a densidade óssea de 14 amostras cilíndricas de osso cortical bovino (3,0 cm de espessura). Métodos: Foi realizada a aquisição de 20 sinais de reflexão ultrassônica por amostra (passo de 2,0 mm), ao longo da superfície óssea. O Coeficiente de Reflexão Integrado (IRC) de cada sinal foi comparado por Tomografia Com-putadorizada Quantitativa (QCT). Resultados: Sete curvas de IRC e QCT apresentaram valor de Correlação R de Pearson acima de 0,5. Para curvas de correlação fraca, QCT e IRC apresentaram tendências semelhantes em vários segmentos. Conclusão: O IRC foi sensível à variação da densidade óssea. Nível de evidência: Estudo Experimental, Investigação de Exame Diagnóstico.
Descritores: Ultrassom. Osso Cortical. Osso e ossos. Tomografia. Densidade Óssea.
INTRODUCTION
Aging, trauma and other biological conditions like or osteogenesis imperfecta, osteomalacia, bone metastasis and osteoporosis can affect bone physical properties. Among them, osteoporosis is the more common disease and is characterized by bone mass loss, affecting the microarchitecture of cortical and trabecular bone leading to increased susceptibility to fracture caused by low-impact trauma. Such injury may lead to disability, morbidity and mortality of individuals. From the health system point of view, it represents a financial cost as for instance, in USA, more than 2 million fractures were associated with osteoporosis in 2005 and it is estimated that the number of cases will increase up to 3 million in 2025.1 Densitometry is the gold standard for diagnosis of osteopenia, osteoporosis and bone tissue evaluation. Its advantages are the
relative low cost and low radiation exposure. The quantitative com-puted tomography (QCT), despite offering results that are more accurate, is more expensive and demands higher X-ray exposure. The criterion for human osteoporosis diagnosis is a bone loss of 25% or more than 2.5 standard deviations below the average of bone loss regarding age and sex.
relation to bone mechanical properties.4 Densitometry uses density to indirectly estimate bone fragility. Moreover, QUS can estimate different tissue parameters from its interaction with ultrasound,5 while bone densitometry estimates only a parameter related to X-ray attenuation. The cortical bone constitutes 80% of the skeleton, which is affected by osteoporosis6 and injuries, but its assessment by US is poorly ex-plored. Transmission-reception techniques, pulse-echo and B-mode images are valuable techniques for cortical bone assessment. Kotha et al.7 after analyzing ultrasound reflection signal, estimated the acoustic impedance of bovine cortical bone and correlated it with indicators of bone mechanical properties. Fontes-Pereira et al.8 presented the possibility to characterize femur diaphysis of rats in vivo by the ultrasonic pulse-echo method associated with wave reflection and backscattering.
The high density of cortical bone makes its US exploration notable by high reflections signals at interface bone/soft tissues. Exploring reflection properties can be useful in assessing the composition and characteristics of cortical bone, offering additional data for bone characterization.
The aim of this work was to evaluate the relation between ultrasonic reflection and the density of bovine cortical bone. The reflection was characterized by Integrated Reflection Coefficient (IRC) and compared to QCT values.
MATERIALS AND METHODS Bovine Samples
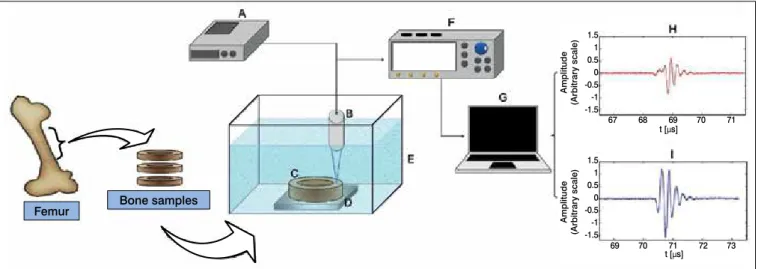
Three samples from ex vivo bovine cortical femoral bone extracted from five animals aging ranging from 2 to 3 years old. Each sample is a cross-sectional segment 3-cm thick kept at -16.5 ºC before the experiment. The sliced surface was divided in four quadrants to promote a signal acquisition distributed in all regions. QUS and QCT parameters were estimated for five points at each quadrant and compared each other (Figure 1).
Quantitative Computed Tomography acquisition
The QCT images obtained with 75 kVp and 145 mA, through a Triumph II microPET/SPECT/CT equipment (Trifoil imaging, Northridge, Chatsworth, CA, USA) were processed with Osirix software. Bone density (Hounsfield Units - HU) was estimated for
five non-overlapping 3 x 3 mm squared areas of each quadrant along the most superficial image layer of bone. The pulse-echo ultrasound signals were acquired in these same areas.
Experimental setup and US signal acquisition
A SR9000 pulse generator (Matec® Inc., Hopkinton, MA, USA) excited a US transducer (model V326, Olympus® NDT Inc., Waltham, MA, EUA) with 5 MHz nominal frequency, 9.5-mm diameter and 2.1-mm focus diameter. The transducer was immersed in 24.5°C degassed water tank pointing to the sample cross-section surface positioned at focal length of 70 mm.
The acquisition of five signals was made for each of the four marked areas using 2.0 mm step displacement of ultrasonic beam along the sample surface performing 20 signals per sample. A reference signal was collected from a polished steel reflector, positioned at the same focal distance.
The echo signals were acquired on an oscilloscope (model TDS 2024B, Tektronix® Inc., Beaverton, OR, USA) and further, transferred to a microcomputer to be processed by a program developed in Matlab® (MathWorks Inc., Natick, MA, USA) (Figure 2).
Measurement of ultrasound parameter
A Hamming window selected the steel echo from reference signal. The limits of the selected signal were defined by choosing the most distant points with 10% of peak value for each side. A window with the same dimension selected the reflection echo from the water/ bone interface for each sample.
The US parameter IRC – Integrated Reflection Coefficient were estimated from the RTF - Reflection Transfer Function (Equation 1).
10 10
10 log specimen( ) 10 log Preference( )
RTF= P f − f
where Pspecimen e Preference are power spectra of sample and reference signal, respectively.
Equation 2 estimates the IRC value for each signal:
where f low and f high are the inferior and superior frequency limits of bandwidth transducer at -6 dB of peak value. The IRC indicates the quantity of energy reflected from bone surface.
Statistical analysis
The Kolmogorov-Smirnov and equal variance tests were used to check normality. The statistic tests were implemented in SigmaStat 3.5 (Systat Software, Inc., San Jose, CA, USA). Pearson’s correla-tion coefficient was used to quantify the correlacorrela-tion between the parameter and density (HU) from QCT.
RESULTS
The Pearson’s Correlation (R) and p-values between IRC and QCT for each point are presented in Table 1. Figures 3 to 7 display examples of normalized curves with different correlation of IRC and QCT to show the behavior of values.
High R-values indicate high correlation between US parameters with QCT values. It has high correlation for IRC parameter at seven of 14 bones.
DISCUSSION
The use of commercial bovine bones has the advantage of low cost and easy acquisition from animals with rigorous food and health administration, regular age and gender. Bovine bones allow the investigation of US parameters in bones with dimensions, shape Figure 1. QCT image with the four quadrants division. Square windows
are the regions of US signal acquisition. QCT mean values (HU) were estimated for the same regions.
,
and composition similar to humans. A thicker tissue sample ensures transducer alignment with the region of interest of the sample, which is difficult with other smaller animals like rats or rabbits.
QUS parameters often characterize properties such as the speed of sound propagation, attenuation and backscatter. The high-density characteristic of cortical bone causes a high reflectivity and very few scattering, compared to trabecular bone.9 The setup for the param-eters estimation is very similar to those used on backscattering.10 Many QUS studies in bone tissue characterization made parameters estimation by the average value of many signals for a tissue area or volume, but bone is a heterogeneous material with a great differ-ence between nearby areas. Its variation depends on anatomy and modifications caused by nutrition and mechanical forces exerted on tissue, like compressive stresses and pulls tendon insertions that promote the osteons density and organization. The density variation produces a large range of values for both parameters. For QCT, the mean value was 3098.6 ± 356 HU and for IRC was -5.43 ± 3.31 dB. All R-values were positive values what indicates a trend of increasing IRC value as bone density increases, which is consistent with theory,11 since the higher the bone density is, the higher should be the reflection. Pearson correlation coefficients between IRC and QCT values (Table 1) were positive for all samples, and seven of fourteen samples have R > 0.5, designating strong correlation (p < 0.05).
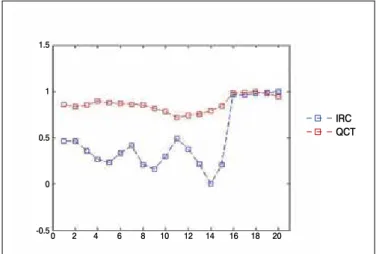
Figure 3. Twenty values of IRC and QCT from sample 1A (normalized scale). This sample presented the higher R-value: 0.86.
Figure 4. Twenty values of IRC and QCT from sample 2B (normalized scale). Figure show the similarity of plateaus formation on samples every five points according to signal acquisition characteristics. R-value of 0.63. Figure 2. Experimental setup for US signal acquisition. A - Pulse generator; B – US transducer; C – cylindrical disc sample of bovine bone; D – Polished steel reflector; E – Acoustic tank; F – Oscilloscope; G – Microcomputer; H - cortical bone ultrasound signal; I - reference steel plate signal.
Table 1. R and p-values of Pearson correlation values between IRC and bone density from QCT, point to point for each bone samples of each animal.
Animal Sample Pearson
R p
1
A 0.86 0.000001
B 0.14 0.561
C 0.51 0.02
2
A 0.33 0.153
B 0.63 0.003
C 0.02 0.929
3
A 0.76 0.0001
B 0.74 0.0001
C 0.38 0.097
4
A 0.60 0.005
B 0.01 0.974
C 0.63 0.002
5
A 0.19 0.415
C 0.48 0.031
Femur Bone samples
Amplitude
(Arbitrary scale)
1.5 1 0.5 0 -0.5 -1 -1.5
1.5 1 0.5 0 -0.5 -1 -1.5
67 68 69 70 71
69 70 71 72 73
1.5
1
0.5
0
-0.5
1.5
1
0.5
0
-0.5
t [µs]
t [µs]
Amplitude
(Arbitrary scale)
IRC QCT
IRC QCT
0 2 4 6 8 10 12 14 16 18 20
Figures 3, 4, and 5 display high correlated curves.12 While QCT curves show a smooth fluctuation of values, IRC presents stronger variations, but always reasonably following the tendency of QCT. In Figures 3 and 4, plateau formations are notable after an abrupt change occurring every five points. This change occurs probably because signal acquisition jumps to another quadrant of bone. IRC seems to distinguish these jumps as well as the flat areas caused by signals from close sites.
It is visually recognizable, even at samples with weak correlation, the few oscillations at QCT values reproduced by IRC values, principally between signals acquired in sites close to each other. When considering the quadrants individually, the same tendency on values of QCT and IRC is seen at many segments as shown in Figures 6 and 7. Probably the low R-values in both figures are caused by the great shift of values between quadrants. The cause of this shift is still not clear.
For the first fifteen values in Figure 5, there is a stronger oscillation of IRC as compared to QCT values. For the last five points (denser region), both curves have a similar behavior. The study of other material properties aspects may help elucidate this higher floatability of IRC values. For instance, an interesting investigation could be the relation of porosity and decalcification (by the use of EDTA) associated with transducer frequency and beam shape variations.
The density and diameter of Haversian system (called osteons) in bovine bones are similar to humans. A particularity of bovine cortical bone is the great quantity of plexiform bone found in large mammals, but rare in humans.13 The plexiform bone presents a plate aspect, similar lamellar structure, denser blood plexus and an array of osteons in longitudinal, radial and circumferential directions.14 The signals acqui-sition made centrally on the cross-section surface of bone minimized the influence of plexiform bone, mostly localized in the periosteum. The Haversian canals in the bone samples have axial orientation. The osteons orientation is important for bone anisotropy, especially for in vivo applications.
Sasso et al.6 found anisotropy evidence for the values of Broadband Ultrasound Attenuation in bovine bones when the signals were collected axial, transverse and tangentially to the bone structure. Trebacz and Gadwa15 have also detected anisotropic properties in cortical and trabecular bone, this time with the parameters prop-agation speed and attenuation.
In our study the US propagation was chosen to be along and not across the bone axis.
The advantage of this approach adopted to validate the reflection parameters is to avoid the external surface of the bone. The surface shape is usually convex and the effect of convexity is determined by the relationship between the radius of curvature of the bone region of interest and the diameter of the ultrasonic beam at the distance between sample and transducer. Reflection is proportional to the radius of curvature and, in the case of bone, varies according to the examined site. The signal acquisition taken from a plain cut surface in the present study was design to avoid the effect of bone surface curvature. Moreover, techniques can be developed to compensate the cur-vature effects, as Lakshmanan et al.16 used a rotational stage to study the reflection of a cylindrical shaped bone.
Our study intents to contribute to the development of non-invasive and low-cost methods to evaluate local bone density. We have specially investigated the relationship between bone density and ultrasound reflection of flat surface cortical bone.
Our results indicate that the reflection parameter IRC was sensible to healthy bone density variation and presented strong to moderate values correlated to QCT for the majority of the samples. So, it is worth to continue to explore its potential applicability to evaluate and monitor conditions that affect bone surface mineral density. Figure 5. Twenty values of IRC and QCT from sample 3A (normalized
scale). IRC values have a fluctuation for the first 15 points and grow when the density is higher on last five points. R-value of 0.76.
Figure 6. Twenty values of IRC and QCT from sample 1B (normalized scale). The curves present a weak correlation (R-value 0.14). It is possible observe a shift on IRC values that happen in between the sequences of five points obtained at each quadrant.
Figure 7. Twenty values of IRC and QCT from sample 4B (normalized scale). Even with weak correlation (R = 0.01), values present similar curves between five points sequences, from 6 to 10 and 11 to 15, when the signal acquisition is closer.
IRC QCT
IRC QCT
IRC QCT
0 2 4 6 8 10 12 14 16 18 20
0 2 4 6 8 10 12 14 16 18 20
0 2 4 6 8 10 12 14 16 18 20 1.5
1
0.5
0
-0.5
1.5
1
0.5
0
-0.5
1.5
1
0.5
0
CONCLUSION
The proposed protocol and Integrated Reflection Coefficient (IRC) calculated demonstrated the IRC was sensible to bone density variation.
ACKNOWLEDGMENTS
This work was supported by the CNPq under Grant [number 308.627/2013-0]; CAPES/PROEX under Grant [number 3485/2014]; and FAPERJ under Grant [number E-26/203.041/2015].
REFERENCES
1. Burge R, Dawson-Hughes B, Solomon DH, Wong JB, King A, Tosteson A. Incidence and economic burden of osteoporosis-related fractures in the United States, 2005–2025. J Bone Miner Res. 2007;22(3):465–75.
2. Guglielmi G, Scalzo G, de Terlizzi F, Peh WCG. Quantitative ultrasound in osteopo-rosis and bone metabolism pathologies. Radiol Clin North Am. 2010;48(3):577–88. 3. Laugier P. Instrumentation for in vivo ultrasonic characterization of bone strength.
IEEE Trans Ultrason Ferroelectr Freq Control. 2008;55(6):1179–96.
4. Hakulinen MA, Töyräs J, Saarakkala S, Hirvonen J, Kröger H, Jurvelin JS. Ability of ultrasound backscattering to predict mechanical properties of bovine trabecular bone. Ultrasound Med Biol. 2004;30(7):919–27.
5. Flöter M, Bittar CK, Zabeu JL, Carneiro AC. Review of comparative studies between bone densitometry and quantitative ultrasound of the calcaneus in osteoporosis. Acta Reumatol Port. 2011;36(4):327–35.
6. Sasso M, Haïat G, Yamato Y, Naili S, Matsukawa M. Dependence of ultrasonic attenuation on bone mass and microstructure in bovine cortical bone. J Biomech. 2008;41(2):347–55.
7. Kotha SP, DePaula CA, Mann AB, Guzelsu N. High Frequency Ultrasound Prediction of Mechanical Properties of Cortical Bone with Varying Amount of Mineral Content. Ultrasound Med Biol. 2008;34(4):630–7.
8. Fontes-Pereira A, Matusin DP, Rosa P, Schanaider A, von Krüger MA, Pereira WC. Ultrasound method applied to characterize healthy femoral diaphysis of
Wistar rats in vivo. Braz J Med Biol Res. 2014;47(5):403–10.
9. Pinton G, Aubry JF, Bossy E, Muller M, Pernot M, Tanter M. Attenuation, scattering, and absorption of ultrasound in the skull bone. Med Phys. 2012;39(1):299–307.
10. Hoffmeister BK, Johnson DP, Janeski JA, Keedy DA, Steinert BW, Viano AM, et al. Ultrasonic characterization of human cancellous bone in vitro using three different apparent backscatter parameters in the frequency range 0.6-15.0 mhz. IEEE Trans Ultrason Ferroelectr Freq Control. 2008;55(7):1442–52. 11. Abu-Zidan FM, Hefny AF, Corr P. Clinical ultrasound physics. J Emerg Trauma
Shock. 2011;4(4):501–3.
12. Rodgers JL, Nicewander WA. Thirteen Ways to Look at the Correlation Coefficient. Am Stat. 1988;42(1):59–66.
13. Locke M. Structure of long bones in mammals. J Morphol. 2004;262(2):546–65. 14. Hillier ML, Bell LS. Differentiating Human Bone from Animal Bone: A Review of
Histological Methods. J Forensic Sci. 2007;52(2):249–63.
15. Trębacz H, Gawda H. The estimation of structural anisotropy of trabecular and cortical bone tissues based on ultrasonic velocity and attenuation. Acta Bioeng Biomech. 2001;3(2):41–8.
16. Lakshmanan S, Bodi A, Raum K. Assessment of anisotropic tissue elasticity of cortical bone from high-resolution, angular acoustic measurements. IEEE Trans Ultrason Ferroelectr Freq Control. 2007;54(8):1560–70.