480
Original Articles
Quality of life of elderly persons in Manaus measured by the
Flanagan Scale
Esmeraldino Monteiro de Figueiredo Neto1
José Eduardo Corrente²
1 Universidade Federal do Amazonas, Faculdade de Educação Física e Fisioterapia. Manaus, Amazonas, Brasil.
² Universidade Estadual Paulista, Instituto de Biociências, Departamento de Bioestatística. Botucatu, São Paulo, Brasil.
Correspondence
Esmeraldino Monteiro de Figueiredo Neto [email protected]
Abstract
Objective: the aim of the present study was to evaluate the quality of life of elderly people enrolled in specialized elderly care centers in Manaus and compare the findings with the results of already published studies. Method: a cross-sectional study was conducted with 741 elderly people enrolled in three of the centers in the city, from November 2015 to March 2017 using a socioeconomic and demographic questionnaire and the Flanagan Quality of Life Scale (FQLS). Interviews were carried out by previously trained physiotherapy students of the Federal University of Amazonas. Results: the majority of the elderly were female, with a mean age of 69±6.6 years, married, retired but still working, with a low income and low educational level. When they assessed their quality of life, however, they appeared satisfied. When compared to populations in other countries and regions of Brazil, despite their low socioeconomic profile, they demonstrated a higher quality of life than populations of developed countries. Some domains of the scale were inverted in relation to the original scale. Conclusion: the results allow us to conclude that even elderly persons with low socioeconomic status are satisfied with their quality of life.
481
INTRODUCTION
Population aging is a worldwide phenomenon, especially in developing countries. The World Health Organization (WHO) predicts that by 2025, elderly persons will number approximately 1.2 billion, with those aged 80 or over the fastest growing group. In Brazil, the elderly represent 14.3% of the population, with this proportion varying in different regions. The north and northeast regions have fewer elderly persons than other regions. In the state of Amazonas, however, the elderly population has grown 3.5% in ten years, surpassing the growth of adults and children. In Manaus, the elderly population has grown tenfold in the last 40 years3.
The changes and wear caused by the aging process in the body can lead to a decline in the health condition of the elderly and their quality of life, forcing them to seek health services more frequently, especially those linked to the Unified Health System (SUS)4.
The concept of quality of life is related to self-esteem and personal well-being and covers a series of aspects such as functional capacity, socioeconomic level, emotional state, social interaction, intellectual activity, self-care, health status, cultural, ethical and religious values, lifestyle, satisfaction with one’s employment and/or daily activities and the environment in which one lives5.
The Amazon region possesses a socio-cultural, economic, ethnic and macro-environmental diversity, resulting in the need for epidemiological studies on elderly persons living in these areas. This idea is further supported by the multifactorial and complex nature of the phenomenon of aging, which makes it difficult for all the variables that affect this phenomenon and the etiology of age-related diseases to be investigated at the same time, in a similar way, throughout the world6. In addition, the collection of information relating to the elderly receiving care through the SUS is extremely important, as it allows an understanding of aging among individuals living in the community. The objective of the present study was to evaluate the quality of life of elderly persons attending Integrated Care Centers for the Elderly (CAIMIs) in the city of Manaus.
METHOD
An epidemiological, cross-sectional, descriptive study was performed with elderly people registered at CAIMIs in the city of Manaus, in the state of Amazonas. These centers are intended for the outpatient care of the elderly, with three units distributed in the main areas of the city providing care for more than 75,000 registered elderly persons. The sample was selected for convenience, and was performed after a sample calculation. Individuals of both genders, aged 60 years and older, and registered at the health centers were included. Data collection was performed from November 2015 to March 2017 by five students of the physiotherapy course of the Universidade Federal do Amazonas, who received previous training in all the questionnaires used.
The sample was calculated based on an unknown prevalence of 50% for quality of life, with a 95% confidence level and 5% confidence interval, resulting in a minimum of 384 individuals. A correction factor was applied for the population. The inclusion criteria were: aged 60 years or over and registered with one of the three CAIMI units. As an exclusion criterion, elderly persons without the sufficient cognitive level to answer the questions of the questionnaires were excluded.
Data collection was carried out in a structured interview format, with the application of a socioeconomic questionnaire to obtain information regarding age, gender, schooling, income, marital status, retirement and work; and the Flanagan Quality of Life Scale (FQLS), translated and validated7,8,9,10.
482
value is not reported, but in the study by Burckhardt et al. an alpha value of 0.82 to 0.92 was found, while in a test and re-test study, values varied from 0.78 to 0.84. In the present study, the alpha value obtained was 0.81, which is within the expected values for the validity of the instrument.
The 15 FQLS questions assess: 1) material well-being: home, food, financial situation; 2) health: physically fit and vigorous; 3) relationship with parents, siblings and other relatives: communicating, visiting and helping; 4) establishing a family: having and raising children; 5) close relationship with spouse, partner or significant other; 6) close friends: sharing interests, activities and opinions; 7) voluntarily helping and supporting other people; 8) participation in associations and activities of public interest; 9) learning: attending other courses for general knowledge; 10) self-knowledge: recognizing potential and limitations; 11) work (job or home): interesting, rewarding, worthwhile activity; 12) creative communication; 13) participation in active recreation; 14) listening to music, watching television or movies, reading or other such activity; 15) socializing: "making friends". A value of 1 to 7 was applied to each question, which corresponds respectively to: terrible; unhappy; mostly dissatisfied; mixed; mostly satisfied, pleased, delighted.
All the information collected was tabulated in a database distributed in spreadsheets. A descriptive analysis of the data was performed and, for the analysis of quality of life, factor analysis was performed with varimax rotation to obtain the domains defined by the scale. The Kaiser-Meyer-Olkin coefficient (KMO) was used to verify the factorization of the sample data. The KMO value was 0.843, indicating that the factor analysis is appropriate. The criterion for determining the factors was based on the scale. In the original study, five factors were proposed and, to verify the dimensions, the data were analyzed in this context. The factor loading value is shown in table 2 for each item. Varimax rotation was used as it was an orthogonal rotation and provided a better visualization of the factors.
The study was approved by the Research Ethics Committee of the Universidade Federal do Amazonas
under number 786.685/2014, and complied with Resolution 466/12 of the National Health Council for Research with Human Beings, of the Department of Health.
RESULTS
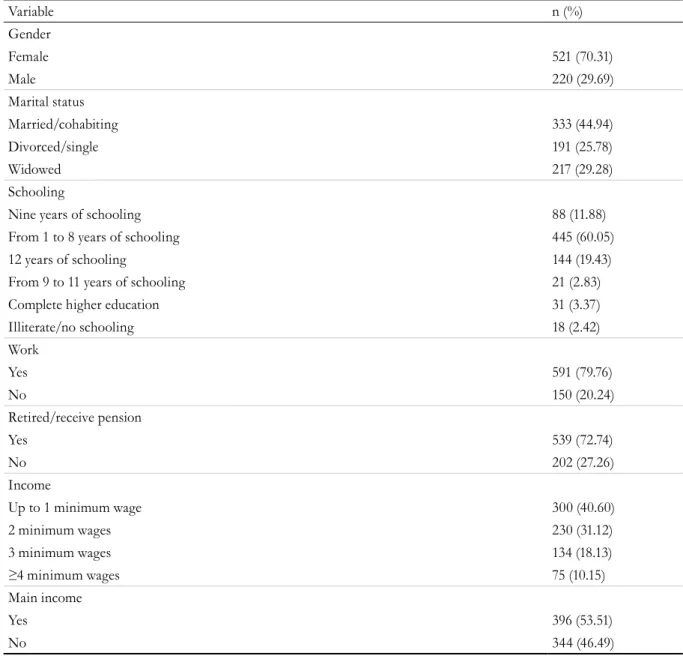
A total of 741 elderly people aged 60 years and over were evaluated in the three CAIMI in the city of Manaus. The mean age was 69 (±6.6) years (60 to 102 years), the female gender was more prevalent (70.31%), 44.94% of those sampled were married or had a partner, 60.05% had not completed elementary school, and only 31 had completed the third grade. Although there was a predominance of retirees (72.74%), 79.76% still worked, 40.60% earned one minimum wage and 3.52% received over four times the minimum wage (Table 1).
The mean of the scores obtained in the FQLS was 80.07, with a minimum of 30 and a maximum of 105. The Cronbach α score was 0.8098, which confirms the good consistency of the instrument in response to the question of quality of life of the elderly.
Table 2 shows the descriptive analysis of the factor analysis obtained as the valid model, with the limit of 0.5 used as the cut-off point for the formation of factors. In this case, only 13 of the 15 items made up the factors. Two items presented a factor loading lower than the limit. This indicates that these items may not be important in the composition of the factor. According to the original article, each factor is expected to consist of three items, but this did not occur in the present study. The final result therefore considers only one item in the last factor.
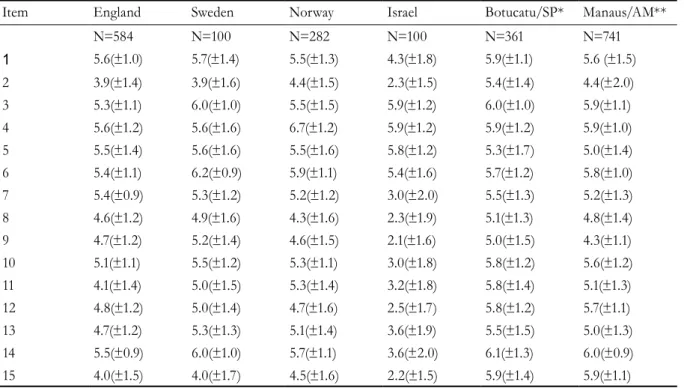
Table 3 shows a comparison with other studies, using the means and standard deviation of each scale item.
483
to be continued
Table 1. Socioeconomic characteristics of elderly persons registered with CAIMI. Manaus, Amazonas, 2017.
Variable n (%)
Gender
Female 521 (70.31)
Male 220 (29.69)
Marital status
Married/cohabiting 333 (44.94)
Divorced/single 191 (25.78)
Widowed 217 (29.28)
Schooling
Nine years of schooling 88 (11.88)
From 1 to 8 years of schooling 445 (60.05)
12 years of schooling 144 (19.43)
From 9 to 11 years of schooling 21 (2.83)
Complete higher education 31 (3.37)
Illiterate/no schooling 18 (2.42)
Work
Yes 591 (79.76)
No 150 (20.24)
Retired/receive pension
Yes 539 (72.74)
No 202 (27.26)
Income
Up to 1 minimum wage 300 (40.60)
2 minimum wages 230 (31.12)
3 minimum wages 134 (18.13)
≥4 minimum wages 75 (10.15)
Main income
Yes 396 (53.51)
No 344 (46.49)
Minimum wage at time of study: beginning of study – R$788.00 (2015); end (2017) – R$937.00.
Table 2. Demonstration of the application of factor analysis and identification of the components that influenced the level of satisfaction with quality of life of the elderly in Manaus, Amazonas, 2017.
Flanagan Scale Factor loading
Factor 1: Relationship with other persons (variance explained: 29%)
Item 4: relationship with parents, siblings and other relatives. 0.77995 Item 3: establishing a family: having and raising children. 0.75332 Item 5: intimate relationship with spouse, partner or significant other. 0.55015 Item 6: close friends: sharing interests, activities and opinions. 0.51911
Factor 2: Recreation (explained variance: 11%)
Item 12: creative communication 0.76407
Item 10: self-knowledge: recognizing potential and limitations 0.73199
Item 13: participation in active recreation 0.65341
484
Continuation of Table 2
Table 3. Comparison of mean and standard deviation of the original FQLS version, three validated versions, the Botucatu-SP version and the version of the present study. Manaus, Amazonas, 2017.
Item England Sweden Norway Israel Botucatu/SP* Manaus/AM**
N=584 N=100 N=282 N=100 N=361 N=741
1 5.6(±1.0) 5.7(±1.4) 5.5(±1.3) 4.3(±1.8) 5.9(±1.1) 5.6 (±1.5) 2 3.9(±1.4) 3.9(±1.6) 4.4(±1.5) 2.3(±1.5) 5.4(±1.4) 4.4(±2.0) 3 5.3(±1.1) 6.0(±1.0) 5.5(±1.5) 5.9(±1.2) 6.0(±1.0) 5.9(±1.1) 4 5.6(±1.2) 5.6(±1.6) 6.7(±1.2) 5.9(±1.2) 5.9(±1.2) 5.9(±1.0) 5 5.5(±1.4) 5.6(±1.6) 5.5(±1.6) 5.8(±1.2) 5.3(±1.7) 5.0(±1.4) 6 5.4(±1.1) 6.2(±0.9) 5.9(±1.1) 5.4(±1.6) 5.7(±1.2) 5.8(±1.0) 7 5.4(±0.9) 5.3(±1.2) 5.2(±1.2) 3.0(±2.0) 5.5(±1.3) 5.2(±1.3) 8 4.6(±1.2) 4.9(±1.6) 4.3(±1.6) 2.3(±1.9) 5.1(±1.3) 4.8(±1.4) 9 4.7(±1.2) 5.2(±1.4) 4.6(±1.5) 2.1(±1.6) 5.0(±1.5) 4.3(±1.1) 10 5.1(±1.1) 5.5(±1.2) 5.3(±1.1) 3.0(±1.8) 5.8(±1.2) 5.6(±1.2) 11 4.1(±1.4) 5.0(±1.5) 5.3(±1.4) 3.2(±1.8) 5.8(±1.4) 5.1(±1.3) 12 4.8(±1.2) 5.0(±1.4) 4.7(±1.6) 2.5(±1.7) 5.8(±1.2) 5.7(±1.1) 13 4.7(±1.2) 5.3(±1.3) 5.1(±1.4) 3.6(±1.9) 5.5(±1.5) 5.0(±1.3) 14 5.5(±0.9) 6.0(±1.0) 5.7(±1.1) 3.6(±2.0) 6.1(±1.3) 6.0(±0.9) 15 4.0(±1.5) 4.0(±1.7) 4.5(±1.6) 2.2(±1.5) 5.9(±1.4) 5.9(±1.1)
*São Paulo; **Amazonas.
Table 4. Comparison of FQLS dimensions and those identified in the sample. Manaus, Amazonas, 2017.
Dimensions of FQLS* Dimensions identified in present study
Physical and material well-being Relationship with other people Relationship with other people Recreation
Social, community and civic activities Social, community and civic activities Personal development and achievement Physical and material well-being
Recreation Personal development and achievement
*FQLS = Flanagan Quality of Life Scale
Flanagan Scale Factor loading
Factor 3: Community and civic activities (explained variance: 7%)
Item 7: Voluntarily help and support other people 0.79922
Item 11: Work (job or at home) 0.71616
Factor 4: Physical and material wellbeing (explained variance: 7%)
Item 2: Health: physically fit and vigorous 0.80317
Item 1: Material comfort: home, food and financial situation 0.60219
Factor 5: Personal development (explained variance: 6%)
485
DISCUSSION
The number of studies that evaluate quality of life in different populations, including the elderly, has increased in recent times. The improvement of measurements, through the use of several types of questionnaires, and the identification of factors associated with quality of life, have been the focus of this type of study. As it is a subjective issue, the components responsible for a better or worse quality of life are not the same for all populations. Individual and cultural aspects should be taken into account at the time of evaluation.
The mean age of the subjects of the present study was 69 years and 70.31% of the sample was female, which confirms the trend of studies of the elderly11-14. However, because our sample was selected for convenience, there is a selective bias, which may explain the high percentage of women. It has been reported in several studies15,16,17, however, that women tend to worry about and care for their health more than men, seeking out health services, whether private or public, resulting in many diseases being treated in their early stages, which is one of the factors responsible for the high rate of women who reach senior citizen age. In Brazil, women live, on average, eight years longer than men, in addition to being more concerned with their well-being in general, when compared to elderly men18.
The results of the present study agree with several other studies in terms of schooling, marital status, and income11,12,19,20. The majority of the elderly in the sample did not complete elementary school, and the proportion of people with low educational levels increases with age. This may be due to the fact that the elderly persons of the sample, especially older individuals, did not have the culture or the opportunity to study for long when they were children, especially as adolescents, as they married and started a family very early in life, and had to start working while still very young21. According to the National Household Sample Survey (PNAD) 201622, the average number of years of study of the working elderly is 5.7 years. The majority are retired, an outcome found in the studies cited above. However, most of the elderly persons in the present study were still working, a finding which contradicts other studies11,14. This may be due to the city of Manaus having a higher
cost of living than the cities of previous studies, which causes elderly persons to seek other ways to supplement their income, as most earn up to one minimum wage. This fact can also be explained by the fact that the majority of the individuals are the breadwinners of their family, and that due to the current economic situation in Brazil, the elderly are returning to the labor market to supplement their pensions, as many of the adults and young people in families are unemployed. This figure is confirmed by the PNAD 2016, which found an increase in the proportion of employed elderly people.
A high average score in the Flanagan scale was observed, showing that the population of the present study has a good quality of life. Thirteen out of the 15 scale items exhibited satisfactory factor loading. When the averages obtained in each item of the scale were compared, the population of the present study had several items with higher values than those observed among populations of developed countries, which have a higher income than this sample. However, for the elderly in the present study, the factor of income does not seem to be responsible for having a good quality of life. The last item of the scale, which refers to socialization - "making friends", both the population of the present study and that of Botucatu, São Paulo, obtained higher scores than those of other countries, which may suggest that Brazilian elderly persons are more sociable.
486
civic activities are more important than physical and material well-being and personal development and achievement. The results of the present study also differed from a study performed in the city of Avaré, São Paulo11. In this study, physical and material well-being was the first domain and recreation was the last, corroborating the results obtained by Flanagan7.
Santoset al.23 analyzed the quality of life of the elderly using the same scale as the present study, and identified divergences in terms of the dimensions of the concept of quality of life proposed by Flanagan7. When evaluating 128 elderly people from the city of João Pessoa, Paraíba, they concluded that, for this population, personal development and achievement is the most important domain in determining quality of life. In their research, items 7 and 14 (7= voluntarily helping and supporting other people; 14= listening to music, watching television or movies, reading or other activities) had little influence and were discarded, as they did not obtain a factor loading within the established limit. In the present study, the highest averages were in items 14 and 15 (14= listening to music, watching television or movies, reading or other activities; 15 = socializing: "making friends"), which relate to the domain of recreation, which came first in our review. The lowest averages were in items 9 and 2. Item 9 evaluates learning, such as attending courses for general knowledge. These different results in the scale responses influenced the order of the dimensions, explaining the differences between the populations.
As a whole, the data of the present study are consistent with those obtained in other studies carried out with populations from other countries, as shown in Table 3. When comparing the results obtained with the FQLS for an English population, the present study identified a higher average in 11 of the 15 criteria evaluated. With Swedish and Norwegian population, only six and seven averages, respectively, were higher in the present study than in those populations. However, while the averages of the present study were not as disparate as in those studies, Brazilian elderly persons, both in Botucatu and Manaus, had a better final score than the populations from other countries, with only Israel well below the score obtained by the other studies.
It can be said, therefore, that elderly persons, even from different countries, with different habits and cultures, are for the most part alike, even though they do not share similar socioeconomic characteristics. Quality of life must be understood as an active concept, which can be constructed and interpreted from the dialectical relations of the individual, and can present equivalences, contradictions and differences between individuals.
One of the limitations of this study was in relation to the sample, in which, because of convenience, the majority were women and had low levels of education and income. Additional samples, including larger proportions of men and people from different socioeconomic classes, are needed to provide additional evidence for these populations. In addition, quality of life studies of the elderly population using the same questionnaire are difficult to find.
CONCLUSION
Based on the data found, it can be said that the perspective of the quality of life and well-being of the elderly enrolled in the Integrated Care Centers for the Elderly in the city of Manaus is good. The majority of the elderly persons studied were women, married, with low levels of schooling and income, but with a good quality of life when evaluated by the Flanagan Quality of Life Scale. When compared to populations from developed countries using the same scale, the elderly in the present study have a better satisfaction with quality of life. The results suggest that demographic and socioeconomic aspects, although not favorable, had little influence on satisfaction with quality of life when evaluated by the Flanagan Quality of Life Scale.
487
REFERENCES
1. Ran L, Jiang X, Li B, Kong H, Du M, Wang X, et al. Association among activities of daily living, instrumental activities of daily living and health-related quality of life in elderly Yi ethnic minority. BMC Geriatr. 2017;17:1-17.
2. Miranda GMD, Mendes ACG, Silva ALA. Envelhecimento populacional brasileiro: desafios e consequências sociais e futuras. Rev Bras Geriatr Gerontol. 2016;19(3):507-19.
3. Instituto Brasileiro de Geografia e Estatística. Estatísticas da saúde: assistência médico-sanitária. Rio de Janeiro: IBGE; 2010.
4. Pilger C, Menon MU, Mathias TAF. Utilização de serviços de saúde por idosos vivendo na comunidade. Rev Esc Enferm USP. 2013;47(1):213-20.
5. Vecchia RD, Ruiz T, Bocchi SCM, Corrente JE. Qualidade de vida na terceira idade: um conceito subjetivo. Rev Bras Epidemiol. 2005;8(3):246-52.
6. Ribeiro E, Veras RP, Viegas K, Caldas C, Ribeiro E, Rocha M, et al. Projeto Idoso da floresta: indicadores de saúde dos idosos inseridos na Estratégia de saúde da família (ESF-SUS) de Manaus-AM. Brasil. Rev Bras Geriatr Gerontol. 2008;11(3):307-26.
7. Flanagan JC. Changes in school levels of achie-vement: Project TALENT ten and fifteen year retests. Educ Res. 1976;5(8):9-12.
8. Flanagan JC. Measurement of quality of life: current state of the art. Arch Phys Med Rehabil. 1982;63(2):56-9.
9. Hashimoto H, Guedes SL, Pereira VC. O Ostomizado e a qualidade de vida: abordagem fundamentada nas dimensões da qualidade de vida proposta por Flanagan [Monografia de especialização]. São Paulo: Universidade de São Paulo, Escola de Enfermagem; 1996.
10. Burckhardt CS, Anderson KL, Archenholtz B, Hägg O. The Flanagan quality of life scale: evidence of construct validity. Health Qual Life Outcomes. 2003:1-7.
11. Kagawa CA, Corrente JE. Análise da capacidade funcional em idosos do município de Avaré-SP: fatores associados. Rev Bras Geriatr Gerontol. 2015;18(3):577-86.
12. Chaves AS, Santos AM, Alves MTSB, Salgado Filho N. Associação entre o declínio cognitivo e qualidade de vida de idosos hipertensos. Rev Bras Geriatr Gerontol. 2015;18(3):545-56.
13. Linden Junior E, Trindade JLA. Avaliação da qualidade de vida de idosos em um município do Sul do Brasil. Rev Bras Geriatr Gerontol. 2013;16(3):473-9.
14. Marques LP, Schneider IJC, D´Orsi E. Quality of life and its association with work, the Internet, participation in groups and physical activity among the elderly from the EpiFloripa survey, Florianópolis, Santa Catarina State, Brazil. Cad Saúde Pública. 2016;32(12):1-14.
15. Silva SPC, Menandro MCS. As representações sociais da saúde e de seus cuidados para homens e mulheres idosos. Saúde Soc. 2014;23(2):626-40.
16. Brito AKOL, Silva EM, Feitosa NLS, Almeida AFV, Pessoa RMC. Motivos da ausência do homem às consultas na atenção básica: uma revisão integrativa. Rev Ciênc Saberes. 2016;2(2):191-5.
17. Cavalcanti JRD, Ferreira JA, Henriques AHB, Morais GSN, Trigueiro JVS, Torquato IMB. Integral assistance to men´s health: needs, barries and coping strategies. Esc Anna Nery. 2014;18(4):628-34.
18. Araujo LF, Coutinho MPL, Carvalho VAML. Representações sociais da velhice entre idosos que participam de grupos de convivência. Psicol Ciênc Prof. 2005;25(1):118-31.
19. Amaral TLM, Amaral CA, Prado PR, Lima NS, Herculano PV, Monteiro GTR. Qualidade de vida e morbidades associadas em idosos cadastrados na Estratégia de Saúde da Família do município Senador Guiomard, Acre. Rev Bras Geriatr Gerontol. 2015;18(4):797-808.
20. Pereira DS, Nogueira JAD, Silva CAB. Qualidade de vida e situação de saúde de idosos: um estudo de base populacional no Sertão Central do Ceará. Rev Bras Geriatr Gerontol. 2015;18(4):893-908.
21. Ferraro AR. Escolarização no Brasil: articulando as perspectivas de gênero, raça e classe social. Educ Pesqui. 2010;36(2):502-26.
22. Instituto Brasileiro de Geografia e Estatística. Pesquisa Nacional por Amostra de Domicílios Contínua - PNAD 4° trimestre de 2016. Rio de Janeiro: IBGE; 2017.
23. Santos SR, Santos IBC, Fernandes MGM, Henriques MER. Qualidade de vida do idoso na comunidade: aplicação da Escala de Flanagan. Rev Latinoam Enferm. 2002;10(6):757-64.