buildings
ArticleNumerical Simulation of the Application of Solar
Radiant Systems, Internal Airflow and Occupants’
Presence in the Improvement of Comfort in
Winter Conditions
Eusébio Z. E. Conceição * and Ma¯Manuela J. R. Lúcio
Faculty of Sciences and Technology (FCT), University of Algarve, Campus de Gambelas, 8005-139 Faro, Portugal; [email protected]
* Correspondence: [email protected]; Tel.: +351-289-800900; Fax: +351-289-800066 Academic Editor: Christopher Underwood
Received: 7 July 2016; Accepted: 26 August 2016; Published: 16 September 2016
Abstract:In this work, the use of numerical simulation in the application of solar radiant systems, internal airflow and occupants’ presence in the improvement of comfort in winter conditions is made. The thermal comfort, the local thermal discomfort and the air quality in an occupied chamber space are evaluated. In the experimental measurements, a wood chamber, a desk, two seats, two seated hygro-thermal manikins, a warm radiant floor, a solar radiation simulator and a water solar collector are used. The air velocity and the air temperature fluctuation are experimentally evaluated around 15 human body sections. The chamber surface temperature is experimentally measured. In the numerical simulation, a coupling human thermal comfort (HTC) integral model, a computational fluids dynamics (CFD) differential model and a building thermal response (BTR) integral model are applied. The human thermal comfort level is evaluated by the HTC numerical model. The airflow inside the virtual chamber, using the k-epsilon and RNG turbulence models, is evaluated by the CFD numerical model. The chamber surface and the collector temperatures are evaluated by the BTR numerical model. In the human thermal comfort level, in non-uniform environments, the predicted mean vote (PMV) and the predicted percentage of dissatisfied (PPD) people are numerically evaluated; in the local thermal discomfort level the draught risk (DR) is experimentally and numerically analyzed; and in the air quality, the carbon dioxide CO2 concentration is numerically calculated. In the validation tests, the experimental and numerical values of the chamber surface temperature, the air temperature, the air velocity, the air turbulence intensity and the DR are presented.
Keywords: solar radiation; thermal comfort; local thermal discomfort; indoor air; numerical simulations; experimental tests; coupling integral and differential models
1. Introduction
Thermal comfort, local thermal discomfort and air quality in a chamber equipped with forced ventilation, promoted by an air forced system, and a warm floor, promoted by a solar water collector system, are evaluated in the study presented in this work. In the study conducted in winter conditions and inside a chamber space, experimental and numerical methodologies are used.
The idea of the study presented in this work is to develop and apply numerical software, based on coupling two integral and one differential models, in order to study systems combined by forced ventilation (when the inlet and outlet are placed above the head level in non-parallel walls) and a warm radiant floor (with water recirculation located in the floor level). In the forced ventilation, the external air from the outdoor environment is used, while in the warm radiant floor, hot water from a solar collector is used. The combination of the two systems, in addition to the occupants’ presence, is
Buildings 2016, 6, 38 2 of 20
used to promote simultaneously acceptable thermal comfort, local thermal discomfort and air quality, with a low energy consumption level.
In the study presented in this work, numerical and experimental methodologies’ combinations are used. In the numerical study, the human thermal comfort (HTC) integral model, the computational fluids dynamics (CFD) differential model and the building thermal response (BTR) integral model are used. The HTC numerical model approach is used to evaluate the mean radiant temperature (MRT), the thermal comfort level, the skin temperature, the clothes temperature and the transpiration field, in non-uniform environments. In the thermal comfort level, the predicted mean vote (PMV) and the predicted percentage of dissatisfied (PPD) people are used. The CFD numerical model approach is used to evaluate the air velocity, the air temperature and the carbon dioxide (CO2) concentration field, around the occupant and inside the chamber space. The BTR numerical model evaluated the transparent surfaces’ temperatures, opaque surfaces’ temperatures, internal air temperatures, solar collectors’ temperatures and duct water temperature. In the experimental methodology, the air velocity and the air temperature fluctuation around the 15 human body sections (used to evaluate the local thermal discomfort level and to validate the numerical values) and the surrounding chamber surface temperature are measured.
The coupling of integral models and differential models, in some applications, was made, as the example in [1–3]. In personalized ventilation systems [1], the coupling of the CFD numerical model and the human body thermoregulation numerical model is used; in the heat exchanges between a seated person in a uniform environment [2], the coupling of the convection, radiation, moisture transport and human thermal physiology is used; and in the human thermal sensation [3], the coupling of the convection, radiation and thermoregulation is used.
Different philosophies of ventilation inside confined spaces were studied. In these studies, experimental techniques, numerical techniques or combinations of numerical and experimental techniques are used. Some examples of studies made in this area can be seen in [4–10]. In both studies, as is verified in the study presented in this paper, the cross-ventilation is analyzed in detail.
In accord with the HTC and CFD numerical models, the study presented in this work is a continuation of [11–15].
In [11], the thermal comfort and the local thermal discomfort levels that an occupant is subjected to for a non-uniform airflow, using a k-epsilon turbulence model, were evaluated. The thermal comfort level was evaluated through the HTC numerical model, while the local thermal discomfort level was evaluated through an empirical model. The input of the HTC numerical model was obtained experimentally using a thermal manikin, which simulates the human posture, subjected to a common use ventilator.
In [12], the local thermal discomfort, the thermal comfort, the air quality and the acoustical comfort levels in a classroom equipped with cross-ventilation are evaluated, using a k-epsilon turbulence model. In the local thermal discomfort level, the empirical model also was used.
In [13], the CFD numerical model was used to evaluate air velocity and the air renovation rate in an experimental chamber, in moderate environments, in steady-state conditions and isothermal conditions, using a k-epsilon turbulence model. The air velocity fluctuations were measured, while the air velocity root mean square, the air turbulence intensity the draught risks, the air velocity fluctuation frequencies and the air velocity fluctuation equivalent frequencies were calculated. The experimental and numerical results, which show good agreement, were used to evaluate the thermal comfort, local thermal discomfort and air quality levels.
In [14], an HTC numerical model was used to evaluate the thermal comfort and the local thermal discomfort that an occupant is subjected to, simulated with a thermal manikin, a personalized ventilated system equipped in a desk, located inside an experimental chamber, with upper and lower air terminal devices, for a slightly warm environment. In this study, the input data of the HTC numerical model are obtained numerically.
Buildings 2016, 6, 38 3 of 20
In [15], a CFD and a HTC numerical model were used to evaluate the thermal comfort, local thermal discomfort and air quality levels that an occupant is subjected to in desks equipped with a personalized ventilation systems, with two upper and lower air terminal devices, in slightly warm environments. The validation tests, in a steady-state regime and non-isothermal conditions, using a k-epsilon turbulence model, showed good agreement.
However, the study presented in this paper is also the continuation of the BTR numerical model presented in [16–18].
In [16], the BTR and the HTC numerical model are used in order to evaluate the building and the occupant’s thermal response. In this work, which evaluated the thermal comfort level, the output of the BTR numerical model is used as the input in the HTC numerical model.
In [17], the BTR numerical model was applied in a school building with a complex topology. The numerical model was used to evaluate the thermal comfort and the indoor air quality on a summer day, in transient conditions. The numerical model, using numerical and experimental values, was validated with success, in summer conditions.
In [18], the BTR numerical model was applied in the evaluation of thermal comfort and air quality in a school building, with a complex topology, for winter conditions.
In the evaluation of the thermal comfort level, the PMV and the PPD indexes are used (see [19–21]). These indexes are functions of the values of four environmental variables (the air temperature, the air velocity, the air relative humidity and the MRT) and two personal parameters (the clothing level and the activity level).
The non-uniform environments are promoted by surrounding surfaces’ temperatures, air temperatures and air velocity asymmetries. In the thermal comfort level, an HTC numerical model is used. Application examples can be seen in [11,14,15], and validations tests can be seen in [11], for example.
The local thermal discomfort conditions are evaluated using the draught risk (DR) index. The DR, which depends on the local air temperature, the local air velocity and the local air turbulence intensity, was developed in [22]. The DR is used in different studies, for example, in [23,24]. In [23,24], studies about the evaluation of the internal airflow, namely, the local discomfort level associated with the draught risks, are presented.
Finally, in order to evaluate the indoor air quality in the study presented in this work, the CO2 concentration, evaluated by the CFD numerical model, is used as an indicator of the indoor air quality. The CO2concentration, used in this work, is released by the occupants. In this work, the recommendations of [25,26] are used. Some examples of the application of CO2concentration can be seen, for example, in [27–30]. In [27], a study of CO2dispersion in an auditorium is developed, and in [28], a work of indoor air quality in school buildings is presented; while in [29], the CO2 concentration in the airflow pattern in a residential building is used, and in [30], the CO2concentration is used in the evaluation of the outdoor air ventilation rates.
In the validation phase, using a comparison between numerical values and experimental data, the accuracy value (see, for example, [31]) is used. This accuracy value, which is associated with the correctness of the numerical values, is associated with the numerically-calculated approaches’ level to the experimentally-measured value. As for the best accuracy, the value is unity, for a good accuracy, the value should be near unity.
The combination of numerical test and experimental test, done in this work, are made in a steady-state regimen and in non-isothermal conditions. These tests are used to evaluate the comfort level (the thermal comfort level, the local thermal discomfort level and the air quality level), in a chamber equipped with forced ventilation (when the inlet and outlet are placed above the head level in non-parallel walls), with a warm radiant floor and occupied by two seated occupants.
In this study, the numerical values, using a coupling of the HTC, CFD and BTR numerical models, are used to evaluate the thermal comfort, the local thermal discomfort and the air quality levels, while the experimental results are used to compare with the numerical values (chamber surfaces
Buildings 2016, 6, 38 4 of 20
temperatures, air velocity, air temperature, air turbulence intensity and DR levels) and to evaluate the local thermal discomfort level.
2. Numerical Model
The coupling of the HTC integral numerical model, the CFD differential numerical model and the BTR integral numerical model are used in this work. The HTC integral numerical model approach is used to evaluate the thermal comfort level, the human body temperature, the clothing temperature and the water vapor fields; the CFD differential numerical model approach is used not only to evaluate the airflow around the occupants (air temperature, air velocity, air turbulence intensity and DR), but also the air quality level (using the CO2concentration); while the BTR integral numerical model approach is used to evaluate the transparent surfaces’ temperatures, opaque surfaces’ temperatures, internal air temperatures, solar collectors’ temperatures and duct water temperature.
The environmental variables, calculated around the occupants by the CFD numerical model, are used as input data in the HTC numerical model. The human body temperature and clothing surfaces’ temperature, surrounding temperatures (room surfaces and desk surface) and the inlet airflow conditions (air velocity, air temperature and air turbulence intensity) are used as boundary conditions in the CFD numerical model in the evaluation of the environmental variables’ field around the occupant and the air quality level in the respiration area. The internal environmental variables, calculated around the occupants by the CFD numerical model, and the external temperature are used as input data in the BTR numerical model.
In the numerical simulation, using the HTC numerical model, the CFD numerical model and the BTR numerical model, an iterative method is used:
• In the first step, the BTR numerical model calculated the chamber surrounding temperatures, using the external and internal environment conditions;
• In the second step, the human thermal comfort numerical model calculated the body and clothing temperatures, using the chamber surrounding temperatures and occupant surrounding environments variables;
• In the third step, the CFD numerical model, using the previous values (skin, clothing and chamber temperatures), calculated the airflow around the occupants.
In the modeling philosophy, using an iterative method, the numerical methods stop the calculations when convergence is guaranteed.
2.1. Human Thermal Comfort Numerical Model
This model, which runs in transient conditions, is based on energy and mass balance integral equations (see [11,14,15]).
The energy balance integral equations, in the HTC numerical model, are developed for the body tissue layers, the clothing layers and the arterial and venous blood. The mass balance integral equations, in the HTC numerical model, are developed for the arterial and venous blood, skin water vapor and the clothing water vapor.
In the resolution of the equation system, the Runge–Kutta–Fehlberg method with error control is used; in the thermal-regulatory system, the model in [32] is used; and in the thermal comfort in non-uniform environment conditions’ evaluation, using the predicted mean vote and the predicted percentage of dissatisfied people indexes, developed by [19], a modified PMV model presented in [33] is used.
The outputs of the HTC numerical model, presented in this work, are the following:
• Body (tissue temperature);
• Blood (arterial and venous temperature); • Skin (water vapor);
Buildings 2016, 6, 38 5 of 20
• Clothing (layers’ temperature); • Clothing (layers’ water vapor);
• Thermal comfort level (PMV and PPD indexes).
The inputs of the HTC numerical model are the following:
• Surrounding air temperature and velocity (calculated by the CFD numerical model); • Air relative humidity;
• Surrounding surface (walls, floor, window, door, roof and desk temperatures), calculated by the BTR numerical model;
• Internal sources (computers and others);
• Occupants (height, weight, activity level and clothing level).
2.2. Computational Fluid Dynamics Numerical Model
The CFD numerical model (see [13]), in Cartesian coordinates, is developed (based on [34]) and used. The numerical model simulates the three-dimensional turbulent airflow, in the steady-state regimen and in non-isothermal conditions, inside an occupied space. In the turbulence simulation, the k-epsilon and the RNG models are applied, and in the air velocity numerical values, a correction presented in [35] is used.
This software, in a steady-state regimen using the k-epsilon turbulence model, was validated in isothermal (see [13]) and in non-isothermal (see [15]) conditions. The RNG turbulence model, in a steady-state regimen and in isothermal conditions, is validated in the study presented in this work.
The outputs of the CFD numerical model, presented in this work, are the following:
• Three-dimensional components of air velocity; • Omnidirectional air velocity;
• Air temperature; • Air pressure;
• Turbulent kinetic energy;
• Turbulent energy dissipation rate; • Carbon dioxide concentration; • Local thermal discomfort level; • Air quality level.
The inputs of the CFD numerical model are the following:
• Surrounding surfaces variables (windows, walls, ceiling, floor and desk temperature), calculated by the BTR numerical model;
• Occupants’ presence (human and clothing temperature), calculated by the HTC numerical model); • Occupants’ respiration (carbon dioxide concentration release);
• Inlet air flow (air velocity, carbon dioxide concentration, air temperature and turbulence intensity).
2.3. Building Thermal Response Numerical Model
The BTR numerical model, which runs in transient conditions, is based on energy and mass balance integral equations (see [16–18]) and solar collector empirical equations.
The energy balance integral equations, presented in this work, are developed for the transparent surfaces’ temperatures (windows), opaque surfaces’ temperatures (walls, ceiling and floor), internal air temperatures, solar collectors’ temperatures and duct water temperature, in the experimental chamber. The mass balance integral equations are developed for the water circulation in the solar collector, duct system and floor water.
Buildings 2016, 6, 38 6 of 20
In the resolution of the equation system, the Runge–Kutta–Fehlberg method with error control is used.
The outputs of the BTR numerical model, presented in this work, are the following: • Walls (indoor, central and outdoor layers’ temperature);
• Floor (wood, cement, water and isolation layers’ temperature); • Windows (glass temperature);
• Door (indoor, central and outdoor layers’ temperature); • Roof (indoor, central and outdoor layers’ temperature); • Desk (indoor body);
• Solar collector (outlet water temperature);
• Solar collector ducts (inlet water and duct temperature). The inputs of the BTR numerical model are the following: • Collector solar radiation (incident solar radiation);
• External conditions (air temperature and air relative humidity); • Occupants (height, weight, activity level and clothing level).
3. Experimental Setup
In this work, one wooden experimental chamber (of 2.7×2.4×2.4 m3) equipped with one desk, two seats, two seated hygro-thermal manikins, a warm radiant floor, a solar radiation simulator, a water solar collector and two indoor climate analyzers are used in the experimental setup. In the radiant floor, a solar radiation simulator and a water solar collector are used (see more details in Figure1).
Buildings 2016, 6, 38 7 of 20
In this numerical work, the virtual occupants had 1.70 m of height, 70 kg of weight, 1.2 Met of activity level and 1 Clo of clothing level (equal to the experimental manikins). In the HTC numerical model, the MRT is numerically calculated (see Figure 1b); the air relative humidity is experimentally measured; while the air temperature and air velocity around the occupants are calculated by the CFD numerical model. Several grid geometries in the CFD numerical model were tested. Several volume dimensions with different refined increments were evaluated, using the k‐epsilon and RNG turbulence models, without and with occupants’ presence. In the refined grid, the compromises between the validation tests and the computational processing time were considered. In the validation tests, experimental data and numerical results were compared, and in the computational processing time, the total time of simulation was considered.
In [13], some validations tests were made, for different grid geometries, in steady‐state conditions and isothermal conditions, without occupant presence, using a k‐epsilon turbulence model, while in [15], some validations tests were made, for different grid geometries, in steady‐state conditions and non‐isothermal conditions, with occupant presence, using also a k‐epsilon turbulence model.
In accordance with the previous validations tests and computational processing time, for the CFD numerical model simulation, using the k‐epsilon and RNG turbulence models, the calculated values are made with 48 × 56 × 48 grids: 5.45 cm in the X direction, 5.2 cm in the Y direction and 5.45 cm in the Z direction (see Figure 1c). The grid is numerically refined when it is placed near a surface and in front of the inlet and in the inlet. In this study, each grid is divided into several units in a direction perpendicular to the surface (wall, ceiling, floor, desk, seat and manikin), and each grid is also divided into several units in parallel directions to the inlet and outlet. (a) (b) (c)
Figure 1.(a) Chamber, water ducts and collector scheme used in the building thermal response (BTR) numerical model; (b) occupants, interior bodies and chamber schemes used in the human thermal comfort (HTC) numerical model; (c) occupants, interior bodies and plans located at Y = 110 cm (Y22), Y = 170 cm (Y34), X = 130 cm (X23) and Z = 120 cm (Z23), used by the CFD numerical model in the work.
Buildings 2016, 6, 38 7 of 20
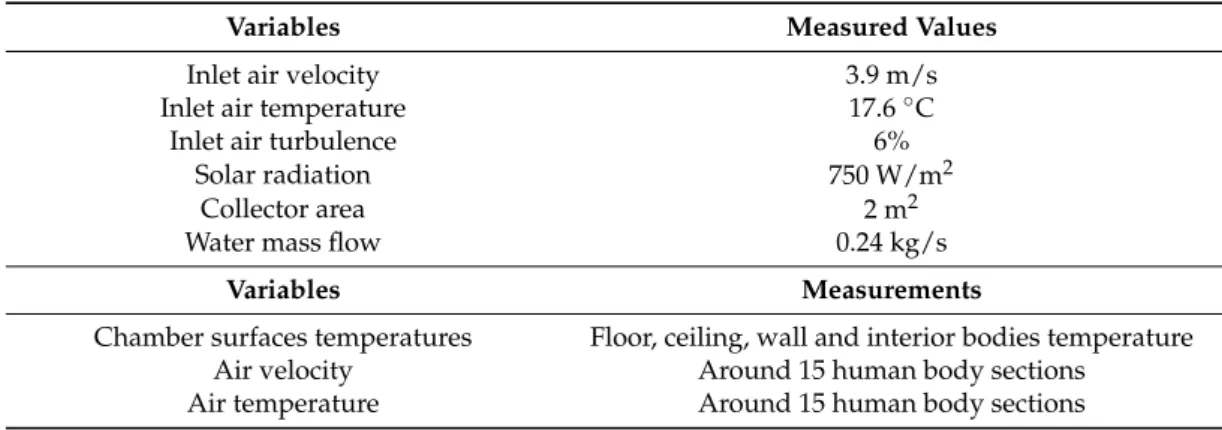
Table 1.Inlet model variables obtained in the experimental tests and used in the numerical tests.
Variables Measured Values
Inlet air velocity 3.9 m/s
Inlet air temperature 17.6◦C
Inlet air turbulence 6%
Solar radiation 750 W/m2
Collector area 2 m2
Water mass flow 0.24 kg/s
Variables Measurements
Chamber surfaces temperatures Floor, ceiling, wall and interior bodies temperature
Air velocity Around 15 human body sections
Air temperature Around 15 human body sections
Two hygro-thermal manikins, able to simulate the occupant’s body posture and the latent and sensible heat exchanges, are used to simulate the occupants’ posture in the chamber space environments (see more details in [14,15]). The environmental measurements made around the occupants are used to validate the numerical models.
The experimental tests are made in a steady-state regimen and with non-isothermal conditions. In order to obtain steady-state conditions all systems, namely the solar radiation, water collector, warm radiant floor, forced ventilation and hygro-thermal manikins, work during several hours. When the steady-state conditions are obtained, the environmental variables’ measurements are made.
The indoor climate analyzers MICKROMEK (using environmental sensors from SENSOR), multi-data logger with 8 inputs are used. The air temperatures and air velocities surrounding the manikins were measured around 15 human body sections of the two manikins.
The indoor climate analyzer BABUC-A (using sensors from LSI), multi-data logger with 11 inputs, is used to measure the chamber surrounding surfaces and the environmental variables inside the experimental chamber, namely the air relative humidity and the surrounding surfaces’ temperatures.
In Table1, the inlet model conditions obtained in the experimental tests and used in the numerical tests are presented.
4. Numerical Methodology
In this section, the surrounding chamber surfaces (floor, walls, ceiling, collector and water ducts), the occupants’ posture and the desk shape are defined (see Figure1).
In the buildings thermal response (see Figure1a), the floor, walls, ceiling, collector and water ducts are introduced. The floor is made of wood (in contact with the interior space) and concrete, including water pipes and isolation materials.
In this numerical work, the virtual occupants had 1.70 m of height, 70 kg of weight, 1.2 Met of activity level and 1 Clo of clothing level (equal to the experimental manikins). In the HTC numerical model, the MRT is numerically calculated (see Figure1b); the air relative humidity is experimentally measured; while the air temperature and air velocity around the occupants are calculated by the CFD numerical model.
Several grid geometries in the CFD numerical model were tested. Several volume dimensions with different refined increments were evaluated, using the k-epsilon and RNG turbulence models, without and with occupants’ presence. In the refined grid, the compromises between the validation tests and the computational processing time were considered. In the validation tests, experimental data and numerical results were compared, and in the computational processing time, the total time of simulation was considered.
In [13], some validations tests were made, for different grid geometries, in steady-state conditions and isothermal conditions, without occupant presence, using a k-epsilon turbulence model, while
Buildings 2016, 6, 38 8 of 20
in [15], some validations tests were made, for different grid geometries, in steady-state conditions and non-isothermal conditions, with occupant presence, using also a k-epsilon turbulence model.
In accordance with the previous validations tests and computational processing time, for the CFD numerical model simulation, using the k-epsilon and RNG turbulence models, the calculated values are made with 48×56×48 grids: 5.45 cm in the X direction, 5.2 cm in the Y direction and 5.45 cm in the Z direction (see Figure1c). The grid is numerically refined when it is placed near a surface and in front of the inlet and in the inlet. In this study, each grid is divided into several units in a direction perpendicular to the surface (wall, ceiling, floor, desk, seat and manikin), and each grid is also divided into several units in parallel directions to the inlet and outlet.
5. Results and Discussion
In this study, the chamber thermal response, airflow inside the chamber space, the thermal comfort level, the local thermal discomfort level and the air quality level are evaluated:
• in the first section, the surrounding chamber surfaces’ temperatures are analyzed;
• in the second section, the air velocity and the air temperature field inside the space are analyzed; • in the third section, the air velocity, the air temperature, the MRT and the thermal comfort level
are presented;
• in the fourth section, the air turbulence intensity and the DR are discussed; • in the fourth section, the CO2concentration is shown.
5.1. Chamber Surrounding Temperatures
In the first section, the measured and calculated surrounding chamber temperatures are presented. The obtained results are calculated by the BTR numerical model.
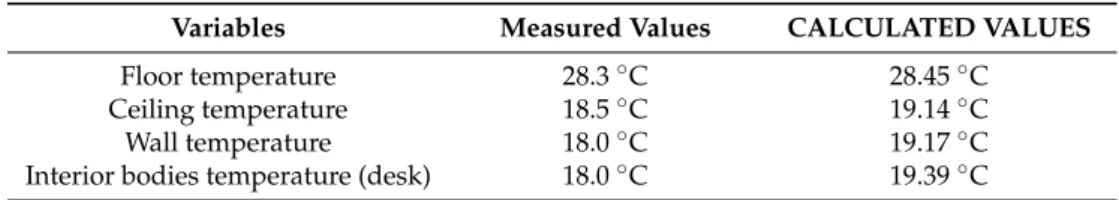
In Table 2, the comparisons between the measured and calculated surrounding chamber temperatures are presented.
Table 2.Measured and calculated surrounding chamber temperatures.
Variables Measured Values CALCULATED VALUES
Floor temperature 28.3◦C 28.45◦C
Ceiling temperature 18.5◦C 19.14◦C
Wall temperature 18.0◦C 19.17◦C
Interior bodies temperature (desk) 18.0◦C 19.39◦C
In accordance with the obtained results, the floor surface temperature presents a difference between the numerical and the experimental values of less than 0.15◦C, while the other internal surfaces temperature present a difference between the numerical and the experimental values around 1 ◦C.
The surrounding chamber temperatures’ mean accuracy, based on the measured and calculated values, is 0.987 [31].
5.2. Air Flow inside the Chamber Space
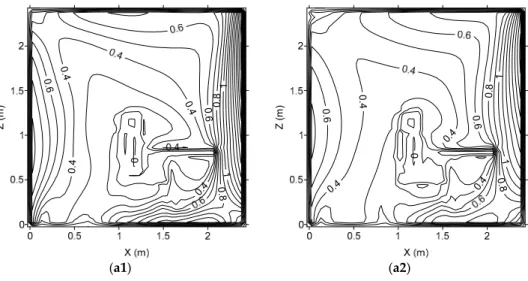
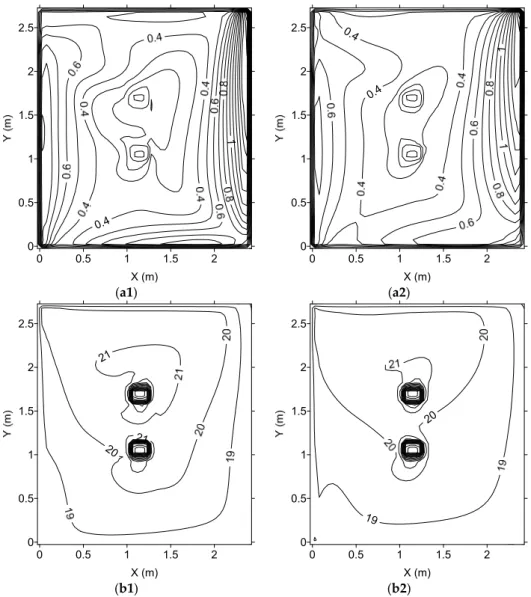
From Figures2–5, the air velocity and the air temperature field inside the school space section are presented. In Figures2–4, the vertical plans are presented, while in Figure5, the horizontal plan (in the respiration area) is shown. All subfigures (a1,a2) in Figures2–5represent the air velocity field, while (b1,b2) represent the air temperature field; (a1,b1) are associated with the k-epsilon turbulence model, and (a2,b2) are associated with the RNG turbulence model.
Buildings 2016, 6, 38 9 of 20 Buildings 2016, 6, 38 9 of 20
(a1) (a2)
(b1) (b2) Figure 2. Air velocity (a1,a2) and air temperature (b1,b2) fields in the plan located at Y = 110 cm (Y22) (right side seated occupant), numerically calculated. (a1,b1) are associated with the k‐epsilon turbulence model, and (a2,b2) are associated with the RNG turbulence model. (a1) (a2) 0.4 0.4 0.4 0.4 0.8 19 19 20 19 19 0 0.4 0.4 0.4 0. 4 0.6 0.6 0.8 0. 8 1 1 Z ( m ) 0 0.4 0.4 0 .4 0.4 0.6 0.6 0.8 0.8 1 1 Z ( m )
Figure 2. Air velocity (a1,a2) and air temperature (b1,b2) fields in the plan located at Y = 110 cm (Y22) (right side seated occupant), numerically calculated. (a1,b1) are associated with the k-epsilon turbulence model, and (a2,b2) are associated with the RNG turbulence model.
Buildings 2016, 6, 38 9 of 20
(a1) (a2)
(b1) (b2) Figure 2. Air velocity (a1,a2) and air temperature (b1,b2) fields in the plan located at Y = 110 cm (Y22) (right side seated occupant), numerically calculated. (a1,b1) are associated with the k‐epsilon turbulence model, and (a2,b2) are associated with the RNG turbulence model. (a1) (a2) 0.4 0.4 0.4 0.4 0.8 19 19 20 19 19 0 0.4 0.4 0.4 0. 4 0.6 0.6 0.8 0. 8 1 1 Z ( m ) 0 0.4 0.4 0 .4 0.4 0.6 0.6 0.8 0.8 1 1 Z ( m ) Figure 3. Cont.
Buildings 2016, 6, 38 10 of 20
Buildings 2016, 6, 38 10 of 20
(b1) (b2)
Figure 3. Air velocity (a1,a2) and air temperature (b1,b2) fields in the plan located at Y = 170 cm (Y34) (left side seated occupant), numerically calculated. (a1,b1) are associated with the k‐epsilon turbulence model, and (a2,b2) are associated with the RNG turbulence model. (a1) (a2) (b1) (b2) Figure 4. Air velocity (a1,a2) and air temperature (b1,b2) fields in the plan located at X = 130 cm (X23), numerically calculated. (a1,b1) are associated with the k‐epsilon turbulence model, and (a2,b2) are associated with the RNG turbulence model. 19 19 19 19 1 9 19 20 20 20 20 20 20 20 21 21 21 21 26 31 0 0.5 1 1.5 2 X (m) 0 0.5 1 1.5 2 Z (m) 19 19 19 19 1 9 19 20 20 20 20 20 2 0 21 2 1 21 21 21 2 631 0 0.5 1 1.5 2 X (m) 0 0.5 1 1.5 2 Z ( m ) 0 0 0.4 0.4 0.4 0.4 0.4 0.6 0.6 0.6 0.8 0.8 1 1 0 0.5 1 1.5 2 2.5 Y (m) 0 0.5 1 1.5 2 Z ( m ) 0 0 0.4 0.4 0.4 0.4 0.4 0.6 0.6 0.60.811.5 0 0.5 1 1.5 2 2.5 Y (m) 0 0.5 1 1.5 2 Z ( m ) 19 19 19 19 19 20 20 20 20 20 21 21 21 2631 2631 0 0.5 1 1.5 2 2.5 Y (m) 0 0.5 1 1.5 2 Z ( m ) 19 19 19 19 19 20 20 20 20 20 20 21 21 21 2631 2631 0 0.5 1 1.5 2 2.5 Y (m) 0 0.5 1 1.5 2 Z ( m )
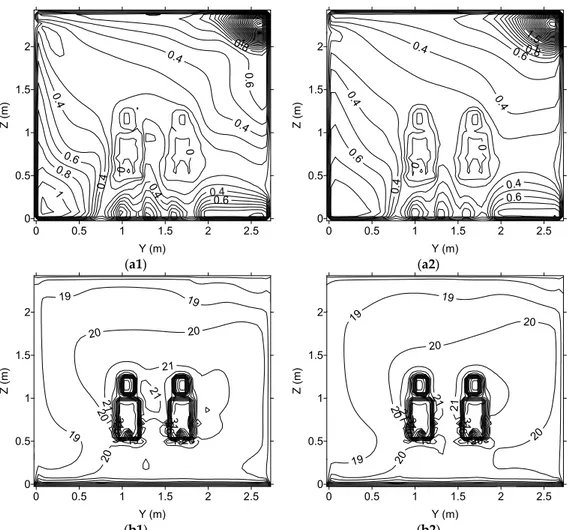
Figure 3.Air velocity (a1,a2) and air temperature (b1,b2) fields in the plan located at Y = 170 cm (Y34) (left side seated occupant), numerically calculated. (a1,b1) are associated with the k-epsilon turbulence model, and (a2,b2) are associated with the RNG turbulence model.
Buildings 2016, 6, 38 10 of 20
(b1) (b2)
Figure 3. Air velocity (a1,a2) and air temperature (b1,b2) fields in the plan located at Y = 170 cm (Y34) (left side seated occupant), numerically calculated. (a1,b1) are associated with the k‐epsilon turbulence model, and (a2,b2) are associated with the RNG turbulence model. (a1) (a2) (b1) (b2) Figure 4. Air velocity (a1,a2) and air temperature (b1,b2) fields in the plan located at X = 130 cm (X23), numerically calculated. (a1,b1) are associated with the k‐epsilon turbulence model, and (a2,b2) are associated with the RNG turbulence model. 19 19 19 19 1 9 19 20 20 20 20 20 20 20 21 21 21 21 26 31 0 0.5 1 1.5 2 X (m) 0 0.5 1 1.5 2 Z (m) 19 19 19 19 1 9 19 20 20 20 20 20 2 0 21 2 1 21 21 21 2 631 0 0.5 1 1.5 2 X (m) 0 0.5 1 1.5 2 Z ( m ) 0 0 0.4 0.4 0.4 0.4 0.4 0.6 0.6 0.6 0.8 0.8 1 1 0 0.5 1 1.5 2 2.5 Y (m) 0 0.5 1 1.5 2 Z ( m ) 0 0 0.4 0.4 0.4 0.4 0.4 0.6 0.6 0.60.81 1.5 0 0.5 1 1.5 2 2.5 Y (m) 0 0.5 1 1.5 2 Z ( m ) 19 19 19 19 19 20 20 20 20 20 21 21 21 2631 2631 0 0.5 1 1.5 2 2.5 Y (m) 0 0.5 1 1.5 2 Z ( m ) 19 19 19 19 19 20 20 20 20 20 20 21 21 21 2631 2631 0 0.5 1 1.5 2 2.5 Y (m) 0 0.5 1 1.5 2 Z ( m )
Figure 4.Air velocity (a1,a2) and air temperature (b1,b2) fields in the plan located at X = 130 cm (X23), numerically calculated. (a1,b1) are associated with the k-epsilon turbulence model, and (a2,b2) are associated with the RNG turbulence model.
Buildings 2016, 6, 38 11 of 20
Buildings 2016, 6, 38 11 of 20
(a1) (a2)
(b1) (b2)
Figure 5. Air velocity (a1,a2) and air temperature (b1,b2) fields in the plan located at Z = 120 cm (Z23), numerically calculated. (a1,b1) are associated with the k-epsilon turbulence model, and (a2,b2) are associated with the RNG turbulence model.
In accord with the obtained results, the inlet airflow arrives near the wall, placed in front of the inlet area, and the airflow is divided into two parts:
• a horizontal airflow to the upper area;
• a vertical descendent airflow to the lower occupied area.
In the remaining occupied area, the air ascendant airflow is verified.
The air velocity is highest in the left side area, in front and above the occupation area. The air velocity in front of the lower human bodies’ sections is higher in the occupant seated on the left side than in the occupant seated on the right side.
The air temperature is highest above the floor level (in front of the occupation area) and around the lower human body sections (mainly around the occupant seated on the left side).
The obtained airflow topology inside the occupied chamber space with occupation and with the warm radiant floor is different from the obtained airflow topology without occupation (presented in [13]). The body presence (occupation) promotes an airflow deflection and a natural convection, while the warm radiant floor heats the air near the floor and increases the natural recirculation. Thus, the occupation increases the air temperature and the air velocity around the occupation area.
Generally, in the application of the k-epsilon and the RNG turbulence models, no significant differences in the air velocity field are verified. Similar airflow topologies are obtained using the two methods. Only locally light differences are verified.
0.4 0 0.5 1 1.5 2 X (m) 0 0.5 1 1.5 2 2.5 0.4 0.4 0 0.5 1 1.5 2 X (m) 0 0.5 1 1.5 2 2.5 20 21 21 0 0.5 1 1.5 2 X (m) 0 0.5 1 1.5 2 2.5 19 20 0 0.5 1 1.5 2 X (m) 0 0.5 1 1.5 2 2.5
Figure 5.Air velocity (a1,a2) and air temperature (b1,b2) fields in the plan located at Z = 120 cm (Z23), numerically calculated. (a1,b1) are associated with the k-epsilon turbulence model, and (a2,b2) are associated with the RNG turbulence model.
In accord with the obtained results, the inlet airflow arrives near the wall, placed in front of the inlet area, and the airflow is divided into two parts:
• a horizontal airflow to the upper area;
• a vertical descendent airflow to the lower occupied area.
In the remaining occupied area, the air ascendant airflow is verified.
The air velocity is highest in the left side area, in front and above the occupation area. The air velocity in front of the lower human bodies’ sections is higher in the occupant seated on the left side than in the occupant seated on the right side.
The air temperature is highest above the floor level (in front of the occupation area) and around the lower human body sections (mainly around the occupant seated on the left side).
The obtained airflow topology inside the occupied chamber space with occupation and with the warm radiant floor is different from the obtained airflow topology without occupation (presented in [13]). The body presence (occupation) promotes an airflow deflection and a natural convection, while the warm radiant floor heats the air near the floor and increases the natural recirculation. Thus, the occupation increases the air temperature and the air velocity around the occupation area.
Buildings 2016, 6, 38 12 of 20
Generally, in the application of the k-epsilon and the RNG turbulence models, no significant differences in the air velocity field are verified. Similar airflow topologies are obtained using the two methods. Only locally light differences are verified.
However, in the air temperature field calculation, the application of the k-epsilon and the RNG turbulence models, some differences are verified. In general, when the k-epsilon turbulence model is used, the influence of the warm floor is higher than when the RNG turbulence model is used.
5.3. Thermal Comfort Level
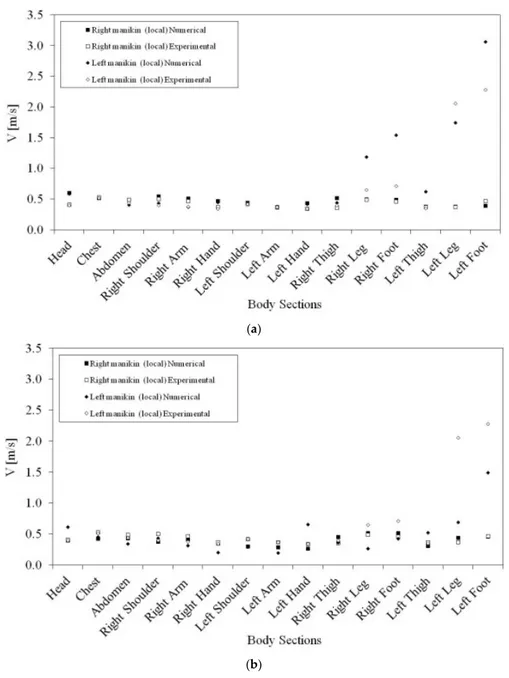
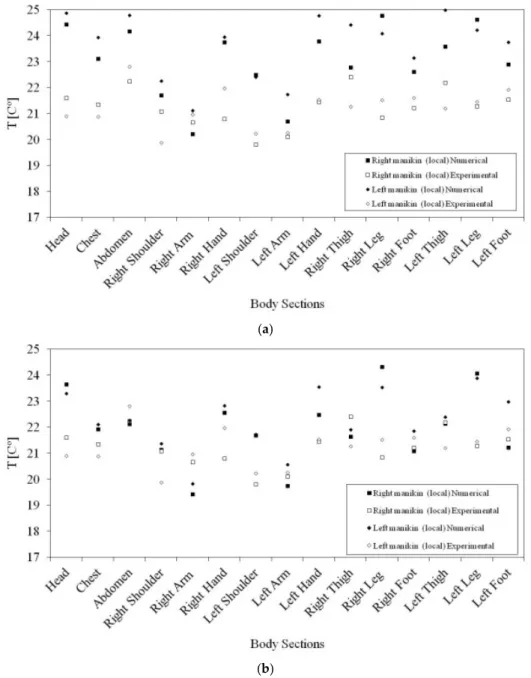
In Figure6, the measured and calculated local air velocities around the two occupants are presented, while in Figure7, the measured and calculated local air temperatures around the two occupants are shown. The measured and calculated values are presented around the 15 human body sections. In Figures6a and7a, the k-epsilon turbulence model is used, while in Figures6b and7b, the RNG turbulence model is used.
Buildings 2016, 6, 38 12 of 20
However, in the air temperature field calculation, the application of the k‐epsilon and the RNG turbulence models, some differences are verified. In general, when the k‐epsilon turbulence model is used, the influence of the warm floor is higher than when the RNG turbulence model is used.
5.3. Thermal Comfort Level
In Figure 6, the measured and calculated local air velocities around the two occupants are presented, while in Figure 7, the measured and calculated local air temperatures around the two occupants are shown. The measured and calculated values are presented around the 15 human body sections. In Figure 6a and Figure 7a, the k‐epsilon turbulence model is used, while in Figure 6b and Figure 7b, the RNG turbulence model is used. (a) (b)
Figure 6. Air velocity value around the occupants seated on the right and left side, numerically calculated and experimentally measured. In (a), the k‐epsilon turbulence model is used, and in (b), the RNG turbulence model is applied.
Figure 6. Air velocity value around the occupants seated on the right and left side, numerically calculated and experimentally measured. In (a), the k-epsilon turbulence model is used, and in (b), the RNG turbulence model is applied.
Buildings 2016, 6, 38 13 of 20 Buildings 2016, 6, 38 13 of 20
(a)
(b) Figure 7. Air temperature values around the occupants seated on the right and left side, numerically calculated and experimentally measured. In (a), the k‐epsilon turbulence model is used, and in (b), the RNG turbulence model is applied.
In Table 3, the air velocity and the air temperature accuracy, obtained in the validation tests, using the k‐epsilon and RNG turbulence models, are presented.
Table 3. Air velocity and the temperature accuracy obtained in the validation tests using the k‐epsilon and RNG turbulence models. Situation Model k‐epsilon RNG Air velocity around the right side occupant 0.8372 0.8777 Air velocity around the left side occupant 0.8511 0.9119 Air temperature around the right side occupant 0.9963 0.9966 Air temperature around the left side occupant 0.9961 0.9965 In the air velocity values, in general, a good agreement between local experimental values and local numerical values is verified. The air velocity mean accuracy, using the left and right seat occupant, when the k‐epsilon turbulence model is used, is 0.844, while when the RNG turbulence
Figure 7.Air temperature values around the occupants seated on the right and left side, numerically calculated and experimentally measured. In (a), the k-epsilon turbulence model is used, and in (b), the RNG turbulence model is applied.
In Table3, the air velocity and the air temperature accuracy, obtained in the validation tests, using the k-epsilon and RNG turbulence models, are presented.
Table 3.Air velocity and the temperature accuracy obtained in the validation tests using the k-epsilon and RNG turbulence models.
Situation
Model
k-epsilon RNG
Air velocity around the right side occupant 0.8372 0.8777 Air velocity around the left side occupant 0.8511 0.9119 Air temperature around the right side occupant 0.9963 0.9966 Air temperature around the left side occupant 0.9961 0.9965
Buildings 2016, 6, 38 14 of 20
In the air velocity values, in general, a good agreement between local experimental values and local numerical values is verified. The air velocity mean accuracy, using the left and right seat occupant, when the k-epsilon turbulence model is used, is 0.844, while when the RNG turbulence model is used, it is 0.895. In accordance with the obtained accuracy values, when the RNG turbulence model is used, the agreement is better than when the k-epsilon turbulence model is used (see [31]).
The highest discrepancy between experimental and numerical values is verified in the legs and feet of the left side seat occupant, when the k-epsilon turbulence model is used, and in the left leg and foot of the left side seat occupant, when the RNG turbulence model is applied. This fact is associated with strong convection currents verified in the frontal area of the left side seat occupant’s legs and feet.
In the air temperature values, in general, a good agreement between local experimental values and local numerical values is verified. The air temperature mean accuracy, using the left and right seat occupants, when the k-epsilon turbulence model is used, is 0.996, while when the RNG turbulence model is used, it is 0.997. In accordance with the obtained accuracy values, when the RNG turbulence model is used, the agreement is better than when the k-epsilon turbulence model is used (see [31]).
In general, as was verified in the previous section, the air temperature level obtained around the occupants is lightly lower when the RNG turbulence model is used than when the k-epsilon turbulence model is used.
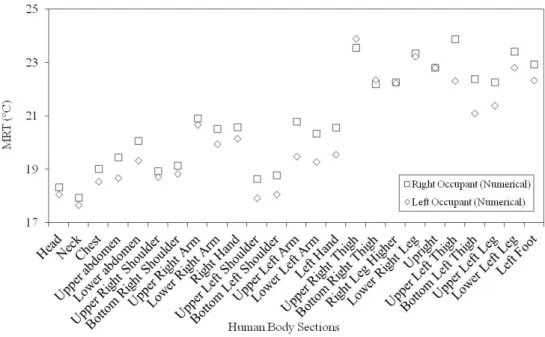
The MRT values around the occupants seated in the right and left side, numerically calculated, are presented in Figure8.
Buildings 2016, 6, 38 14 of 20
model is used, it is 0.895. In accordance with the obtained accuracy values, when the RNG turbulence model is used, the agreement is better than when the k‐epsilon turbulence model is used (see [31]).
The highest discrepancy between experimental and numerical values is verified in the legs and feet of the left side seat occupant, when the k‐epsilon turbulence model is used, and in the left leg and foot of the left side seat occupant, when the RNG turbulence model is applied. This fact is associated with strong convection currents verified in the frontal area of the left side seat occupant’s legs and feet.
In the air temperature values, in general, a good agreement between local experimental values and local numerical values is verified. The air temperature mean accuracy, using the left and right seat occupants, when the k‐epsilon turbulence model is used, is 0.996, while when the RNG turbulence model is used, it is 0.997. In accordance with the obtained accuracy values, when the RNG turbulence model is used, the agreement is better than when the k‐epsilon turbulence model is used (see [31]).
In general, as was verified in the previous section, the air temperature level obtained around the occupants is lightly lower when the RNG turbulence model is used than when the k‐epsilon turbulence model is used.
The MRT values around the occupants seated in the right and left side, numerically calculated, are presented in Figure 8.
In Table 4, the PMV and the PPD indexes, calculated through the numerical model, are presented.
Figure 8. Numerical mean radiant temperature (MRT) values around the occupants seated on the right and left side are subjected. Table 4. Predicted mean vote (PMV) and percentage of dissatisfied people (PPD) indexes numerically calculated. k‐epsilon RNG PMV PPD (%) PMV PPD (%) Right side seated occupant −0.59 12.2 −0.73 16.3 Left side seated occupant −0.57 11.9 −0.71 15.6
The PPD is higher in the RNG turbulence model than in the k‐epsilon turbulent model. However, the difference between the two models is very low. This difference, in general, is associated with the air temperature values in the RNG turbulence model being lower than in the k‐epsilon turbulent model.
Figure 8.Numerical mean radiant temperature (MRT) values around the occupants seated on the right and left side are subjected.
In Table4, the PMV and the PPD indexes, calculated through the numerical model, are presented.
Table 4. Predicted mean vote (PMV) and percentage of dissatisfied people (PPD) indexes numerically calculated.
k-epsilon RNG
PMV PPD (%) PMV PPD (%)
Right side seated occupant −0.59 12.2 −0.73 16.3
Buildings 2016, 6, 38 15 of 20
The PPD is higher in the RNG turbulence model than in the k-epsilon turbulent model. However, the difference between the two models is very low. This difference, in general, is associated with the air temperature values in the RNG turbulence model being lower than in the k-epsilon turbulent model. In accord with the obtained results, when the k-epsilon turbulent model is used, the occupants are thermally comfortable (see comfort Category C in [20]), by negative PMV values. When the RNG turbulent model is used, the occupants are not thermally comfortable (see comfort Category C in [20]) by negative PMV values. However, the thermal uncomfortable level obtained when the RNG turbulent model is used is very near the suggested thermal comfort levels (see comfort Category C in [20]).
5.4. Local Thermal Discomfort
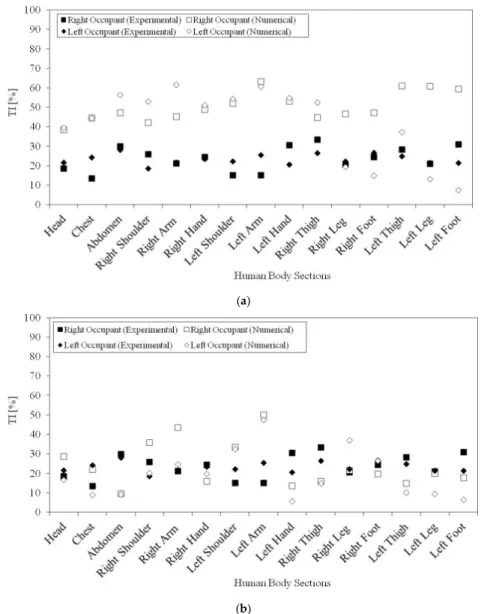
In this section, the occupants’ DR is evaluated and discussed. The numerical and experimental air turbulence intensity values are presented, for the right and left side seated occupants, in Figure9. The numerical and experimental DR values are presented, for the right and left side seated occupants, in Figure10. In Figures9a and10a, the k-epsilon turbulence model is used, and in Figures9b and10b, the RNG turbulence model is applied.
Buildings 2016, 6, 38 15 of 20
In accord with the obtained results, when the k‐epsilon turbulent model is used, the occupants are thermally comfortable (see comfort Category C in [20]), by negative PMV values. When the RNG turbulent model is used, the occupants are not thermally comfortable (see comfort Category C in [20]) by negative PMV values. However, the thermal uncomfortable level obtained when the RNG turbulent model is used is very near the suggested thermal comfort levels (see comfort Category C in [20]).
5.4. Local Thermal Discomfort
In this section, the occupants’ DR is evaluated and discussed. The numerical and experimental air turbulence intensity values are presented, for the right and left side seated occupants, in Figure 9. The numerical and experimental DR values are presented, for the right and left side seated occupants, in Figure 10. In Figure 9a and Figure 10a, the k‐epsilon turbulence model is used, and in Figure 9b and Figure 10b, the RNG turbulence model is applied. (a) (b)
Figure 9. Air turbulence intensity (TI) around the occupants, numerically calculated and experimentally measured. In (a), the k‐epsilon turbulence model is used, and in (b), the RNG turbulence model is applied.
Figure 9.Air turbulence intensity (TI) around the occupants, numerically calculated and experimentally measured. In (a), the k-epsilon turbulence model is used, and in (b), the RNG turbulence model is applied.
Buildings 2016, 6, 38 16 of 20 Buildings 2016, 6, 38 16 of 20 (a) (b)
Figure 10. Draught risk (DR) around the occupants numerically calculated and experimentally measured. In (a), the k‐epsilon turbulence model is used, and in (b), the RNG turbulence model is applied.
The air turbulence intensity and DR accuracy, obtained in the validation tests using the k‐epsilon and the RNG turbulence models, are presented in Table 5.
Table 5. Air turbulence intensity and DR accuracy obtained in the validations tests using the k‐epsilon and RNG turbulence models. Situation Model k‐epsilon RNG Air turbulence intensity around the right side occupant 0.9836 0.9942 Air turbulence intensity around the left side occupant 0.9891 0.9973 DR around the right side occupant 0.9886 0.9965 DR around the left side occupant 0.9884 0.9976 The air turbulence intensity mean accuracy, using the left and right seated occupants, when the k‐epsilon turbulence model is used, is 0.986, while when the RNG turbulence model is used, it is 0.996. In accord with the obtained results, the agreement between the air turbulence intensity,
Figure 10. Draught risk (DR) around the occupants numerically calculated and experimentally measured. In (a), the k-epsilon turbulence model is used, and in (b), the RNG turbulence model is applied.
The air turbulence intensity and DR accuracy, obtained in the validation tests using the k-epsilon and the RNG turbulence models, are presented in Table5.
Table 5.Air turbulence intensity and DR accuracy obtained in the validations tests using the k-epsilon and RNG turbulence models.
Situation Model
k-epsilon RNG
Air turbulence intensity around the right side occupant 0.9836 0.9942 Air turbulence intensity around the left side occupant 0.9891 0.9973
DR around the right side occupant 0.9886 0.9965
Buildings 2016, 6, 38 17 of 20
The air turbulence intensity mean accuracy, using the left and right seated occupants, when the k-epsilon turbulence model is used, is 0.986, while when the RNG turbulence model is used, it is 0.996. In accord with the obtained results, the agreement between the air turbulence intensity, experimentally and numerically obtained, is better when the RNG turbulence model is used than when the k-epsilon turbulence model is applied (see [31]).
The DR mean accuracy, using the left and right seated occupant, when the k-epsilon turbulence model is used, is 0.989, while when the RNG turbulence model is used, it is 0.997. In accord with the obtained results, the agreement between the DR experimental and numerical values is better when the RNG turbulence model is used than when the k-epsilon turbulence model is applied (see [31]).
The DR, to which both occupants are subjected, in the different human body sections, in general, is unacceptable (see Draught Risk Category C in [20]). Only some values, in general, experimentally obtained, are acceptable (see Draught Risk Category C in [20]).
5.5. Air Quality
In this section, the CO2concentration is numerically analyzed. In Figure11, the CO2concentration field in the horizontal plan, in the respiration area, is presented, while in Table6, the CO2concentration is presented. In both situations, for both occupants, the calculated CO2concentration is obtained in front of the nose area.
Buildings 2016, 6, 38 17 of 20
experimentally and numerically obtained, is better when the RNG turbulence model is used than when the k‐epsilon turbulence model is applied (see [31]). The DR mean accuracy, using the left and right seated occupant, when the k‐epsilon turbulence model is used, is 0.989, while when the RNG turbulence model is used, it is 0.997. In accord with the obtained results, the agreement between the DR experimental and numerical values is better when the RNG turbulence model is used than when the k‐epsilon turbulence model is applied (see [31]). The DR, to which both occupants are subjected, in the different human body sections, in general, is unacceptable (see Draught Risk Category C in [20]). Only some values, in general, experimentally obtained, are acceptable (see Draught Risk Category C in [20]). 5.5. Air Quality
In this section, the CO2 concentration is numerically analyzed. In Figure 11, the CO2
concentration field in the horizontal plan, in the respiration area, is presented, while in Table 6, the CO2 concentration is presented. In both situations, for both occupants, the calculated CO2
concentration is obtained in front of the nose area. (a) (b) Figure 11. CO2 concentration field for the plan XY, Z23, numerically calculated. (a) Associated with the k‐epsilon turbulence model and (b) associated with the RNG turbulence model. Table 6. CO2 concentration, in the breathing area, numerically calculated. CO2 Concentration (mg/m3) k‐epsilon RNG Right side seated occupant 971 1105 Left side seated occupant 2143 1713
The CO2 concentration inside the space, in general, is higher in the breathing area of the
occupants and is reduced when the distance with the breathing area increases. In general, with the exception to some centimeters’ distanced from the breathing area, the carbon concentration inside the space is around of 500 mg/m3. In accordance with the obtained CO2 concentration, in the numerical simulation, the values are slightly different when the RNG and the k‐epsilon turbulence models are used. The occupant in the right side seat is subjected to a lower CO2 concentration than the left side seated occupant. These results are associated with the airflow trajectory, from the occupant seated in the left side area to the outlet.
The CO2 concentration value in the breathing area, in accord with [25,26], in general, is
acceptable for the occupants. 0 0.5 1 1.5 2 X (m) 0 0.5 1 1.5 2 2.5 0 0.5 1 1.5 2 X (m) 0 0.5 1 1.5 2 2.5
Figure 11.CO2concentration field for the plan XY, Z23, numerically calculated. (a) Associated with the k-epsilon turbulence model and (b) associated with the RNG turbulence model.
Table 6.CO2concentration, in the breathing area, numerically calculated. CO2Concentration (mg/m3) k-epsilon RNG
Right side seated occupant 971 1105
Left side seated occupant 2143 1713
The CO2concentration inside the space, in general, is higher in the breathing area of the occupants and is reduced when the distance with the breathing area increases. In general, with the exception to some centimeters’ distanced from the breathing area, the carbon concentration inside the space is around of 500 mg/m3.
Buildings 2016, 6, 38 18 of 20
In accordance with the obtained CO2concentration, in the numerical simulation, the values are slightly different when the RNG and the k-epsilon turbulence models are used.
The occupant in the right side seat is subjected to a lower CO2concentration than the left side seated occupant. These results are associated with the airflow trajectory, from the occupant seated in the left side area to the outlet.
The CO2concentration value in the breathing area, in accord with [25,26], in general, is acceptable for the occupants.
6. Conclusions
In this work, the comfort level in spaces equipped with forced ventilation (when the inlet and outlet are placed above the head level in non-parallel walls) and a warm radiant floor (with water from a solar collector), in cold environments, is evaluated. A combination of experimental and numerical methodologies is used. A wooden chamber, a desk, two seats, two seated hygro-thermal manikins, a warm radiant floor, a solar radiation simulator and a water solar collector are used in the experimental tests, while coupling of integral and differential (using the k-epsilon and the RNG) models is applied in the numerical simulations.
A good agreement between local experimental values and local numerical values, of the chamber surface temperature, the air velocity, the air temperature, the air turbulent intensity and the DR, is verified.
The chamber surface temperature mean accuracy is 0.987. The air velocity mean accuracy is 0.844 for the k-epsilon turbulence model and is 0.895 for the RNG turbulence model. The air temperature mean accuracy is 0.996 for the k-epsilon turbulence model and is 0.997 for the RNG turbulence model. The air turbulent intensity mean accuracy is 0.986 for the k-epsilon turbulence model and is 0.996 for the RNG turbulence model. The DR mean accuracy is 0.989 for the k-epsilon turbulence model and is 0.997 for the RNG turbulence model. The lowest mean occupancy value is for the air velocity around the occupants, while the highest mean occupancy value is for the air temperature around the occupants. Thus, the obtained accuracy values, when the RNG turbulence model is used the agreement, is better than when the k-epsilon turbulence model is used.
The air velocity, in front of the lower body section, of the occupant seated in the left side is higher than on the right side seated occupant, while the air temperature is highest above and near the floor level and around the lower body sections, mainly in the left side seated occupant. In general, the upper body sections present lower DR than the lower body sections. Finally, the occupant seated on the right side is subjected to lower CO2concentration than the left side seated occupant.
The mean PPD, when the k-epsilon turbulence model is used, is 12.05, for negative PMV values, and when the RNG turbulence model is used, it is 15.95, also for negative PMV values. The DR values, in general, are higher than the Draught Risk Category C. The mean CO2concentration in the breathing area when the k-epsilon turbulence model is used is 1557 mg/m3, and when the RNG turbulence model is used, it is 1409 mg/m3. Thus, in accordance with the obtained values, the thermal comfort level is acceptable, the local thermal discomfort level is not acceptable and the air quality level is acceptable.
This system, with the combination of forced ventilation in the adjacent wall and of the warm radiant floor from solar collectors, in accordance with the obtained results, is able to be introduced in the chamber space. The expected thermal comfort level and the air quality level are acceptable. However, special attention to the local thermal discomfort level is suggested. In this system, forced external airflow and natural solar radiation are used. Ventilators and solar collectors with renewable energy applications are used.
However, in accordance with the obtained results, more numerical simulations, in real situations, with all occupants, are suggested. All of the spaces’ details, all of the occupants’ geometries and the ventilators’ airflow characteristics should also be considered.
Buildings 2016, 6, 38 19 of 20
Acknowledgments: The authors acknowledge the collaboration of ROLEAR S.A. The authors acknowledge the collaboration of the ASHRAE Undergraduate Senior Project Grant Program. The authors acknowledge the collaboration of the Master of the Environmental Engineering students.
Author Contributions:All authors contributed equally in the preparation of this manuscript. Conflicts of Interest:The authors declare no conflict of interest.
References
1. Gau, N.; Niu, J.; Zang, H. Coupling CFD and Human Body Thermoregulation Model for the Assessment of Personalized Ventilation. Int. J. Heat. Vent. Air-Cond. Refrig. Res. 2006, 12, 497–518. [CrossRef]
2. Zhu, S.; Kato, S.; Ooka, R.; Sakoi, T.; Tsuzuki, K. Coupled Simulation Method of Convection, Radiation, Moisture Transport and Sakoi Human Thermal Physiological Model to Simulate Heat Exchange from a Person Seated in a uniform environment. In Proceedings of the Tenth International Conference on Air Distribution in Rooms (RoomVent’2007), Helsinki, Finland, 13–15 June 2007.
3. Omni, O.; Tenabe, S. Coupled Simulation of Convection-Radiation-Thermoregulation for Predicting Human Thermal Sensation. In Proceedings of the Tenth International Conference on Air Distribution in Rooms (RoomVent’2007), Helsinki, Finland, 13–15 June 2007.
4. Kobayashi, T.; Sagara, K.; Yamanaka, T.; Kotani, H.; Sandberg, M. Prediction of Cross-Ventilation Rate Through Large Openings—Problems of Conventional Method. In Proceedings of the Tenth International Conference on Air Distribution in Rooms (RoomVent’2007), Helsinki, Finland, 13–15 June 2007.
5. Nonaka, T.; Kurabuchi, T.; Ohba, M.; Endo, T.; Goto, T.; Akamine, Y.; Numa, H. Investigation Concerning Effect of Roof Window in Cross Ventilation. In Proceedings of the Tenth International Conference on Air Distribution in Rooms (RoomVent’2007), Helsinki, Finland, 13–15 June 2007.
6. Sawachi, T.; Nishizawa, S.; Habara, H.; Miura, H. Estimation of Cooling Energy Reduction by Utilizing Cross-Ventilation in Detached Houses, within the Japanese Newly Introduced Energy Regulation Evaluating Energy Consumption for Different Uses. In Proceedings of the Eleventh International Conference on Air Distribution in Rooms (RoomVent’2009), Bussan, Korea, 24–27 June 2009.
7. Imano, M.; Hoshino, H.; Akamine, Y.; Kamata, M.; Nishimura, A.; Sakamoto, Y. Validation of CFD Analysis of Cross-Ventilation in Detached House Uses. In Proceedings of the Eleventh International Conference on Air Distribution in Rooms (RoomVent’2009), Bussan, Korea, 24–27 June 2009.
8. Tsukamoto, K.; Ohba, M.; Kurabuchi, T.; Nonaka, T.; Goto, T.Y. Study on Reduction of Cooling Loads in Detached House by Cross-Ventilation Using Coupled Simulation of Semi-Empirical Ventilation Model and Network Models. In Proceedings of the Eleventh International Conference on Air Distribution in Rooms (RoomVent’2009), Bussan, Korea, 24–27 June 2009.
9. Kobayashi, T.; Sandberg, M.; Kotani, H.; Claesson, L.; Yamanaka, T.; Sagara, K. Airflow Patterns and Pressure Distributions for a Cross-Ventilated Detached House Analyzed by Wind Tunnel Tests and CFD Analysis. In Proceedings of the Eleventh International Conference on Air Distribution in Rooms (RoomVent’2009), Bussan, Korea, 24–27 June 2009.
10. Kouchi, Y.; Kurabuchi, T.; Ohba, M.; Endo, T.; Nonaka, T. Study on Prediction of Cross-Ventilation Indoor Airflow Distribution with Domain Decomposition Technique. In Proceedings of the Eleventh International Conference on Air Distribution in Rooms (RoomVent’2009), Bussan, Korea, 24–27 June 2009.
11. Conceição, E.Z.E.; Lúcio, MªM.J.R.; Capela, T.L.; Brito, A.I.P.V. Evaluation of Thermal Comfort in Slightly Warm Ventilated Spaces in Non-Uniform Environments. Int. J. Heat. Vent. Air-Cond. Refrig. Res. 2006, 12, 451–458.
12. Conceição, E.Z.E.; Lúcio, Ma¯M.J.R.; Vicente, V.D.S.R.; Rosão, V.C.T. Evaluation of Local Thermal Discomfort in a Classroom Equipped with Crossed Ventilation. Int. J. Vent. 2008, 7, 267–277.
13. Conceição, E.Z.E.; Vicente, V.D.S.R.; Lúcio, Ma
¯M.J.R. Airflow Inside School Buildings Office Compartments with Moderate Environment. Int. J. Heat. Vent. Air-Cond. Refrig. Res. 2008, 14, 195–207.
14. Conceição, E.Z.E.; Rosa, S.P.; Custódio, A.L.V.; Andrade, R.L.; Meira, MªJ.P.A.; Lúcio, MªM.J.R. Study of Airflow Around Occupants Seated in Desks Equipped With Upper and Lower Air Terminal Devices for Slightly Warm Environments. Int. J. Heat. Vent. Air-Cond. Refrig. Res. 2010, 16, 401–412.
Buildings 2016, 6, 38 20 of 20
15. Conceição, E.Z.E.; Lúcio, Ma¯M.J.R.; Rosa, S.P.; Custódio, A.L.V.; Andrade, R.L.; Meira, MªJ.P.A. Evaluation of Comfort Level in Desks Equipped with Two Personalized Ventilation Systems in Slightly Warm Environments. Build. Environ. 2010, 45, 601–609.
16. Conceição, E.Z.E. Numerical Simulation of Buildings Thermal Behavior and Human Thermal Comfort Multi-node Models. In Proceedings of the 8th International IBPSA Conference—Building Simulation, Eindhoven, Netherland, 11–14 August 2003; pp. 227–234.
17. Conceição, E.Z.E.; Lúcio, Ma
¯M.J.R. Numerical Study of Thermal Response of School Buildings in Summer Conditions. In Proceedings of the Healthy Buildings, Lisbon, Portugal, 4–8 June 2006; Volume 3, pp. 195–200. 18. Conceição, E.Z.E.; Lúcio, Ma¯M.J.R. Thermal Study of School Buildings in Winter Conditions. Build. Environ.
2008, 43, 782–792.
19. Fanger, P.O. Thermal Comfort; Danish Technical Press: Copenhagen, Denmark, 1970.
20. International Organization for Standardization. Ergonomics of the Thermal Environments—Analytical Determination and Interpretation of Thermal Comfort using Calculation of the PMV and PPD Indices and Local Thermal Comfort Criteria; International Standard: Geneva, Switzerland, 2005.
21. ANSI/ASHRAE Standard 55. Thermal Environmental Conditions for Human Occupancy; American Society of Heating, Refrigerating and Air-Conditioning Engineers, Inc.: Atlanta, GA, USA, 2004.
22. Fanger, P.; Melikov, A.; Hazawa, H.; Ring, J. Air Turbulence and Sensation of Draught. Energy Build. 1988, 12, 21–39. [CrossRef]
23. Fanger, P.O.; Christensen, N.K. Prediction of Draught in Ventilated Spaces. Ergonomics 1986, 29, 215–235. [CrossRef] [PubMed]
24. Melikov, A.K.; Langkilde, G.; Derbiszewsbi, B. Airflow Characteristics in the Occupied Zone of Rooms with Displacement Ventilation. ASHRAE Trans. 1990, 96, 555–563.
25. ANSI/ASHRAE Standard 62.1. ASHRAE Standard—Ventilation for Acceptable Indoor Air Quality; American Society of Heating, Refrigerating and Air-Conditioning Engineers, Inc.: Atlanta, GA, USA, 2004.
26. Decreto-Lei n◦79. Regulamento dos sistemas energéticos de climatização em edifícios (RSECE), Diário da República, I Série-A, N. 67, 4 April 2006. Available online: http://www.adene.pt/sites/default/files/ 24162468.pdf (accessed on 15 September 2016).
27. Papakonstantinou, K.A.; Kiranoudis, C.T.; Markatos, N.C. Numerical Simulation of CO2dispersion in an auditorium. Energy Build. 2002, 34, 245–250. [CrossRef]
28. Nagy, R.; Senitkova, K. IAQ and Distribution Systems in School Buildings. In Proceedings of the Tenth International Conference on Air Distribution in Rooms (RoomVent’2007), Helsinki, Finland, 13–15 June 2007. 29. Bulinska, A. Determination of Airflow Pattern in a Residential Building Using Metabolic Carbon Dioxide Concentration Measurements. In Proceedings of the Tenth International Conference on Air Distribution in Rooms (RoomVent’2007), Helsinki, Finland, 13–15 June 2007.
30. Levine, K.B.; Sterling, E.M.; Collet, C.W. Estimation of Outdoor Air Ventilation Rates Using CO2 Concentration. ASHRAE Trans. 1993, 1, 1554–1559.
31. Rabinovich, S. Evaluating Measurement Accuracy: A Practical Approach; Springer: New York, NY, USA, 2010. 32. Stolwijk, J.A.J. Mathematical Model of Thermoregulation. In Physiological and Behavioral Thermoregulation;
Hardy, J.D., Gagge, A.P., Stolwijk, J.A.J., Eds.; Thomas: Springfield, IL, USA, 1970; pp. 703–721.
33. Miyanaga, T.; Nakamo, Y. Analysis of thermal sensation in a radiant cooled room by modified PMV. In Proceedings of the Sixth International Conference on Air Distribution in Rooms (RoomVent’1998), Stockholm, Sweden, 14–17 June 1998; pp. 125–131.
34. Patankar, S.V. Numerical Heat Transfer and Fluid Flow; Hemisphere Publishing Corporation: Washington, DC, USA, 1980.
35. Popiolek, Z.; Melikov, A. Improved interpretation and validation of CFD predictions. In Proceedings of the 9th International Conference Air Distribution in Rooms (Room Vent 2004), Coimbra, Portugal, 5–8 September 2004.
© 2016 by the authors; licensee MDPI, Basel, Switzerland. This article is an open access article distributed under the terms and conditions of the Creative Commons Attribution (CC-BY) license (http://creativecommons.org/licenses/by/4.0/).