Integrating the Data Envelopment Analysis and the Balanced Scorecard
Approaches for Enhanced Performance Assessment
Carla A.F. Amado*,a, Sérgio P. Santosa and Pedro M. Marques
a
Faculty of Economics, University of Algarve and CEFAGE-UE 8005-139 Faro, Portugal
Email:[email protected]; [email protected]; [email protected]
*Corresponding author
ABSTRACT
This article presents the development of a conceptual framework which aims to assess Decision Making Units (DMU) from multiple perspectives. The proposed conceptual framework combines the Balanced Scorecard (BSC) method with the non-parametric technique known as Data Envelopment Analysis (DEA) by using various interconnected models which try to encapsulate four perspectives of performance (financial, customers, internal processes, learning and growth).
The practical relevance of the conceptual model has been tested by using it to assess the performance of DMUs in a multinational company which operates in two business areas. Various models were developed with the collaboration of the directors of the company in order to conceive an appropriate and consensual framework which may provide useful information for the company. The application of the conceptual framework provides structured information regarding the performance of each DMU (from multiple perspectives) and ways to improve it. By integrating the BSC and the DEA approaches this research helps to identify where there is room for improving organisational performance and points out opportunities for reciprocal learning between DMUs. In doing so, this article provides a set of recommendations relating to the successful application of DEA and its integration with the BSC, in order to promote a continuous learning process and to bring about improvements in performance.
Keywords: DEA; BSC; Efficiency; Management
This is a post-print (i.e. final draft post-refereeing) of a manuscript submitted to Omega – The International Journal of Management Science.
To cite this article: Amado, C.A.F., Santos, S.P. and P. Marques (2012). “Integrating the Data Envelopment Analysis and the Balanced Scorecard approaches for enhanced performance assessment”. Omega, The International Journal of Management Science, 40(3): 390-403.
2 1.INTRODUCTION
In a competitive environment, characterised by the scarcity of resources, performance measurement and management assumes a crucial role. Data Envelopment Analysis (DEA) is a non-parametric technique for evaluating the performance of Decision Making Units (DMUs). Using a production metaphor, this technique, originally proposed by Charnes et al. [1], evaluates the efficiency of DMUs in converting multiple inputs into multiple outputs. Since this seminal paper, we have seen numerous theoretical developments of the DEA methodology [2]. Furthermore, we have also seen the widespread application of DEA in several contexts, such as health care, education, manufacturing, retailing, banking, etc. In recent years, we have also witnessed the development of literature relating to the need to move beyond financial measures of performance [3] and several sophisticated systems for performance assessment have been proposed. The Balanced Scorecard (BSC), developed by Kaplan and Norton [4], is one of the best known of these performance assessment frameworks. Developed from the strategy of the organisation, this framework includes indicators related to four perspectives: financial, customers, internal processes, learning and growth.
Despite the popularity of the DEA and the BSC approaches, there have been very few studies that have explored their integration for enhanced performance assessment. This is the objective of this article. In line with what has been suggested by several authors (for example, Ackoff [5], Cooper [6], Dyson and Shale [7]), the main purpose of this research project is to explore the usefulness of Operational Research techniques (in particular, the DEA method) in real operational contexts and to put forward some recommendations regarding its successful application in practice. With this purpose in mind, and using a case study from a multinational company operating in the area of vertical transportation, we have developed four interconnected DEA models, one for each of the perspectives of the BSC. The results from these models were then analysed and discussed with the General and Regional directors of the company in Portugal in order to gain insights for performance improvement. The framework we have developed and the results it has produced suggest that moving away from a unique, all embracing DEA model, towards several complementary DEA models can be advantageous for performance measurement and performance improvement. By using several complementary models, the multidimensional nature of performance and the need to answer to the interests of multiple stakeholders is emphasised. Furthermore, the use of several complementary models offers richer information for the DMUs, because it highlights the weakest and strongest dimensions of performance and identifies relevant benchmarks for learning in each of the dimensions, acknowledging that some DMUs might be regarded as best practice in some dimensions but not in others.
We have structured the remainder of this paper into three sections. Section 2 discusses the previous studies that have combined the use of DEA with the BSC and highlights the main contribution of this article. Section 3 details the empirical study and discusses the main results. In particular, in this section, we discuss the development of the BSC and the DEA models to
3 capture each of the performance dimensions and the use of the results to gain insights for performance improvement. Section 4 concludes and offers suggestions for future research.
2. LITERATURE REVIEW
2.1 Data Envelopment Analysis
DEA is a non-parametric technique used to measure the efficiency of DMUs and was first proposed by Charnes et al. [1]. It considers that each DMU is engaged in a transformation process, where by using some inputs (resources) it is trying to produce some outputs (goods or services). DEA uses all the data available to construct a best practice empirical frontier, to which each inefficient DMU is compared.
One of the interesting features of DEA is that it allows each unit to identify a benchmarking group; that is, a group of units that are following the same objectives and priorities, but performing better. In this regard DEA aims to respect the priorities of each DMU by allowing each one of them to choose the weight structure for inputs and outputs that most benefits its evaluation. As a result, it aims to classify each unit in the best possible light in comparison to the other units. Another advantage of DEA is that it does not require specification of a cost or production function, allowing for richer models. A comprehensive review of the DEA technique can be found in Cooper et al. [8] and Cook and Zhu [9]. Cook and Seiford [2] review the main theoretical developments and applications of DEA since it was first proposed in 1978.
2.2 Balanced Scorecard
The Balanced Scorecard, developed by Kaplan and Norton at Harvard Business School in the early 1990s [4], is undoubtedly one of the best-known and most widely used frameworks for performance measurement proposed in recent years. The BSC is a conceptual framework for translating an organisation’s strategic objectives into a set of performance measures distributed among four perspectives: financial, customer, internal business processes, and learning and growth. As well as enabling managers to focus on their organisations from these four key perspectives, the BSC provides answers to the following questions: How do we regard our shareholders? (Financial perspective); How do our customers see us? (Customer perspective); What must we excel at? (Internal business processes perspective); How can we continue to innovate and create value? (Learning and growth perspective). For each of the four perspectives, objectives, measures, targets and initiatives are developed.
The BSC is developed from the organisation’s vision and strategy and its main strength is in the way it seeks to integrate different measures and make explicit the links between different dimensions of performance in a single system. By forcing senior managers to consider all the important operational measures (some of which conflict) at the same time, it is claimed that the BSC prevents sub-optimisation of performance [10, 11].
4 Despite its strengths and widespread use, numerous authors have identified shortcomings in the BSC. One of the criticisms that has been made is the fact that it does not specify how tradeoffs are to be made between different scorecard criteria [12], nor does it specify an objective weighting scheme for the performance measures. It has also been argued that an analysis based on the BSC may fail to identify inefficiency in the use of resources [13]. Furthermore, without a benchmarking exercise, the identification of appropriate targets for each of the performance indicators is difficult in practice. It is our conviction that the integration of DEA with the BSC can overcome some of the limitations of the BSC, providing the basis for enhanced performance assessment.
2.3 The integration of Data Envelopment Analysis and Balanced Scorecard
Traditional DEA models treat the underlying production processes as black boxes and use a single model to capture the transformation of multiple inputs into multiple outputs [14]. However, as suggested by Fitzgerald and Storbeck [15: 199] “standard DEA scores tend to summarise well in providing overall measures of performance, but they can also bury critical information and obscure the needed actions of decision-makers”. On one side, overall measures of performance may obscure valuable information about relative weaknesses and relative strengths of the organisation regarding the views of different stakeholders. On the other side, overall measures fail to capture the efforts of different processes and sub-processes within the organisation and might inhibit valuable managerial information [16, 17].
This research suggests, therefore, that the multidimensional nature of performance can best be captured using several DEA models. Furthermore, it also suggests that in order to obtain useful information for performance improvement, the analyst must move away from a black box, and attempt to capture the dynamics of the transformation processes and sub-processes within the organisation. In this respect, we find that the family of network DEA models proposed by Färe and Grosskopf [14] can play an important role in opening the black box and identifying sources of inefficiency in parts of the organisational processes. These models have received considerable attention recently and we can find several examples of applications in different contexts [18, 19]. Cook et al [20] provide a recent review of the different DEA models developed to deal with two-stage network processes.
Considering that the BSC is a framework that tells the story of how each part of the organisation contributes to its success, by following a series of explicit cause and effect relationships [21], we believe that it can offer a useful framework to structure several interconnected DEA models. An integrated analysis of the results of these complementary models can offer rich information regarding the sub-processes where the organisation must focus to improve its overall performance, as well as identify specific learning networks for each of the sub-processes.
Mingers and Brocklesby [22] defend the combination of multiple methodologies in order to better capture the complexities of real-world problems. Franco and Lord [23] provide an
5 example of a combination of multiple methodologies to support organizational decision making. The advantages of combining several approaches in order to obtain enhanced performance assessment frameworks have also been pointed out in the literature [24, 25] and several authors have focused their attention on the DEA and BSC approaches. For instance, some authors have used DEA and BSC separately in order to assess the usefulness of these approaches [26], whilst others have complemented the DEA analysis with other performance assessment frameworks in order to better understand the DEA results [27, 28]. From a different perspective, Min et al. [29] have developed a balanced scorecard for Korean hotels in which the financial perspective is evaluated with the efficiency results obtained from DEA analysis. Nevertheless, whilst several important developments have taken place in this area in recent years, very few studies have documented the integration of DEA with the BSC. The exceptions are the works of Rickards [30], Eilat et al. [31], Chen and Chen [32], Eilat et al. [33], Chen et al. [34], Macedo et al. [35] and Chiang and Lin [36] which have proposed the use of a single DEA model with outputs capturing the four perspectives of the BSC. Banker et al. [37] and more recently García-Valderrama et al. [38] have also integrated these two approaches. The former developed a DEA based method to study the tradeoffs between financial and non-financial performance metrics in the BSC. The latter studied the relationship between the four perspectives of the BSC by developing several DEA models. In order to highlight the distinctive elements of the research developed in this article, we will now discuss in more detail some of the studies that have combined the use of DEA and BSC.
Rouse et al. [28] is the first study to emphasise the potential of complementing the DEA analysis with performance assessment frameworks based on the BSC. In this study, the authors develop an analysis of the productivity of the engineering service division of an international airline based on DEA and Malmquist analysis and complement it by using a performance pyramid. This pyramid captured the four perspectives of the BSC and was used to facilitate the identification of the sources of inefficiencies identified by the DEA model.
It was, however, Rickards [30] who developed the first DEA model aiming to capture the four perspectives of the BSC. In a comparison of 69 units of a multinational company, Rickards used the following outputs: cash flow, customer commitment, internal service quality and employee motivation. The inputs used were machine capacity, number of employees, salesroom floor space and advertising expenditure. In this study, the usefulness of DEA allowing the transformation of a long list of performance indicators, selected on the basis of a BSC, into a global performance score is emphasised. Rickards’ idea of developing a unique DEA model capturing the various perspectives of the BSC was reproduced in later studies. Whilst Chen and Chen [32] applied this idea to study efficiency in the semiconductor industry in Taiwan, Chen et al. [34] and Macedo et al. [35] studied the performance of bank branches. Following a similar approach, Chiang and Lin [36] developed a DEA model with four inputs and four outputs (one for each perspective of the BSC) in order to evaluate the performance of auto companies and commercial banks. These studies are relevant because they show how the BSC concepts can be incorporated into the DEA methodology in order to obtain holistic models.
6 However, this research area advances significantly with the publication of two other studies which show how the integration of the DEA and the BSC approaches can extend their individual capabilities. Eilat et al. [31, 33] go beyond the development of a model capturing the various perspectives of the BSC, by proposing the inclusion of weight restrictions to guarantee a truly balanced assessment. Whilst Eilat et al. [33] focus on the comparison of individual R&D projects, Eilat et al. [31] develop a DEA based methodology to compare and select portfolios of projects.
Whilst the studies discussed earlier have used a single model to integrate the DEA and BSC methods, García-Valderrama et al. [38] chose to work with multiple models. In that study, five DEA models were developed to test the hypothesised cause and effect relationships suggested by the advocates of the BSC, in the context of R&D activities. The first model developed uses inputs from the customer perspective and outputs from the financial perspective. The second model uses inputs from the innovation perspective and outputs from the customer perspective. The third model uses inputs from the internal perspective and outputs from the innovation perspective. The fourth model uses inputs from the learning and growth perspective and outputs from the internal perspective. Finally, the fifth model uses inputs from the learning and growth perspective and outputs from the financial perspective.
In order to analyse the relationships between the efficiency ratios, García-Valderrama et al. [38] use data from 90 responses to a survey of chemical and pharmaceutical companies operating in Spain. Pearson’s Product Moment Correlation Coefficient and factor analysis are used to obtain an overall interpretation of the ratio correlations between the efficiency results of the various DEA models. The conclusion obtained in this study was that the results from the five models of efficiency were highly correlated with each other for all the companies studied, corroborating the hypothesised cause and effect relationships of the BSC.
Table 1 below provides a detailed comparison between the different approaches that have been used to combine these two methods. This table shows that there have been several different objectives behind the integration of the two methods. In particular, they have been integrated to identify the tradeoffs and to test the hypothesised relationships between the different perspectives of performance; to incorporate the perspectives of multiple stakeholders into a single holistic model of performance; and to trace the sources of performance results and performance changes. These different objectives have led the researchers to choose different approaches for combining these two methods. Whilst some researchers have simply used the results of one method to feed into the results of the other, others have integrated both methods. This integration has either been carried through the use of a single DEA model with several outputs capturing the different performance dimensions or the use of multiple interconnected models.
7 Table 1 – Comparison of the previous studies that have combined the DEA and the BSC methods
Study Context of application
Methods used for analysis Objectives of the integration of DEA and BSC
Approach used to integrate DEA and BSC
Banker et al. [37] United States telecommunications industry
DEA, BSC, Test Statistics To evaluate the tradeoffs between different performance metrics
Two non-conventional DEA models are run with four performance metrics considered as outputs. In one of these models tradeoffs between the outputs are allowed and in the other model tradeoffs are not allowed. Several test statistics are performed in order to test the existence of tradeoffs between the performance metrics.
Chen and Chen [32]
Semiconductor industry in Taiwan
DEA, BSC To evaluate the performance of the semiconductor industry in Taiwan, according to the four perspectives of the BSC
In a first stage indicators relating to each of the four perspectives of the BSC were selected. On a second stage, four DEA models were built using the indicators selected for each perspective. The results of the different models were compared.
Chen et al. [34] Credit cooperative bank in Taiwan
DEA, BSC, Wilcoxon Signed Ranks Test
To show how the selection of performance indices affects performance results
The authors compared the results of four DEA models: the first model includes basic inputs and outputs, the second model includes BSC indices, the third model includes BSC indices with risk management and the fourth model includes traditional financial indices.
Chiang and Lin [36]
Auto companies and commercial banks industry in the United States
DEA, BSC, Principal Component Analysis, Factor Analysis, Canonical Correlation Analysis
To evaluate the performance in two distinct industries (auto and national commercial bank) and to test the interrelationships among the four perspectives of the BSC
In the first stage, statistical analysis are undertaken to test the hypothesised interrelationships between the four perspectives of the BSC. In the second stage, a single DEA model is run with four input variables and four output variables. Each output variable was calculated using a single average of the BSC indicators for each one of the four perspectives.
Eilat et al. [33] Individual R&D projects
DEA, BSC To evaluate R&D projects in different stages of their life cycle, using an integrated DEA-BSC model
The input and output measures are grouped into “cards” which are associated with a BSC. The BSC approach is embedded in the DEA model through a hierarchical structure of constraints, in order to obtain a balanced evaluation.
Eilat et al. [31] Portfolios of R&D projects
DEA, BSC, Branch and Bound algorithm
To extend the work presented in Eilat et al. [26], by proposing and demonstrating a methodology for the construction and analysis of efficient, effective and balanced portfolios of R&D with interactions
The proposed methodology is composed of seven steps: Allocation of resources; Individual project evaluation; Projects variability control; Generation of portfolios; Applying an accumulation function to determine inputs and outputs of the candidate portfolio; Evaluating alternative portfolios; Sensitivity analysis.
García-Valderrama et al. [38] R&D activities in chemical and pharmaceutical companies in Spain DEA, BSC, Pearson’s Correlation Coefficient, Factor analysis
To study the relationships between the perspectives of the BSC for R&D activities
In a first stage, five different DEA models were developed to capture the hypothesised cause-effect relationships of the BSC. On a second stage, ratio correlations between the results of each DEA model are calculated and factor analysis is performed to obtain an interpretation of the ratio correlations.
Macedo et al. [35] Bank branches in Brazil
DEA, BSC To evaluate the performance of bank branches using six indicators based on the six BSC perspectives used in the bank
A single DEA model was used with six indicators. The indicators from the perspectives of Strategy and Operations; Internal processes; Organisational Behaviour were used as inputs and the indicators related to the perspectives of Economic Result; Costumers; Society were used as outputs.
Min et al. [29] Luxury hotels in Korea
DEA, BSC To develop a balanced scorecard to measure the efficiency of Korean luxury hotels
A balanced scorecard was developed including the four traditional perspectives. The scores from a DEA model including basic inputs and outputs were used as the performance indicators for the financial perspective of the BSC.
Rickards [30] Multinational company operating in Europe
DEA, BSC To evaluate overall management performance through the use of a DEA model with indicators covering the four perspectives of the BSC
In a first stage, the firm identifies performance indicators according to the perspectives of the BSC. On a second stage, the indicators are classified as input or output variables and a DEA model is run to obtain overall performance measures.
Rouse et al. [28] Engineering service division of an international airline
DEA, Malmquist index, Performance Pyramid with the 4 perspectives of the BSC
To undertake regular performance measurement and to identify the causes of the performance results
In a first stage, DEA was used to measure efficiency and productivity over time.
On a second stage, a performance pyramid with the 4 perspectives of the BSC was developed in order to understand and act upon the DEA results.
In our study, we have chosen to work with multiple interconnected models, in line with the principles of network DEA, because we believe that this approach better captures the dynamics of the production processes and sub-processes. By using the outputs of one model as inputs for the following model, we assume that the transformation of initial inputs into final outputs can be decomposed into several stages characterised by the production of several intermediate outputs. Our goal is to show that the integration of these two methods can offer critical information and shed some light into the needed actions of decision-makers. By opening the box, we attempt to uncover some of the structures and mechanisms behind successful practice, as well as identify sources of inefficiency within the processes.
The combination of inputs from one perspective with outputs from a different perspective in the DEA models was also used by García-Valderrama et al. [38]. Despite using a similar approach, our objectives are different from this previous study. Whilst in the study by García-Valderrama et al. [38] survey data from several companies has been used in order to test the hypothesised relationships, in our study, we use accounting data from a single company in order to promote learning. This is, indeed, an important departure from previous studies. These studies have been predominantly descriptive and
classificatory or have been carried out to test theoretical propositions. In contrast, the evaluation we discuss in this paper is predominantly formative, characterised by an effort to involve decision makers and to provide useful information for organisational management and improvement. Its ultimate aim is the promotion of learning. In particular, it aims to show that by developing several complementary DEA models it is possible to take into account the interests of different stakeholders; highlight for each DMU the dimensions that require corrective action; and identify appropriate peers for learning. By doing so, we are able to identify opportunities to help each DMU to improve their performance, which would likely be missed by using a single DEA model embracing the four perspectives of the BSC. The fact that one of the authors is a member of the organisation assessed allowed us to involve some influential decision makers at key stages of the process, and discuss with them not only the models but also the results produced. This was important to legitimise the models adopted and improve the face validity of the results obtained.
The studies published by Sarrico et al. [39], Amado and Dyson [40] and Avkiran and Morita [41] closely approach the objectives of our study. In these two studies the need to develop different DEA models to answer to the interests of different stakeholders is also highlighted. We follow the line of research initiated by these authors, but aim to enhance DEA evaluation by integrating the BSC concepts. We argue that in order to obtain useful information for performance improvement within an organisation, it is essential to develop multiple complementary models and explore the results in an integrated manner. In the next section we describe the empirical analysis undertaken with a case study. Whilst a case study based research methodology has its own limitations and provides little basis for generalization, the opportunity it offers to examine in-depth the phenomenon under study and to deliberately cover
9 contextual conditions represents an advantage over other methodologies in accomplishing the objectives of this research.
3.INTEGRATED PERFORMANCE ASSESSMENT FRAMEWORK –ACASE STUDY
The empirical study presented here focuses on a set of DMUs that represent the Portuguese delegations of the Department of Maintenance of a multinational organisation operating in the area of vertical transportation. The department of Equipment Maintenance (EM) provides maintenance to the equipments installed by another department of this company: the department of Installation of New Equipments (INE). Furthermore, the department of EM has its own marketing department and develops efforts to establish contracts of maintenance for equipment installed by other companies. In Portugal there are 15 regional delegations that provide equipment maintenance and these are the units evaluated in this case study. The equipment we are referring to are mechanical devices for vertical human transportation such as elevators and other moving platforms.
3.1 The Balanced Scorecard and Strategic Map for the department
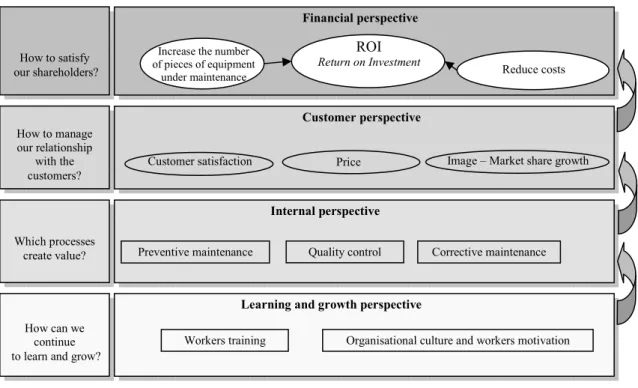
In order to develop the DEA models to assess the performance of the department of EM from multiple perspectives, it was necessary to develop a BSC for the organisation and a BSC for the department of EM. Several workshops were undertaken with the heads of department and other managers in order to discuss the vision and strategy for the company. The strategy map and the BSC for the department of EM are presented in Figures 1 and 2, respectively.
Figure 1 – Strategic Map for the department of EM
Workers training Organisational culture and workers motivation Learning and growth perspective
Corrective maintenance Quality control
Preventive maintenance
Internal perspective
Image – Market share growth Customer perspective
ROI Return on Investment
Reduce costs
Increase the number of pieces of equipment
under maintenance
Financial perspective
How can we continue to learn and grow?
Which processes create value? How to manage our relationship with the customers? How to satisfy our shareholders? Price Customer satisfaction
10 Figure 2 - Balanced Scorecard for the department of EM
F
in
a
n
ci
a
l
Strategic
objectives
Critical success
factors
Indicators
C
u
st
o
m
er
s
• To grow and achieve high profitability. • To create value for the shareholders.
• Stable growth in financial terms and profitability. • Risk management.
• Number of pieces of equipment under maintenance.
• Total costs. • Total revenue.
• Earnings Before Interest Reestructuring and Taxes (EBIRT).
• Working Capital. • To achieve high customer satisfaction. • To achieve speed of intervention. • To increase the n.º of pieces of equipment. • To be a benchmark in the industry. • Customer satisfaction. • Deadlines. • Competitiveness. • Recognition. • Excellence in service provision.
• Number of satisfied customers. • Number of customer complaints. • Time to answer customer complaints. • Number of pieces of equipment with maintenance cancelled.
• Number of pieces of new equipment under maintenance.
In
te
rn
a
l
p
ro
ce
ss
es
• To achieve high service quality.
• To reduce processing time.
• To maintain high standards of service delivery and equipment safety.
• To be capable of answering the customer requests.
• Preventive and corrective maintenance. • Safe and dependable services. • Efficient solutions to the customers. • Partnerships. • Capacity of negotiation. • Market dimension.
• Number of pieces of equipment under maintenance per worker.
• Effective working time. • Number of failures.
• Time to repair equipment failure.
L
ea
rn
in
g
a
n
d
g
ro
w
th
• To improve staff motivation. • To innovate in the processes and technologies. • To promote staff participation in innovation. • To improve workers’ capabilities. • Appropriate work conditions and safety. • Effectiveness of systems.• Workers abilities and ethical behaviour. • Communication. • Continuous development of human capital. • Workers satisfaction. • Level of absenteeism. • Labour cost.
• Structure and technology cost. • Number of training hours per worker. • Workers seniority.
V
IS
IO
N
To be recognised by our internal and external stakeholders as a leading organisation in service excellence, capable of offering unique solutions, with high standards of safety, comfort, dependability and technology.11 With regards to the BSC presented in Figure 2, it is important to emphasise that the identification of strategic objectives and critical success factors was exhaustive, from the perspective of the company. However, the indicators proposed were chosen subject to reliable data availability at the delegation level. In this respect, there were other indicators that would have been useful to include but could not be considered at this stage, because the data was not available. For example, partnerships, capacity of negotiation and market dimension were identified as critical success factors, from the perspective of internal processes, but no reliable data was collected at the delegation level regarding these factors. In many cases, the data was only collected for the company as a whole, and not for each individual delegation. Revised performance assessment frameworks should be used once this data becomes available.
3.2 Integration of DEA with the BSC
Following the development of the strategic map and of the BSC for the department, several formal and informal meetings with directors of the department took place to discuss the appropriate DEA models for each one of the four perspectives of the BSC. These models are important to compare the performance of the various delegations in the department of EM, and will be discussed in what follows.
3.2.1 DEA models
Figure 3 presents the final DEA models developed for the department of EM. These models assumed an output orientation and were computed under the assumption of variable returns to scale (VRS). The mathematical formulation of the DEA models used can be found in the Appendix. Following discussions with directors of the department of EM, it was considered that ratios should be used in all DEA models. These are the indicators currently adopted by the company and are considered to best capture the degree of achievement of the different strategic objectives in each one of the four perspectives. In this respect, in our DEA models, all the inputs and outputs are represented as a ratio per piece of equipment. Our choice of a VRS assumption is consistent with the publication of Hollingsworth and Smith [42], which warns that when ratios are used, the CCR formulation [1] is technically incorrect and should be rejected in favour of the BCC formulation [43]. According to Hollingsworth and Smith [42], the BCC formulation guarantees that comparison of the DMUs is made by interpolation only, ruling out unfeasible extrapolations.
For the four perspectives, it was considered more appropriate to run models oriented to outputs because each delegation has the capacity to control all the output measures chosen. Furthermore, an output orientation allows an assessment of how successful each delegation is in achieving the objectives of each one of the BSC perspectives. Nevertheless, in order to assess the sensitivity of the results to the orientation chosen, we have also run the models for the four perspectives with an input orientation. A discussion of the sensitivity of the results to the model orientation is also included.
12 Figure 3 – DEA models for the department of EM
* Undesirable output, subject to the following transformation: Y~ro =
(
MaxYrj)
−Yro+c. This transformation follows the suggestion of Dyson et al. [45].a
Variable subject to the following transformation: . This transformation follows the suggestion of Ali and Seiford [46] in order to eliminate negative values.
The four models developed are interconnected following the cause and effect relationships hypothesised in the BSC literature. In this respect, it is important for the department to improve its performance in the learning and growth perspective as this enables the department to improve its internal processes, which in turn enables improvements in customer satisfaction and subsequently creates desirable results in the financial perspective.
This integration follows the DEA network approach [14], where the outputs of one BSC perspective are considered as inputs for the following perspective. In our application of network DEA, no imposition is made on the weights associated with the same factor in different stages of the process. This flexibility contrasts with the relational approach to model network systems, as proposed by Kao [44]. In the relational approach the underlying assumption is that the weight associated with a particular factor should remain constant no matter whether it is an output or an input. It is our conviction that giving the units flexibility to choose the weight structure of the factors in each one of the perspectives is more appropriate because the production tradeoffs in one perspective do not need to coincide with the tradeoffs in another perspective. For example, the weights of the outputs in the learning and growth perspective represent production tradeoffs
(
MinY)
Y cabs
Y~ro = rj + ro +
1- Labour costs per piece of equipment
2- Structure and technology costs per piece of equipment 1- Number of training hours per piece of equipment
2- Number of effective working hours per piece of equipment 1- Number of reported malfunctions per piece of equipment* 2- Idle time per piece of equipment*
1- Rate of variation in the n.º of pieces of equipment under maintenancea 2- Number of customer complaints per equipment*
1- Earnings per piece of equipment 2- Working capital per piece of equipment*
Learning & Growth Perspective Model 1 Internal Processes Perspective Model 2 Customer Perspective Model 3 Financial Perspective Model 4
VISION AND STRATEGY
Outputs Inputs Outputs Outputs Inputs Inputs Outputs Inputs
13 in a transformation process with the inputs of this perspective. When these outputs are used as inputs to the internal processes model their weights will reveal tradeoffs as they relate to the outputs of the internal processes perspective. In this respect, in our case study, the weight structure of the outputs from one perspective is not imposed to be the same as the weight structure of the inputs to the following perspective.
The first model developed captures the learning and growth perspective by including two inputs and two outputs. This perspective identifies the infra-structure necessary to create long-term growth and development [21]. The outputs chosen are proxies for the main objectives of the department for this perspective. According to the BSC of the department (Figure 2), the main objectives for this perspective are to improve staff capabilities and motivation and to innovate in terms of processes and technology. The first output, number of training hours per piece of equipment, captures the investment made in employee re-skilling. The second output chosen captures employee motivation; it represents the average number of effective working hours per piece of equipment (the absenteeism hours have been removed). We have attempted to include another output measure capturing the effectiveness of information technology and systems. However, we were unable to obtain appropriate data for this output. The two inputs chosen capture all the resources allocated to each piece of equipment under maintenance. The first input used is the average labour cost per piece of equipment under maintenance and the second input used is the average structure and technology cost per piece of equipment under maintenance. A separation between labour and capital was considered useful in order to allow for the substitution between these two types of resources.
The second model developed captures the performance from the perspective of internal processes. In this perspective we should include indicators of the critical processes the organisation must excel at [21]. In this department the critical processes relate to preventative maintenance, quality control and corrective maintenance (please refer to Figure 1). The quality of the maintenance provided can be assessed through indicators such as: the number of reported malfunctions and the speed in correcting reported malfunctions. The DEA model developed for this perspective includes two outputs that capture these critical measures: Average number of reported malfunctions per piece of equipment and average idle time per piece of equipment. Both of these indicators represent undesirable outputs, which should be minimised. In that respect, and following the suggestion of Dyson et al. [45], we have transformed these outputs by using the following expression:
Y
ro=
(
Max
Y
rj)
−
Y
ro+
c
~
. In this
expression, Y~ro is the transformed value for output r of DMU0, Yrj is the original value of output
r for DMUj, Y is the original value for output r of DMUro 0 and c is a constant. The two inputs included are the outputs in the learning and growth model and represent the resources allocated to develop the critical internal processes in this organisation. Also here, had data been available, it would have been appropriate to include an input measure capturing the effectiveness of information technology and systems.
14 The third model developed captures the customer perspective by including two inputs and two outputs. This perspective captures the attributes that organisations provide through their products and services in order to promote customer loyalty and satisfaction [21]. For this department, it is very important to achieve high customer satisfaction and to increase market share (please refer to Figures 1 and 2). In this respect, the two outputs chosen aim to proxy customer loyalty and satisfaction. The first output used is the rate of variation in the number of equipments under maintenance, which captures both customer retention and new customer acquisition. A transformation was undertaken in this measure in order to ensure that no negative values were present. Following Ali and Seiford [46], this output was transformed using the following expression:
Y
~
ro=
abs
(
Min
Y
rj)
+
Y
ro+
c
. In this expression, Y~ro is the transformed value for output r of DMU0 and Yrj is the original value of output r for DMUj, Y is rothe original value for output r of DMU0 and c is a constant. The second output considered captures customer satisfaction by considering the number of customer complaints per piece of equipment. The number of customer complaints is an undesirable output, which should be minimised. In that respect, we have also transformed this output by using the suggestion of Dyson et al. [45]. The two inputs included constitute the basis for customer loyalty and satisfaction and are the outputs from the internal processes perspective, after the transformation discussed above. The first input represents the difference between the maximum number of reported malfunctions for the company and that observed in the delegation under analysis. The second input was constructed using a similar transformation for the idle time per piece of equipment. In this respect, greater values for these inputs represent greater quality of the internal processes and should lead to higher customer satisfaction and higher market share. The fourth and last model developed captures the financial perspective and is intended to answer to the interests of shareholders. The ultimate strategic objectives of this organisation are to grow, to be profitable and to provide value for its shareholders (please refer to Figures 1 and 2). In this respect, the first output included is the average amount of earnings per piece of equipment. In parallel, in order to optimise asset utilisation, it is considered important to reduce the amount of working capital necessary to support a given volume of equipment under maintenance. To capture this objective, we have included the working capital per piece of equipment as an output. From a financial perspective, this is, however, an undesirable output, which had to be transformed by following the procedures explained above. The two inputs used in this perspective are the outputs of the customer perspective: rate of variation in the number of pieces of equipment under maintenance and average number of customer complaints per piece of equipment, after the transformations previously described. The first input suffered a transformation in order to be strictly positive, and the second input suffered a transformation in order to be a ‘desirable input’. In each one of the inputs, after the transformation, we have a measure whose increase should lead to an increase in the output measures. In this respect, this last model assesses how successful a delegation is in transforming an established customer image into maximum return on invested capital.
15 3.2.2 The data
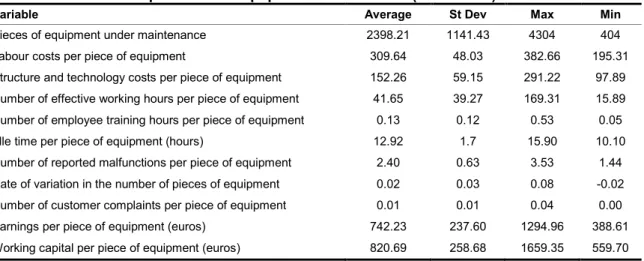
There are 15 regional delegations in the EM department and, in the first stage, we ran the DEA models with all the delegations. Investigation of the results led to the identification of an outlier delegation as it presented exceptionally low scores in two of the performance dimensions. Informal conversations with the directors of the department confirmed that this delegation was different from the remaining 14 delegations because of its extremely unfavourable location. In face of this fact, we decided to exclude this unit from the comparison and re-run the models with the remaining 14 delegations, which were considered homogeneous. Table 2 presents the descriptive statistics for the variables used in the four DEA models for the 14 delegations of the EM department relative to the year 2007. This table shows very clearly that these regional delegations vary considerably in size. The number of pieces of equipment under maintenance varies from 404 to 4304. The working capital and labour per piece of equipment, the number of reported malfunctions per piece of equipment and the average time taken to repair reported malfunctions also vary substantially, suggesting that there is scope for learning between the delegations.
Table 2 - Descriptive statistics of data for 14 delegations of the department of Equipment Maintenance (Year: 2007)
Variable Average St Dev Max Min
Pieces of equipment under maintenance 2398.21 1141.43 4304 404
Labour costs per piece of equipment 309.64 48.03 382.66 195.31
Structure and technology costs per piece of equipment 152.26 59.15 291.22 97.89 Number of effective working hours per piece of equipment 41.65 39.27 169.31 15.89 Number of employee training hours per piece of equipment 0.13 0.12 0.53 0.05
Idle time per piece of equipment (hours) 12.92 1.7 15.90 10.10
Number of reported malfunctions per piece of equipment 2.40 0.63 3.53 1.44 Rate of variation in the number of pieces of equipment 0.02 0.03 0.08 -0.02 Number of customer complaints per piece of equipment 0.01 0.01 0.04 0.00
Earnings per piece of equipment (euros) 742.23 237.60 1294.96 388.61
Working capital per piece of equipment (euros) 820.69 258.68 1659.35 559.70
3.2.3 Results
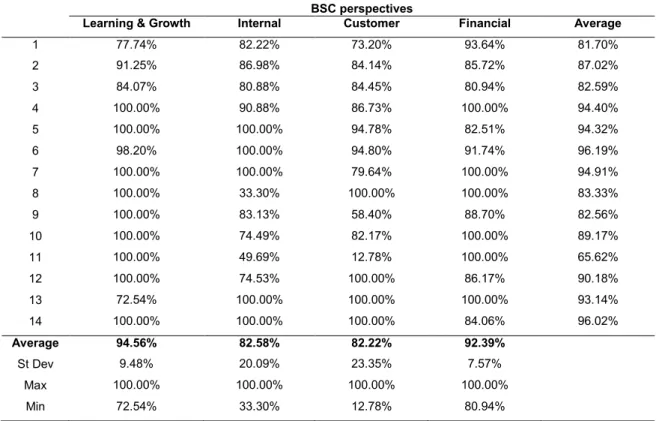
The four DEA models presented in Figure 3 above were run following the BCC formulation, with output-orientation, in order to obtain relative performance scores for each of the 14 delegations compared. Input-oriented models were also run for sensitivity analysis. The software used to run the various DEA models was Performance Improvement Management software, developed by Emrouznejad and Thanassoulis [47]. Table 3 presents the performance scores obtained for the various delegations of the department of Equipment Maintenance, based on output oriented models. These scores are then displayed in a radar graph (Graph 1) in order to facilitate the visualisation of the tradeoffs between the scores obtained in each of the BSC perspectives. Table 4 presents, in turn, the benchmarks for each delegation and Tables 5A and 5B present the virtual inputs and outputs which form the basis for the performance scores obtained. These
16 results were presented to the heads of department and a workshop was undertaken to discuss their validity and usefulness. In general terms, the results were considered an appropriate representation of the performance of the delegations. In particular, the DMUs considered as good performers (DMU 4, DMU 6 and DMU 7) present, in fact, good results in the DEA analysis. With regards to the results for each one of the four perspectives, some of these results were, however, a surprise to the directors.
Table 3 – Performance scores for the department of Equipment Maintenance BSC perspectives
Learning & Growth Internal Customer Financial Average
1 77.74% 82.22% 73.20% 93.64% 81.70% 2 91.25% 86.98% 84.14% 85.72% 87.02% 3 84.07% 80.88% 84.45% 80.94% 82.59% 4 100.00% 90.88% 86.73% 100.00% 94.40% 5 100.00% 100.00% 94.78% 82.51% 94.32% 6 98.20% 100.00% 94.80% 91.74% 96.19% 7 100.00% 100.00% 79.64% 100.00% 94.91% 8 100.00% 33.30% 100.00% 100.00% 83.33% 9 100.00% 83.13% 58.40% 88.70% 82.56% 10 100.00% 74.49% 82.17% 100.00% 89.17% 11 100.00% 49.69% 12.78% 100.00% 65.62% 12 100.00% 74.53% 100.00% 86.17% 90.18% 13 72.54% 100.00% 100.00% 100.00% 93.14% 14 100.00% 100.00% 100.00% 84.06% 96.02% Average 94.56% 82.58% 82.22% 92.39% St Dev 9.48% 20.09% 23.35% 7.57% Max 100.00% 100.00% 100.00% 100.00% Min 72.54% 33.30% 12.78% 80.94%
According to the directors’ perception, the department, as a whole, should demonstrate relatively high levels of performance from a financial, customer and learning and growth perspective. Furthermore, it was expected that the perspective of internal processes and in particular some delegations (e.g. DMU 8 and DMU 11) would require particular attention. The results obtained are partially consistent with these perceptions.
As can be seen from Table 3, the results reveal that, in global terms, the perspective of internal processes requires special attention, with an average score of 82.58%. Furthermore, the two delegations identified by the directors as more problematic in terms of internal processes (i.e. DMU 8 and DMU 11), present, in our analysis, the lowest scores. Also, consistent with the directors’ perception, the learning and growth perspective presents high levels of performance, with an average score above 94%.
However, the levels of performance observed in the financial and customer perspectives were poorer than those anticipated by the directors. Furthermore, the high level of discrimination in the results obtained in these two perspectives, with some delegations
17 presenting relatively low levels of performance, had not been anticipated. This is the case, for example, of DMUs 3 and 11, which present the lowest scores in the financial and customer perspectives, respectively, indicating considerable scope for improvement.
Graph 1 – Performance scores for the four perspectives of the BSC
Table 4 – Benchmarks for each delegation
DMU Benchmarks
Learning and Growth Internal Customer Financial
1 DMU 4 DMU 7 DMU 12 DMU 5 DMU 6 DMU 13 DMU 14 DMU 12 DMU 14 DMU 7 DMU 10 DMU 11 2 DMU 4 DMU 7 DMU 11 DMU12 DMU 5 DMU 6 DMU 13 DMU 14 DMU 13 DMU 14 DMU 4 DMU 11
3 DMU 9 DMU 11 DMU 7 DMU 13 DMU 14 DMU 13 DMU 14
4 4 DMU 5 DMU 6 DMU 13 DMU 14 DMU 4 DMU 11
5 DMU 9 DMU 11 DMU 12 5 DMU 13 DMU 14 6
6 DMU 4 DMU 7 DMU 11 DMU12 6 DMU 13 DMU 14 DMU 4 DMU 11
7 3 DMU 13 DMU 14 DMU 4 DMU 11
8 3 DMU 6 1 2
9 0 DMU 5 DMU 7 DMU 12 DMU 14 0
10 2 DMU 5 DMU 7 DMU 12 DMU 14 DMU 7 DMU 10 DMU 11
11 0 DMU 6 DMU 8 DMU 12 3
12 5 DMU 6 DMU 13 DMU 14 4 9
13 5 4 6 DMU 4 DMU 10
14 DMU 4 DMU 11 DMU 12 4 9 0
Note: The information given in this Table can be interpreted as follows. For a DMU which is inefficient regarding a particular perspective, the benchmarks for learning are indicated. For a DMU that is efficient regarding a particular perspective, the number that is indicated represents the number of delegations for which this unit is a benchmark. For example, Delegation 14 is inefficient in terms of the learning and growth perspective, and its benchmarks for learning are Delegations 4, 11 and 12. However, in terms of the other three perspectives, this delegation was classified as efficient and can perform as a benchmark to other delegations. In terms of the internal perspective, it is a benchmark to 4 delegations, in terms of the customer perspective it is a benchmark to 9 delegations and in terms of the financial perspective, there is no delegation to which it is a benchmark. This is what is known in the DEA literature as a case of “improper envelopment”, in which a DMU is classified as efficient without any unit for comparison.
0% 20% 40% 60% 80% 100% 1 2 3 4 5 6 7 8 9 10 11 12 13 14
Learning &
Growth
Internal
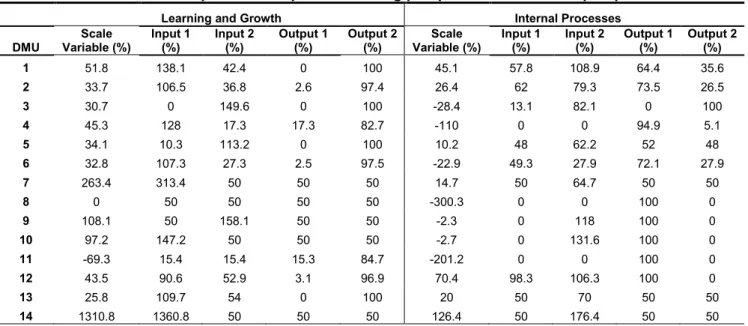
18 The directors were also interested in examining the implicit weighting structure used by the delegations in each one of the perspectives (please refer to Tables 5A and 5B). Some interesting aspects were observed. For example, from an internal perspective, it was possible to identify that a large majority of delegations appear to focus on the number of reported malfunctions per piece of equipment, placing a very small weight on the average idle time per piece of equipment. The only exceptions are DMUs 3, 5, 13 and 14, which are very effective in fixing reported failures. Further investigation of the internal processes in use in some of the delegations was considered necessary to improve the quality of the services provided.
Table 5A – Virtual inputs and outputs – Learning perspective and internal perspective
Learning and Growth Internal Processes
DMU Scale Variable (%) Input 1 (%) Input 2 (%) Output 1 (%) Output 2 (%) Scale Variable (%) Input 1 (%) Input 2 (%) Output 1 (%) Output 2 (%) 1 51.8 138.1 42.4 0 100 45.1 57.8 108.9 64.4 35.6 2 33.7 106.5 36.8 2.6 97.4 26.4 62 79.3 73.5 26.5 3 30.7 0 149.6 0 100 -28.4 13.1 82.1 0 100 4 45.3 128 17.3 17.3 82.7 -110 0 0 94.9 5.1 5 34.1 10.3 113.2 0 100 10.2 48 62.2 52 48 6 32.8 107.3 27.3 2.5 97.5 -22.9 49.3 27.9 72.1 27.9 7 263.4 313.4 50 50 50 14.7 50 64.7 50 50 8 0 50 50 50 50 -300.3 0 0 100 0 9 108.1 50 158.1 50 50 -2.3 0 118 100 0 10 97.2 147.2 50 50 50 -2.7 0 131.6 100 0 11 -69.3 15.4 15.4 15.3 84.7 -201.2 0 0 100 0 12 43.5 90.6 52.9 3.1 96.9 70.4 98.3 106.3 100 0 13 25.8 109.7 54 0 100 20 50 70 50 50 14 1310.8 1360.8 50 50 50 126.4 50 176.4 50 50
Note: The reciprocal of the sum of the virtual weights adjusted by the scale factor corresponds to the DEA score presented in Table 3.
Table 5B – Virtual inputs and outputs – Customer perspective and financial perspective
Customer Financial DMU Scale Variable (%) Input 1 (%) Input 2 (%) Output 1 (%) Output 2 (%) Scale Variable (%) Input 1 (%) Input 2 (%) Output 1 (%) Output 2 (%) 1 -124.7 0 11.9 0 100 -99 7.8 0 35.8 64.2 2 -109.8 0 9.1 0 100 -97.2 19.4 0 0 100 3 -109.8 0 8.6 0 100 -103.6 20 0 0 100 4 -115.3 0 0 1.8 98.2 -86.3 6.9 6.9 6.9 93.1 5 -105.5 0 0 0.9 99.1 -108.7 12.5 0 0 100 6 -97.2 0 8.3 0 100 -102.1 6.9 0 0 100 7 -125.6 0 0 2.9 97.1 -65.5 17.3 17.3 82.7 17.3 8 335.9 50 385.9 50 50 -79.3 10.3 10.3 89.7 10.3 9 -157.3 0 13.9 0 100 -102.3 10.4 0 39.2 60.8 10 -114.3 0 7.4 0 100 -87.4 6.3 6.3 32.9 67.1 11 932.5 0 1714.7 100 0 0 50 50 50 50 12 5 50 55 50 50 -116.1 0 0 19.1 80.9 13 -99.8 0.1 0.1 0.1 99.9 21130.8 21180.8 50 50 50 14 183.4 50 233.4 50 50 -119 0 0 0 100
19 In depth analysis of the weight structure of each variable under different perspectives can also bring insightful information for management. As expected, it is interesting to note how the same variable may present different weights, depending on the perspective taken. For example, output 2 for the internal perspective (idle time per piece of equipment) has zero weight for DMUs 8 through 12 but under the customer perspective input 2 (which is the same variable: idle time per piece of equipment) appears to be favoured relative to input 1 (number of reported malfunctions per piece of equipment). This reflects different implicit production trade-offs involved in each perspective.
From the point of view of the department, it is also interesting to explore the individual performance results for each one of the delegations. There was an implicit belief in the department that the majority of the delegations would present similar scores in the various performance dimensions. However, the results obtained show that this is not the case. This was also confirmed by the Spearman correlation coefficient which has shown that the relationships between the ranks obtained in the four performance perspectives are not statistically significant. There is in fact just one delegation presenting an above average score in all the perspectives (DMU 4). DMU 6 and DMU 7, also perceived as very good performers by the directors, obtained above average scores in three of the perspectives, having however, scored below average in the remaining perspective. In fact, most delegations benefitted from separate analysis for each of the performance perspectives. In this respect, some delegations constituted interesting cases to explore.
For example, Delegation 11 was perceived by the heads of the department as a poor performer. In this respect, the fact that this delegation presented the lowest score in terms of internal processes was not surprising for them. However, its classification as efficient from a financial perspective was not anticipated. Further analysis of the results for Delegation 11 reveal that this delegation constitutes reference to 6 delegations in this perspective (Table 4). This good financial performance is explained by the fact that, despite having a relatively bad performance from a customer perspective, this DMU presents the highest revenue per piece of equipment in the department and one of the lowest levels of working capital per piece of equipment. However, this situation may not be sustainable as this delegation presents serious problems in terms of the quality of equipment maintenance provided, presenting the highest number of complaints per piece of equipment and the slowest correction of problems, leading to a low score in terms of internal processes. The poor performance achieved in terms of internal processes and poor customer image constitutes a warning regarding the danger of deteriorating financial performance in the near future.
Conversely, Delegation 5 is efficient from both the learning and growth perspective and the internal processes perspective, with a relatively high score in terms of the customer perspective, despite presenting a relatively low financial performance. This delegation presents relatively high costs for the revenue generated in this year. Furthermore, this delegation appears to be unable to take advantage of the relatively high volume of new equipment installed in its region by the corresponding INE delegation. Despite receiving an above average volume
20 of equipment from the corresponding INE delegation, and presenting above average customer image, this delegation presents a relatively low level of profit per piece of equipment and a relatively high working capital per piece of equipment. From a financial perspective, DMU 4 and DMU 11 constitute good references for learning, as they are able to create significantly higher levels of profit per piece of equipment with low levels of working capital.
In general, the results obtained with an input orientation are not substantially different from the ones discussed above. In particular, the relationships between the results of the four dimensions of performance are not affected – the relationships between the ranks obtained in the four performance perspectives remain not statistically significant. The impact of an input orientation is mostly visible in the Internal Processes perspective and in two different ways. Firstly, with an input orientation, all the inefficient delegations see their efficiency score decrease in the internal business processes perspective. This analysis suggests that, in this perspective, there is greater potential for radial input reduction than for radial output augmentation. These results were somehow anticipated as with the output orientation there were significant input slacks in the Internal Processes model. An input orientation translates these slacks into radial movements towards the frontier. Secondly, it is in this dimension of performance that the learning networks identified in Table 4 suffer more alterations.
The results of our analysis strongly support our claim that moving away from a unique all embracing DEA model towards multiple complementary models might provide valuable information for performance improvement. As the results indicate, even in the best performing delegations there is scope for improvement. In the same way, the results highlight that whilst some delegations might present relatively weak performances in some perspectives, they might represent important benchmarks with which to compare in others.
Furthermore, our results highlight another interesting aspect from a formative evaluation perspective: the reciprocity in learning processes. It is possible to find several delegations that whilst benefiting from the help of other delegations in some of the perspectives, constitute examples of best practice to these delegations in other perspectives. Our results show several examples of this learning reciprocity (Table 4): DMU 4 – DMU 6; DMU 4 – DMU 13; DMU 4 – DMU 14; DMU6 – DMU 11; DMU 6 – DMU 12, etc. This shows that, within a benchmarking network, learning can happen in both directions.
The advantages of modelling the dynamics of the production process by considering several interconnected models can be confirmed by contrasting the results previously discussed with those produced by a unique bridged DEA model. This bridged model incorporates the initial inputs of the process (those from the learning and growth perspective) and the final outputs of the process (those from the financial perspective). In this respect, two inputs were incorporated in this model: labour costs per piece of equipment; structure and technology costs per piece of equipment. With regards to the outputs, two measures were included: earnings per piece of equipment and working capital per piece of equipment. This bridged model does not model the transformation process explicitly, treating it as a black box, as it is common in standard DEA analysis. The results from this bridged model are presented in Table 6.
21 Table 6 – Efficiency scores for the bridged model for the department of EM
DMU Efficiency Score (%) Scale Variable (%) Input 1 (Virtual %) Input 2 (Virtual %) Output 1 (Virtual %) Output 2 (Virtual %) Benchmarks 1 89.96 -67.9 41.4 1.9 8.9 91.1 4 (0.33) 7 (0.26) 10 (0.27) 14 (0.13) 2 90.14 -73.7 31.1 6.1 0 100 7 (0.33) 10 (0.52) 14 (0.15) 3 85.01 -111.3 0 6.3 0 100 4 (0.09) 10 (0.91) 4 100.00 -87.1 6.5 6.5 6.5 93.5 5 5 84.78 117.2 0 235.1 0 100 9 (0.2) 10 (0.8) 6 86.09 -77.4 33.9 4.9 0 100 4 (0.14) 10 (0.84) 14 (0.02) 7 100.00 0 50 50 50 50 4 8 77.33 -129.3 0 0 37.9 62.1 7 (0.93) 10 (0.07) 9 100.00 425.6 50 475.6 50 50 9 10 100.00 -62.1 19 19 19 81 8 11 91.94 -102 0 6.8 0 100 4 (0.21) 10 (0.79) 12 91.34 -74.4 31 4 0 100 4 (0.01) 10 (0.87) 14 (0.12) 13 42.06 -237.8 0 0 100 0 7 (1.00) 14 100.00 494.6 544.6 50 50 50 4 Average 88.48 St Dev 15.19 Min 42.06 Max 100.00
It is possible to verify that this bridged model hides crucial information for performance improvement, both for delegations characterized as efficient and for those characterized as inefficient. This bridged model fails to tell the story of how the processes in each part of the organisation contribute to its relative lack of success. For the delegations characterized as efficient it hides the fact that there are some ‘problematic’ areas in which they should focus their attention. For the delegations characterized as inefficient it fails to identify areas of good practice, whose structures and mechanisms should be identified and disseminated to other delegations. For these relatively inefficient delegations it also fails to identify the areas that demand closer attention and which specific peers can support the learning for performance improvement in these areas.
The development of multiple performance assessment models in order to capture the weaknesses and the strengths of each organisation and identify and promote learning networks is, therefore, a major strength of the framework we propose in this paper. Had we adopted a single DEA model capturing all the BSC perspectives, as has been suggested by some of the previous studies in this area, or a bridged model following a standard DEA approach, some of this very valuable information would have been missed.
3.2.4. What can be learnt from this implementation in practice?
This implementation took place during a two year period (2008 and 2009) and now, more than one year has passed since the project was finished. Considering that the main purpose of this research project was to evaluate the potential of DEA, when combined with BSC, to contribute
22 to organisational learning and performance improvement, it is important to report on the impact of this project in this organisation. Furthermore, despite the small number of DMUs involved in the study, in the spirit of what has been recommended by Cooper [6], it is also relevant to take a step back and make a tentative assessment regarding some lessons that can be drawn from this case study regarding the usefulness of DEA and regarding its successful application in practice.
In terms of the practical impact of this study, from the perspective of the directors of the company, this project has led to several brainstorming sessions inside the company which raised a number of relevant issues, having contributed to the reorganization of some of the processes and mechanisms within the company. The first practical implication of this project related to the revision of the data collection systems. The development of the Strategic Map and the BSC highlighted the need to collect new data for some indicators of performance. Some of the indicators data was not collected at all, and other indicators data was only collected for the company as a whole, and not for each individual delegation. Revised data collection systems are already in place in the company and in the near future it will be possible to include other measures in the performance assessment framework. An example of the revision that has taken place relates to the satisfaction questionnaires sent to the customers. Before, the information gathered from these questionnaires was only analysed for the company as a whole. Now, the information gathered in these questionnaires is also analysed at the level of the delegation and there is timely feedback to each delegation, requesting corrective action when necessary. This type of information has been useful to identify the main reasons why some delegations appear to have such a poor customer image.
Another practical implication of this project related to the development of a system for a more focused analysis of performance data. This company works with a very long list of performance indicators (a list of more than a hundred indicators defined by the multinational head quarters). It was felt that the development of a strategic map and a BSC for the company was a significant contribution, as it provides the basis for more focused analysis of performance and for an easier identification of some of the potential sources of problems. Moreover, the combination of the BSC framework with benchmarking analysis undertaken with DEA was considered to be helpful to consolidate the performance results into a few manageable scores and, above all, to identify appropriate learning networks. This was the piece of information that was considered by the director of the company as the most useful part of the DEA results.
It is important to recognise, however, that the DEA results have left some questions unanswered. Furthermore, they have raised a number of new questions, whose answers only those involved in the service can appropriately provide. This is the reason why we agree that the establishment of learning networks between the different delegations can bring interesting insights. As reported in other formative evaluation studies undertaken with DEA (see for example, [40] and [48]), the application of this method in practice raises a number of questions whose resolution requires careful consideration, with the close involvement of the practitioners. Examples of these issues are identification of the inputs and outputs, the transformation of the