Universidade Federal de São Carlos
Centro de Ciências Biológicas e da Saúde
Programa de Pós-Graduação em Ecologia e Recursos Naturais
A
DIVERSIDADE DE INSETOS MADÍCOLOS EM MONTANHAS
DE
M
ATA
A
TLÂNTICA
:
UMA ABORDAGEM ECOLÓGICA E
TAXONÔMICA
Erika Mayumi Shimabukuro
Tese apresentada ao Programa de
Pós-Graduação em Ecologia e Recursos
Naturais do Centro de Ciências
Biológicas e da Saúde da Universidade
Federal de São Carlos
–
UFSCar, como
parte dos requisitos para obtenção do
Título de Doutor em ciências, área de
concentração em Ecologia e Recursos
Naturais.
Orientadora: Prof. Dr. Susana Trivinho Strixino
Universidade Federal de São Carlos
Centro de Ciências Biológicas e da Saúde
Programa de Pós-Graduação em Ecologia e Recursos Naturais
A
DIVERSIDADE DE INSETOS MADÍCOLOS EM
MONTANHAS DE
M
ATA
A
TLÂNTICA
:
UMA
ABORDAGEM ECOLÓGICA E TAXONÔMICA
Erika Mayumi Shimabukuro
Orientadora: Susana Trivinho Strixino
“I have no special talent. I am only passionately curious”
AGRADECIMENTOS
Gostaria de agradecer em primeiro lugar à Prof. Susana, que acreditou desde o início no projeto que propus, e que aceitou me orientar mesmo sem me conhecer o suficiente.
Muito obrigada pela confiança e por todos os ensinamentos, acadêmicos e “não
-acadêmicos”, que levarei para sempre comigo.
Agradeço também à Prof. Alaíde, que sempre esteve presente, se dispondo para ajudar toda vez que necessário, e à Prof. Lívia, que mesmo tendo chegado recentemente, me deu muita força e incentivo nos últimos meses.
Não posso deixar de agradecer aos meus pais (Hilomi Shimabukuro e Antônio Shimabukuro), que nunca pouparam esforços para que eu chegasse até aqui, e que sempre me apoiaram em todas as decisões. Pai, sua força e coragem serão sempre minha maior inspiração. Sei que estará para sempre ao meu lado, comemorando cada conquista e me dando forças para nunca desistir.
Ao meu irmão, com quem posso contar sempre. Obrigada por todo apoio.
Ao meu maior companheiro, Gilmar, por me incentivar a cada passo que dou; por ouvir minhas reclamações; por me dar soluções; por me acompanhar sempre!
Ao Prof. Raoul Henry por todos os ensinamentos e contribuições que foram base para a minha formação acadêmica.
Ao Mateus Pepinelli, pela parceria nas montanhas, por me familiarizar com os habitats higropétricos e me apresentar aos Podonomus. Obrigada também pelas contribuições no manuscrito de descrição de Podonomus desta tese.
À Márcia Thais Suriano, cujo material coletado no doutorado pôde ser utilizado no presente estudo, compondo as descrições de novas espécies de Pseudochironomus de elevada altitude. Igualmente, agradeço ao Fábio de Oliveira Roque, Tadeu Siqueira e Mateus Pepinelli, por terem me inspirado ao estudo de ecossistemas de montanhas e
por terem garantido uma boa coleção de referência de Chironomidae ‘de altitude’ no
laboratório, a qual também pôde ser utilizada nesta tese.
Agradeço também ao Instituto Nacional de Pesquisas da Amazônia (INPA), ao Instituto Chico Mendes de Conservação da Biodiversidade (ICMBio), ao Comando Militar da
Amazônia e à Grifa Filmes, por terem colaborado com a expedição: “Biodiversity of the Serra da Mocidade”. Por meio desta pesquisa foi obtida uma espécie de Pseudochironomus, e que, por intermédio de Galileu P. S. Dantas, pôde ser utilizada neste estudo. A este agradeço também todo o apoio e incentivo.
que abriu as portas de sua casa para me auxiliar com a identificação de alguns espécimes enigmáticos do material do doutorado. Além disso, por estar sempre à disposição para conversar e tirar dúvidas sobre a taxonomia de determinados grupos. Agradeço também ao Prof. Luiz Pinho por ter me recebido em seu laboratório, compartilhado conhecimento acerca do estudo de quironomídeos, e contribuído também para a identificação de alguns Orthocladiinae presentes no meu material. Ao Prof. Dr. Andres Baselga, por ter aceitado a proposta de parceira durante o doutorado sanduíche, mas que infelizmente não pôde se desenrolar devido aos cortes orçamentários que impediram a concessão da bolsa.
Ao Victor Saito pela ajuda em uma das coletas, pela parceria e pelos vários churrascos.
Ao Danilo Naliato, que confeccionou os mapas desta tese.
Não posso deixar de agradecer também aos meus amigos de laboratório, Hugo, Luciene, Victor, Mireile, e especialmente à Roberta à Julia que foram companheiras fundamentais ao longo dessa jornada. Além destes, a todos os amigos que fiz em São Carlos, companheiros para todas as horas, e que ajudaram a tornar esses quatro anos muito mais leves e prazerosos.
Às minhas irmãs de coração, Kurau (Jésisca), Pivetti (Ana Carolina), Seu Cuka (Catarina) e Xevs (Ivana), por estarem sempre ao meu lado, me aconselhando, me apoiando, compartilhando alegrias, e ajudando a superar momentos difíceis. Obrigada por tudo!
À banca examinadora, por ter aceitado participar da defesa pública, mesmo frente à escassez de recursos atuais, e pelas sugestões e conselhos que contribuirão muito para a qualidade dos trabalhos apresentados.
Ao programa PPGERN e à CNPq pelo suporte e apoio financeiro.
SUMÁRIO
RESUMO...1
ABSTRACT...2
INTRODUÇÃO...3
PARTE I – ECOLOGIA Capítulo 1. Elevational patterns of richness: are the ends bad for madicolous insects in the Atlantic Forest? Resumo...15
Introdução...16
Material & Métodos...19
Resultados...23
Discussão...27
Referências...31
Capítulo 2. Drivers of compositional dissimilarity of madicolous insects in elevational gradients of Atlantic Forest Resumo...40
Introdução ...41
Material & Métodos...43
Resultados...45
Discussão...49
Referências...52
PARTE II - TAXONOMIA Capítulo 1. Madicolous Chironomidae (Diptera: Insecta) from Brazilian Atlantic Forest: a checklist with notes on altitudinal distribution Resumo...60
Introdução...60
Material & Métodos...62
Resultados...66
Discussão...82
Referências...86
Capítulo 2. Two new species of Podonomus (Diptera: Chironomidae: Podonominae) from mountains of southeastern Brazil Resumo...92
Introdução...92
Descrições...97
Discussão taxonômica...107
Referências...110
Capítulo 3. New species of the genus Pseudochironomus Malloch 1915 (Diptera: Chironomidae) from Brazilian highlands Resumo...112
Introdução...112
Descrições...115
Discussão taxonômica...134
Referências...138
Capítulo 4. Tanytarsini from madicolous habitats in Southeasth Brazil: new species and new records Resumo...141 Introdução...141 Descrições...143 Discussão taxonômica...146 Referências...158
CONCLUSÕES E CONSIDERAÇÕES FINAIS...161
1
RESUMO
2
ABSTRACT
Ecologists all over the world have long been interested in studying mountains. Many factors explain the importance of mountain ecosystems as models to test patterns of spatial variation of biological communities: 1. Along altitudinal gradients significant climate changes can be observed in a relatively short spatial scale; 2. Comparing to oher spatial gradients, e.g. latitude, experiments developed in mountains are easily replicable; 3. The isolation and proximity from other mountains, as well as the noticeable climatic and geologic events that they experience, ensure the high biogeographical value of mountains; 4. Mountains guarantee ideal conditions for the establishment of a remarkable biodiversity, facilitating speciation process and the survivor of rare and endemic species. Regarding these factors, the main objective of this study was to assess patterns of richness and dissimilarity variations along altitudinal gradients at Atlantic Forest from Southeast Brazil. The madicolous (hygropetric) insect community and three mountains located at Serra do Mar and Serra da Mantiqueira – compounding a gradient from 0 m to 2700 m a.s.l. 0 were the study object of this work. At the first part of the
thesis (ecologic approach), important hypotheses of richness and dissimilarity’ variations along altitudinal gradients have been tested: 1 Rapoport’s effect; 2. Spatial
effect; 3. Environmental control; 4. “Mountain Passes are Higher in the Tropics”; 5.
Source-sink dynamics. As madicolous habitats shelter a peculiar fauna of insects, and poorly addressed in literature, in the second part of the thesis (taxonomic approach), a checklist of all madicolous Chironomidae recorded here is presented. In addition, new species belonging to three Chironomidae genera are described and new records were evidenced. Madicolous insects are extremely diverse, and most of the taxa that compound it are the same found in insect community from streams. A significant variation of richness and dissimilarity have been observed along the gradients analyzed,
and further, this variables showed deeply related to the gradients’ altitude. Regarding
3
INTRODUÇÃO
Os habitats higropétricos (Thienemann, 1905) ou madículos (do latim madidus: úmido, molhado) são aqueles formados por um filme de água com menos de 2 mm de espessura que percorre superfícies rochosas (Vaillant, 1956). Essas lâminas d’água
podem ser mantidas pelo afloramento de água diretamente das lajes rochosas ou formadas nas margens de córregos a partir do constante umedecimento pela corrente
principal (“splash zones”) (Ward, 1992). Esse ambiente confere condições ideais para a colonização de briófitas, algas, ou até mesmo plantas vasculares, e, consequentemente, favorecem o desenvolvimento de uma rica e peculiar fauna invertebrada (“madícola”)
de rápida colonização, alto grau de endemismo e algumas espécies raras (Spangler, 1972). A fauna madícola é dominada pelos insetos (Oliver & Sinclair, 1989; Ward, 1992; Sinclair & Marshall, 1987; Sinclair & Saigusa, 2002). Embora alguns grupos de Coleoptera, como Hydrophilidae, e alguns Trichoptera sejam muito recorrentes nesses ambientes, a ordem Diptera costuma ser a mais representativa, com destaque para algumas famílias, como Tipulidae (Sinclair, 1988), Psychodidae, Stratiomyidae, Dixidae e Chironomidae (Hynes, 1972; Pinder, 1995). Entretanto, esse tipo de ambiente está entre os habitats menos estudados nas regiões temperadas e tropicais, tanto em abordagens ecológicas quanto faunísticas (Isaia et al., 2009).
Embora muitos organismos possam ser encontrados nesses habitats, a minoria é estritamente higropétrica (eumadícolos) (Ward 1992). Em uma lista de 47 espécies de Chironomidae, catalogadas por Oliver e Sinclair (1989), de ambientes madícolos Holárticos, apenas quatro eram restritos ao habitat e pertencentes aos gêneros Limnophyes, Orthocladius, Syndiamesa e Hudsonimyia. A associação de Hudsonimyia, pertencente à subfamília Tanypodinae, com esse tipo de biótopo foi também exatltada por Roback (1979). No Brasil, o primeiro registro em habitat higropétrico pertencente a este gênero foi Hudsonimyia araxa Silva, Wiedenbrug, Trivinho-Strixino, Oliveira & Pepinellicujas larvas foram coletadas em rochas cobertas por algas, musgos e detritos, em regiões montanhosas do estado de São Paulo e Minas Gerais (Silva et al., 2012).
4
região serrana de Santa Catarina, Limnophyes guarani Pinho & Andersen (Pinho & Andersen, 2015), também em associação com habitats madícolos. Assim, a importância taxonômica dos ambientes higropétricos vem sendo gradativamente ressaltada à medida que novas espécies e novos registros são reportados. Contudo, abordagens ecológicas que utilizam habitats madícolos como modelo para avaliação de hipóteses são, até onde sabemos, inexistentes.
Descobrir e entender padrões ecológicos em função de gradientes ambientais e geográficos sempre foi um assunto de grande interesse nos estudos envolvendo comunidades biológicas. As alterações na biodiversidade podem ser explicadas por múltiplos fatores intimamente dependentes da escala espacial (Whittaker et al., 2001; Hawkins et al., 2003; Rahbeck, 2005; Heino, 2009). Dentre os padrões observados em larga escala geográfica, a redução da diversidade biológica da região equatorial em direção aos pólos do planeta, por exemplo, destaca-se como um dos mais difundidos e fundamentais em ecologia e biogeografia (Willig et al., 2003; Brown & Lomolino, 1998; Baselga, 2008, 2010). Apesar disso, a variação da diversidade em função de gradientes altitudinais parece não seguir uma tendência tão clara (Jacobsen et al., 2004). A redução da riqueza conforme o aumento da altitude já foi constatada por estudos realizados em ambientes terrestres (Rahbeck, 1995; Bruhl et al., 1999; Escobar et al., 2007) e aquáticos (Rautio, 1998; Jacobsen et al., 1997; Lencioni et al., 2011; Wang et al., 2011). Há ainda muitas evidencias de que nas altitudes intermediárias ao longo de um gradiente altitudinal podem ser encontrados os maiores valores de riqueza de espécies (Colwell & Hurtt, 1994; Holloway, 1987; Bachman et al., 2004; Tilman, 1982, Rahbek 1997; Rozensweig, 1995; Kessler 2000). Esse padrão unimodal pode ser resultante de puro efeito geométrico, o chamado MDE –“mid-domain-effect” (Colwell
& Hurtt, 1994; Holloway, 1987; Bachman et al., 2004), ou relacionada a fatores ambientais, como por exemplo, a produtividade (Tilman, 1982, Rahbek 1997; Rozensweig, 1995; Kessler 2000).
Jacobsen et al. (2004) sugere algumas importantes razões que explicam a inexistência de um consenso na relação riqueza e altitude para insetos aquáticos; dentre elas destacam-se: 1. Muitos estudos têm enfocado em apenas uma determinada ordem taxonômica, o que não permite a extrapolação do padrão encontrado para toda a comunidade; 2. Evidentes relações com a altitude não podem ser esperadas de casos em que a variação da altitude não ultrapasse 500 m; 3. Áreas de estudo que envolvam
5
mascarar o efeito da altitude; 4. O gradiente longitudinal de riqueza ao longo de um mesmo riacho pode camuflar o efeito da altitude devido a diferenças existentes entre os habitats de rhithron e potamon; 5. Impossibilidade de se obter conclusões claras quando, por dificuldades taxonômicas, os espécimes não podem ser identificados em nível específico. Portanto, todas estas questões foram levadas em conta ao se testar a relação entre a riqueza de espécies e o gradiente de altitude no presente estudo.
Diferentemente de ambientes lóticos que possuem relativamente grandes dimensões, como córregos, rios e riachos, os ambientes higropétricos podem ser considerados micro-ecossistemas; pelo fato de serem estruturalmente mais homogêneos que os habitats anteriormente citados e frequentemente isolados (Ward, 1992), os habitats madícolos seriam melhores modelos de estudo para se observar variações na comunidade habitante ao longo de gradientes altitudinais.
O estudo de gradientes altitudinais possibilita a experimentação de importantes hipóteses ecológicas que visam entender as respostas da biota frente a variações ambientais e geográficas (Darwin, 1839; Stevens, 1992; Colwell & Hurtt, 1994; Lomolino, 2001; Rahbek, 1997, 2005; Ricklefs, 2004). Além disso, a biodiversidade de montanhas há muito fascina cientistas do mundo inteiro, devido ao alto grau de endemismo e estratégias morfológicas, fisiológicas e comportamentais que as espécies habitantes podem apresentar.
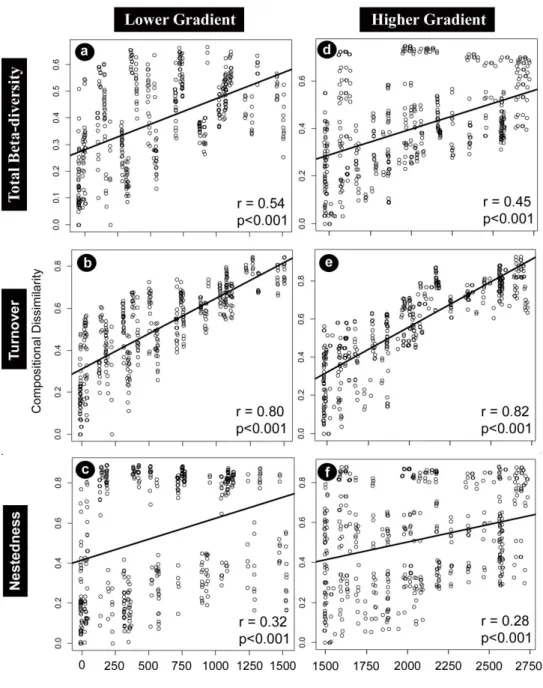
Muitos estudos em ambientes aquáticos ressaltam que importantes mudanças composicionais nas comunidades de insetos aquáticos e outros macroinvertebrados são observadas ao longo de gradientes altitudinais (i.e. diversidade beta) (Heino et al., 2015; Al-Shami et al., 2013; Wang et al., 2012; Gill et al., 2014). Além disso, o recente avanço nas propostas e abordagens relativas à diversidade beta possibilitou que investigações mais completas fossem adotadas para avaliar a similaridade na composição de espécies em função de largas escalas espaciais (Diserud and Ødegaard, 2007; Baselga & Jiménez-Valverde, 2007; Baselga, 2010; Koleff et al., 2003).
6
representam uma porção daquelas em locais mais ricos em espécies. Há, portanto, uma perda de espécies em decorrência da ordenada desagregação das comunidades, gerada por um determinado fator no gradiente. O turnover por sua vez implica na substituição de algumas espécies por outras, como consequência de fatores geográficos, históricos ou ecológicos.
De maneira geral, a dissimilaridade na composição de espécies ao longo de gradientes altitudinais é controlada por fatores ambientais, espaciais (Heino et al., 2015) e históricos (como por exemplo especiação e extinção) (Graham et al., 2006). A heterogeneidade ambiental e as taxas de dispersão são dependentes da escala espacial. Como exemplo, se a distância geográfica é grande o suficiente para impedir a dispersão, a distribuição das espécies ocorre apenas em locais próximos, independente de filtros ambientais (Heino et al., 2015). Além disso, espécies com capacidade de dispersão limitada estão mais propensas aos processos vicariantes e à extinção local (MacArthur & Wilson, 1967).
De acordo com Lobo & Halftter (2000), dois processos principais podem explicar a colonização de montanhas: 1. Horizontal, quando a colonização se dá por elementos provenientes de elevadas altitudes e 2. Vertical, quando as espécies se originam de regiões vizinhas de menor altitude. Ambos os processos dependem da orientação e da localização das montanhas, que estão relacionadas ao grau de isolamento e aos processos biogeográficos inerentes a cada formação. Estas características influenciam significantemente na capacidade de algumas montanhas servirem como refúgio e “corredores” para o estabelecimento das espécies (Lobo &
Halftter, 2000) e, em função disso, também refletem em diferentes padrões de dissimilaridade ao longo dos gradientes.
Em regiões tropicais, as espécies tendem a mostrar curtas distribuições
altitudinais, hipótese conhecida como “Mountain Passes are Higher in the Tropics”
7
A biodiversidade de montanhas representa um potencial indicador de mudanças climáticas globais. As previsões atuais sugerem que a temperatura global média pode aumentar de 2,0 a 6,0 ºC em 2100 e que as temperaturas e taxas de precipitação serão menos constantes (Garcia et al., 2014). Consequentemente a biota de montanhas está susceptível a alterações em termos de ocorrência, distribuição, diversidade genética, entre outros. Assim sendo, entender os processos que afetam essas comunidades é uma necessidade imediata para o adequado planejamento e estratégias de conservação e monitoramento. Além disso, um dos objetivos deste trabalho foi contribuir para o conhecimento da biodiversidade do bioma Mata Atlântica, um dos mais diversos e, ao mesmo tempo, mais ameaçados do mundo sendo considerado por isso um hotspot para a conservação (Myers et al., 2000).
No presente trabalho, foram estudados os insetos madícolos em três montanhas localizadas em trechos de Mata Atlântica preservada, escolhidas de forma a preencher completamente o gradiente altitudinal existente no bioma (0 m – 2700 m). A composição e abundância dos insetos imaturos foram analisadas, sempre que possível, a cada 200 metros de altitude, sendo os organismos amostrados em campo e identificados em laboratório. A família Chironomidae, a mais abundante e diversa no presente estudo, foi analisada em todos seus estágios de desenvolvimento (larva, pupa e adulto), para fins taxonômicos. Dessa maneira, a presente tese foi organizada em duas partes, a primeira com uma abordagem ecológica, no qual foram utilizados os dados com a comunidade inteira, e a segunda com uma abordagem taxonômica, no qual apenas a família Chironomidae foi analisada.
Na primeira parte busquei analisar grandes padrões de variação de riqueza e composição de insetos madícolos ao longo dos gradientes de altitude. Para isso, apresento dois capítulos, o primeiro testando três importantes hipóteses de variação de riqueza (efeito de Rapoport, efeito espacial e controle ambiental), e o segundo testando duas hipóteses de variação da composição da comunidade (MPHT e modelo “fonte -sumidouro”). Ambos os manuscritos encontram-se nas normas da revista Diversity and Distributions.
8
espécies encontradas e novos registros realizados. De forma que, no capítulo dois, duas novas espécies de Podonomus são descritas; no capítulo três, quatro espécies de Pseudochironomus são descritas; e no capítulo quatro, três novas espécies de Tanytarsus são descritas. Uma vez que os artigos ainda não foram publicados, os nomes dado às espécies são provisórios. Para os quatros capítulos desta parte, a padronização segue as normas da revista Zootaxa.
REFERÊNCIAS
AL-SHAMI S.A., CHE SALMAH M.R., AHMAD A.H. & MADRUS M.R. 2013. Biodiversity of stream insects in the Malaysian Peninsula: spatial patterns and environmental constraints. Ecological Entomology. 38: 238–249.
BACHMAN, S., BAKER, W.J., BRUMMITT, N., DRANSFIELD, J. & MOAT, J. 2004. Elevational gradients, area and tropical island diversity: an example from the palms of New Guinea. Ecography. 27: 299-310.
BASELGA, A. & JIMÉNEZ-VALVERDE A. 2007. Environmental and geographical determinants of beta diversity of leaf Beetles (Coleoptera: Chrysomelidae) in the Iberian Peninsula. Ecological Entomology 31: 312-318.
BASELGA, A. 2008. Determinants of species richness, endemism and turnover in European longhorn beetles. Ecography. 31: 263-271.
BASELGA, A. 2010. Partitioning the turnover and nestedness components of beta diversity. Global Ecology and Biogeography 19(1): 134-143.
BASELGA, A. 2012. The relationship between species replacement, dissimilarity derived from nestedness and nestedness. Global Ecology and Biogeography. 21: 1223–
1232.
BRENDONCK, L., JOCQUÉ, M., TUYTENS, K., TIMMS, B.V. & VANSCHOENWINKEL, B. 2014. Hydrological stability drives both local and regional diversity patterns in rock pool metacommunities. Oikos. 124: 741–749.
BROWN J.H. & LOMOLINO M.V. 1998. Biogeography. Sunderland. Sinauer. 2nd Ed. BRUHL, C.A., MOHAMED, M. & LINSENMAIR, K.E. 1999. Altitudinal distribution of leaf litter ants along a transect in primary forest on Mount Kinabalu, Sabah, Malaysia. Journal of Tropical Ecology. 15: 265–277.
9
DARWIN, C. 1839. Journal of the Researches into the Geology and Natural History of Various Countries Visited by H.M.S. Beagle, under the Command of Captain Fitzroy, R.N. from 1832 to 1836 . Henry Colburn, London.
DARWIN, C. 1859. On the Origin of Species by Means of Natural Selection or the Preservation of Favoured Races in the Struggle for Life . John Murray, London.
DISERUD, O.H. & ØDEGAARD, F. 2007. A multiple-site similarity measure. Biology Letters, 3: 20–22.
DOBROVOLSKI, R., MELO, A.S., CASSEMIRO, F.A.S. & DINIZ-FILHO, J.A.F. 2012. Climatic history and dispersal ability explain the relative importance of turnover and nestedness components of beta diversity. Global Ecology and Biogeography. 21: 191– 197.
ESCOBAR, F., HALFFTER, G. & ARELLANO, L. 2007. From forest to pasture: an evaluation of the influence of environment and biogeography on the structure of dung beetle (Scarabaeinae) assemblages along three altitudinal gradients in the Neotropical region. Ecography. 30: 193-208.
GARCIA RA, CABREZA M., RAHBEK, C., ARAÚJO, M.B. 2014. Multiple dimensions of climate change and their implications for biodiversity. Science 344: 1247579.
GILL, B.A., HARRINGTON, R.A., KONDRATIEFF, B.C., ZAMUDIO, K.R., POFF, N.L. & FUNK, W.C. 2014. Morphological taxonomy, DNA barcoding, and species diversity in southern Rocky Mountain headwater streams. Freshwater Science 33(1): 288–301.
HARRISON, S., ROSS, S.J. & LAWTON, J.H. 1992. Beta diversity on geographic gradients in Britain. Journal of Animal Ecology. 61: 151–158.
HAWKINS, B., FIELD, R., CORNELL, H., CURRIE, D., GUEGAN, J., KAUFMAN,
D., KERR, J., MITTELBACH, G., OBERDORFF, T., O’BRIEN, E., PORTER, E.E. &
TURNER, J.R.G. 2003. Energy, water, and broad-scale geographic patterns of species richness. Ecology. 84: 3105–3117.
HEINO, J. 2009. Biodiversity of Aquatic Insects: Spatial Gradients and Environmental Correlates of Assemblage-Level Measures at Large Scales. Freshwater Reviews. 2: 1-29.
HEINO, J. 2009. Biodiversity of Aquatic Insects: Spatial Gradients and Environmental Correlates of Assemblage-Level Measures at Large Scales. Freshwater Reviews. 2: 1-29.
10
HAMADA, N., JACOBSEN, D., LANDEIRO, V.L., LIGEIRO, R., MARTINS, R.T., MISERENDINO, M.L., MD RAWI, C.S., RODRIGUES, M.E., ROQUE, F.D.O., SANDIN, L., SCHMERA, D., SGARBI, L.F., SIMAIKA, J.P., SIQUEIRA, T., THOMPSON, R.M. & TOWNSEND, C.R. 2015. A comparative analysis reveals weak relationships between ecological factors and beta diversity of stream insect metacommunities at two spatial levels. Ecology and Evolution. 5: 1235–1248.
HOLLOWAY, J.D. 1987. Macrolepidoptera diversity in the Indo-Australian tropics: geographic, biotopic and taxonomic variations. Biological Journal of Linnean Society. 30: 325–341.
HYNES, H.B.N. 1972. The Ecology of Running Waters. University of Toronto Press, Toronto, 555p.
ISAIA, M., OSELLA, G. & PANNUNZIO, G. 2009. Hygropetric and litter-inhabiting spiders (Araneae) from the Abruzzo Apennines (central Italy). Arachnologische Mitteilungen. 37: 15-26.
JACOBSEN, D. 2004. Contrasting patterns in local and zonal family richness of stream invertebrates along and Andean altitudinal gradient. Freshwater Biology. 49(10): 1293-1305.
JACOBSEN, D., SCHULTZ, R. & ENCALADA, A. 1997. Structure and diversity of stream invertebrate assemblages: the influence of temperature with altitude and latitude. Freshwater Biology. 38: 247–261
JANZEN D.H. 1967. Why mountain passes are higher in the tropics. The American Naturalist. 101: 233–249.
JURASINSKI, G., RETZER, V. & BEIERKUHNLEIN, C. 2009. Inventory, differentiation, and proportional diversity: a consistent terminology for quantifying species diversity. Oecologia. 159(1): 15-26.
KESSLER, M. 2000. Elevational gradients in species richness and endemism of selected plant groups in the central Bolivian Andes. Plant Ecology. 149: 181–193. KOLEFF, P., GASTON, K.J. & LENNON, J.K. 2003. Measuring beta diversity for presence–absence data. Journal of Animal Ecology. 72: 367–382.
LENCIONI, V., MARZIALI L. & ROSSARO, B. 2011. Diversity and distribution of chironomids (Diptera, Chironomidae) in pristine Alpine and pre-Alpine springs (Northern Italy). Journal of Limnology. 70 (Suppl. 1): 106-121.
11
LOMOLINO, M.V. 2001. Elevation gradients of species-density: historical and prospective views Global Ecology & Biogeography. 10: 3–13
MYERS, N., MITTERMEIER, R. A., MITTERMEIER, C. G., DA FONSECA, G. A., & KENT, J. 2000. Biodiversity hotspots for conservation priorities. Nature, 403(6772): 853-858.
OLIVER, D.R. & SINCLAIR, B.J. 1989. Madicolous Chironomidae (Diptera), with a review of Metriocnemus hygropetricus KIEFFER. – Pp. 285–293. – In: DÉVAI, G. (ed.): Advances in chironomidology. Proceedings of the Xth International Symposium on Chironomidae, Debrecen, 25–28 July, 1988. Part 1. Systematics, molecular biology, cytology, population genetics, zoogeography and phenology. – Acta biologica Debrecina. Supplementum oecologica hungarica 2: 407p.; Debrecen: Department of Ecology, University of Debrecen.
PINDER, L.C.V. 1995. The habitats of chironomid larvae. In The Chironomidae: biology and ecology of non-biting midges. In: ARMITAGE, P.D., CRANSTON, P.S. & PINDER, L.C.V. (eds.) Chapman & Hall, London, p. 107-135.
PINHO, L.C. & ANDERSEN, T. 2015. Limnophyes guarani sp. n., a new hygropetric Orthocladiinae from southern Brazil (Diptera: Chironomidae). Zootaxa. 3948(1): 137–
144.
RAHBECK, C. 1995. The elevational gradient of species richness: a uniform pattern? Ecography. 18: 200-205.
RAHBECK, C. 2005. The role of spatial scale and the perception of large-scale species-richness patterns. Ecology Letters. 8: 224–239.
RAUTIO, M. 1998. Community structure of crustacean zooplankton in subarctic ponds - effects of altitude and physical heterogeneity. Ecography. 21: 327-135.
RICKLEFS, R.E. & SCHLUTER, D., eds (1993) Species diversity in ecological communities: historical and geographical perspectives. University of Chicago Press, Chicago.
ROBACK, S.S. 1979. Hudsonimyia karelena, a New Genus and Species of Tanypodinae, Pentaneurini. Proceedings of the Academy of Natural Sciences of Philadelphia.131: 1- 8.
ROQUE, F.O. & TRIVINHO-STRIXINO, S. 2004. Podonomus pepinellii n. sp., first record of the genus and subfamily from Brazil (Diptera: Chironomidae: Podonominae). Zootaxa. 689: 1-7.
12
SILVA, F.L., WIEDENBRUG, S., TRIVINHO-STRIXINO, S. OLIVEIRA, C.S.N. & PEPINELLI, M. 2012. Two new species of Hudsonimyia Roback, 1979 (Diptera: Chironomidae: Tanypodinae) from Neotropical Region unveiled by morphology and DNA barcoding, Journal of Natural History. 46(25-26): 1615-1638.
SINCLAIR, B.J. & MARSHALL, S.A. 1987. The madicolous fauna in southern Ontario. Proceedings of the Entomological Society of Ontario. 117: 9–14.
SINCLAIR, B.J. & MARSHALL, S.A. 1988. The madicolous fauna in southern Ontario. Proceedings of the Entomological Society of Ontario. 117: 9–14.
SINCLAIR, B.J. & SAIGUSA, T. 2002. A new species of the seepage midge genus Trichothaumalea Edwards from Japan (Diptera: Culicomorpha: Thaumaleidae). Insect Systematics & Evolution. 33: 175–184.
SPANGLER, P.J. 1972. A new genus and two new species of madicolous beetles from Venezuela (Coleoptera: Hydrophilidae). Proceedings of the Biological Society of Washington. 85: 139–146.
STEVENS, G.C. 1989. The latitudinal gradient in geographical range: how so many species coexist in the tropics. The American Naturalist. 133: 240–256.
STEVENS, G.C. 1992. The elevational gradient in altitudinal range: an extension of Rapoport’s latitudinal rule to altitude. The American Naturalist. 140: 893–911.
THIENEMANN, A. 1905. Biologie der Trichopterenpuppen. Zoologische Jahrbu¨cher, Abteilung fu¨r Systematik, O¨ kologie und Geographie der Tiere. 22: 489–574.
TILMAN, D. 1982. Resource competition and community structure. Princeton University Press, Princeton, NJ.
TRIVINHO-STRIXINO, S., PEPINELLI, M., SIQUEIRA, T. & ROQUE, F.O. 2012. DNA barcoding of Podonomus (Chironomidae, Podonominae) enables stage association of a named species and reveals hidden diversity in Brazilian inselbergs. Annales de Limnologie. 48: 411–423.
VAILLANT F. 1956. Recherches sur la faune madicole de France, de Corse et
d’Afrique du Nord. –Mémoire du Musée d’Histoire naturelle de Paris (A) 11: 1-258. WANG J., SOININEN J., ZHANG Y., WANG B., YANG X. & SHEN J. 2012. Patterns of elevational beta diversity in micro-and macroorganisms. Global Ecology and Biogeography. 21: 743–750.
WARD, J.V. 1992. Aquatic insect ecology, Vol. 1. John Wiley & Sons, Inc. New York, NY
13
WHITTAKER, R.J., WILLIS, K.J. & FIELD, R. 2001. Scale and species richness: towards a general, hierarchical theory of species diversity. Journal of Biogeography.28: 453-470.
PARTE I
ECOLOGIA
Cap. 1
Elevational patterns of richness: “The
ends are bad” for madicolous insects in
the Atlantic Forest
15
Elevational patterns of richness: Are the ends bad for madicolous insects in the Atlantic Forest?
ABSTRACT
Aim “Biologists have long recognized that elevational and latitudinal species-richness
gradients mirror each other”. With this statement Stevens (1992) and other ecologists assumed the same hypotheses to explain richness patters in latitudinal and altitudinal gradients. However, the monotonic decrease of species towards highest altitudes is far from being a rule in elevational gradients studies, with the majority reporting an intermediate peak of richness. Here we analyze the richness pattern of madicolous
insects’ community along elevational gradients. We tested three hypotheses to explain the observed richness patterns 1. Rapoport’s rule; 2. Spatial constraint (area and mid -domain effect); 3. Environmental control on richness.
Location Three mountains from the Atlantic Forest in Southeast Brazil each one with approximately 1000 m of altitudinal range, representing low, intermediate and high gradients. Thus, we were able to explored the complete altitudinal range existent in the Atlantic Forest domain (0 – 2700 m a.s.l.).
Methods Sampling were performed along a transect. All madicolous habitats available along the transects were sampled, ensuring that at least three replicates (corresponding to 0.125 m2) in each 200 meters of elevation were obtained. Simple and multiple regressions were used in order to identify significant relations and comparison between empirical richness data and null model for MDE has been performed.
Results The complete elevational gradient showed an intermediate peak of richness.
Nor Rapoport’s effect neither area had important influence over richness, but a
significant effect of environmental variables and geometric constraint has been detected.
Main conclusions Environmental variables explained most of the relation between richnees and altitude, but the hard boundaries established (sea level and highest mountaintop) have constrained species distribution and contributing for the observed richness patterns, but higher explanation have been found for environmental control, where emergence rate of madicolous insects (productivity), temperature and oxygen were the main predictors.
16
INTRODUCTION
Understanding ecological patterns derived from environmental and geographical gradients have been one of the main challenges in community ecology. The variation in biodiversity is explained by multiples factors related to spatial scale (Whittaker et al., 2001; Hawkins et al., 2003; Rahbek, 2005; Heino, 2009), so that gradients in species richness are explained by the joint effect of historical events, environmental predictors and spatial constraint (Willig et al., 2003). Among the patterns observed in large geographic scale, the decrease of biological diversity from equator towards the poles, for example, is one of the most widespread and fundamental in ecology and biogeography studies (Willig et al., 2003; Brown & Lomolino, 1998; Baselga, 2008, 2010).
Once Stevens (1992) has stated that “biologists have long recognized that elevational and latitudinal species-richness gradients mirror each other”, most of the hypotheses about the variation in species richness along altitudinal gradients derived from the latitudinal hypotheses of richness pattern (MacArthur 1969; Wright 1983; Simpson, 1983; Brown 1988; Stevens, 1992; Whittaker et al., 2001).
One of the most widespread hypotheses for the monotonic decrease in species richness along latitudinal gradients posits that species at higher latitudes can tolerate a higher range of climatic variation due to historical constrains, and therefore present wider latitudinal range – The Rapoport’ s rule or effect (Stevens, 1989). This would inflate the number of species living at lower latitudes, who presents short tolerance range to environmental changing (Stevens, 1989; Blackburn & Gaston 1996). The same hypothesis has been proposed to explain altitudinal decrease in species richness (Stevens, 1992), where lowland communities have a greater number of species due to the mass effect (Shmida & Whittaker, 1981), and sink habitats (Shmida & Ellner, 1984). However, many studies do not support this hypothesis (McCain & Knight, 2013; Colwell & Hurt, 1994).
17
Lomolino 1998; MacArthur 1969). The predicted positive relation between richness and productivity take into consideration that high energy availability in most productive region would favor the occurrence of a higher number of species rather than increase the existent populations (Connel & Orians, 1964; Currie, 1991). The decrease of richness as the altitude rises has been verified in terrestrial (Rahbek, 1995; Bruhl et al., 1999; Escobar et al., 2007) and aquatic ecosystems (Rautio, 1998; Jacobsen et al., 1997; Lencioni et al., 2011).
Most of the evidences, however, indicate that higher richness occurs at intermediate altitudes when considering an elevational gradient (Colwell & Hurtt, 1994; McCain, 2004; Sánchez-Cordero, 2001; Rahbek, 2005). Many hypotheses have been extensively discussed to explain this pattern (Colwell & Hurtt, 1994; Tilman, 1982, Rahbek 1997). “The ends are bad” hypothesis states that climatic constraint is the most
important factor driving richness, so the decrease of richness is due to the temperature severity at both extremities: mountaintops and lowlands, and additionally, the high
predation pressure may control richness at low altitudes (McCoy, 1990). “The middle is good” hypothesis states that productivity is higher at intermediate altitudes, where photosynthesis is optimized by mild temperatures during the day, and respiratory rates are lower at the cool evenings (Janzen, 1973; Janzen et al., 1976).
Other widespread concept posits that in a limited spatial interval, species tend to overlap their range close to the middle of the domain, this is called the mid domain effect (MDE) (Colwell & Hurtt, 1994; Holloway, 1987; Bachman et al., 2004). Thus, the MDE is considered a pure geometric constraint on species richness due to the boundaries imposed to species ranges, and therefore predicts a null effect of environmental, biological, historical factors. The MDE have been evidenced in many studies (Miyamoto et al., 2014; Sanders 2002; McCain, 2004; Colwell et al., 2004; Colwell et al., 2005; McCain, 2003). Other hypothesis posits that the hump shape of richness in intermediate altitudes is once again associated with productivity (Tilman, 1982, Rahbek 1997; Rozensweig, 1995; Kessler 2000). In this case, richness increases as productivity increases, peaks at intermediate elevation, and decreases at most productive extremity (which most of the times refers to sea level). The decrease phase of richness in most productive areas is not enlightened yet (Rozensweig, 1995), but may
be associated with covariance of populations’ density or intertaxonomic competition
18
The influence of area on richness patterns is one of the few laws in ecology (Schoener, 1976; Dodds, 2009), thus the effects of the area should be regarded in studies dealing with spatial variation in richness. However, few studies have considered the area effect in altitudinal patterns of richness (Romdal & Grytnes, 2007; Sanders, 2002; McCain, 2007). Once many mountains present a conical shape (Korner, 2000; Lomolino, 2001), species richness tends to increase towards the base, where the available area is larger. When area influence is aggregated to the analysis, an intermediate peak of richness in the altitudinal gradient can be detected (Rahbek, 1997), or even the absence of richness pattern (Lawton et al., 1987).
Regarding aquatic insects communities from streams, two other important aspects can preclude the observation of altitudinal effects on richness: the extension of the elevational range studied – ranges below 500 m seems to be inadequate to demonstrate richness patterns (Jacobsen et al., 2004) – and the high heterogeneity observed along longitudinal river course, so that the observed variation in richness suffers from strongly habitat influence (Harrington et al., 2015; Jacobsen et al., 2004). Thus, the definition of altitudinal gradient boundaries and also the choice of stable and homogeneous habitats are essential for studies dealing with richness patterns.
Madicolous habitats (Thienemann, 1905) are characterized by a thin film of water that runs over rocky surfaces (Vaillant, 1955), therefore they are spatially restricted and isolated ecosystems (Ward, 1992). Madicolous habitats are less environmentally heterogeneous than streams, what make them a good object for altitudinal gradient studies. In addition, this biotope is known to harbor a peculiar insect fauna, with many species exclusively adapted to it (Vaillant, 1955; Hynes, 1970, Trivinho-Strixino et al., 2012). However, this habitat has long been neglected from faunistic and ecologic studies (Fischer et al., 1998; Isaia et al., 2009).
In this study, we describe richness patterns using madicolous insect community in three different 1000m-elevation gradients, represented by low, intermediate and high altitudes, and which together represents the complete altitudinal range existent in the Atlantic Forest domain (0 – 2800 m a.s.l.). We expect to find: 1. A monotonic decrease of species as altitude increases, or 2. An unimodal pattern with a peak of richness in central portion of the domain. Then, we tested three hypotheses to explain the observed
19
METHODS
Study area
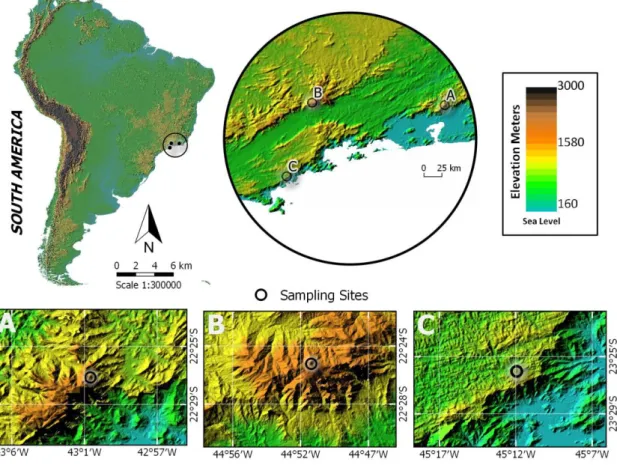
The study area comprehends three mountains from the Atlantic Forest located in Southeastern of Brazil (Fig. 1). The mountains were chosen in order to represent the complete elevational range present in the Atlantic Forest, and undisturbed conditions were ensured by their localization inside conservation units.
Figure 1 Localization of the study area in Southeast Atlantic Forest (Brazil). A – PS Mountain (intermediate altitudinal gradient); B – PM Mountain (high altitudinal gradient); C – C Mountain (low altitudinal gradient).
Serra do Mar State Park (PESM) is the widest conservation unit in São Paulo State, occupying approximately 315,000 ha, and sheltering the Corcovado Mountain
20
Serra dos Órgãos National Park (PARNASO) is situated in Rio de Janeiro State, and the rough terrain present in the region allowed us to complement our investigation in an intermediate altitudinal gradient. Pedra do Sino Mountain (PS) (Fig. 1a), situated in PARNASO (22°27'707'S/43°01'815''W), ranges from 1200 to 2200 m a.s.l. and presents four phytophysiognomies along the elevational gradient: Submountain Forest, Mountain Forest, Altimontain Forest and Campos the Altitude (similar to Andean Paramos).
Serra da Mantiqueira Environmental Protection Area (APASM) concentrates one of the largest and more important mountain ranges from eastern South America. It comprises three States (São Paulo, Rio de Janeiro and Minas Gerais) and the altitude in the region frequently exceeds 2000 m a.s.l. Inside this conservation area is located the Pedra da Mina Mountain (PM) (22˚23'955''S/44˚50'991''W) (Fig. 1b), which is the second highest peak from Atlantic Forest domain, ranging 2798 m a.s.l. (the first is at 2891 m a.s.l.), and the fourth highest from Brazil. Pedra da Mina represented the third and the highest gradient in the present study, where sampling were performed from 1600 to 2700 m a.s.l.
Serra da Mantiqueira and Serra do Mar formations, which includes also PARNASO territory, have the same geological origin that dates from Late Cretaceous - about 70 Mya (Almeida & Carneiro, 1998; Modenesi-Gautieri et al., 2002), and topographic profile is derived from tectonics movements.
Sampling methods
Sampling were performed along a transect in each mountain. All madicolous habitats available along the transects were sampled, ensuring that at least three replicates in each 200 meters of elevation were obtained, and totalizing 70 sampling sites from 0 to 2700 m a.s.l. Each sampling site was delimited by the coverage area of an emergence trap (Figura 1, em anexo) – approximately 0.125 m2 – (Shimabukuro et al., 2015, anexo 1).
21
the present study, abundance of emergent insects was the only information on the
adults’ data used (estimates of productivity).
All richness analysis was performed with immature organisms’ data. Larvae
were collected directly from the madicolous habitats, after the removal of the traps, by washing the substrate right above them and only at that specific area. All material were conserved in absolute ethanol and analyzed under stereomicroscope and optic microscope. All immature insects sampled were identified using specialized bibliography (Domínguez & Fernández, 2009; Trivinho-Strixino, 2011; Hamada et al., 2014; Lecci & Froehlich, 2007; Salles et al., 2004; Segura et al., 2011) to the lowest possible taxonomic level (genus/species). Working at genus level of aquatic insects has proved to be efficient to describe ecological trends (Wiggins & Mackay, 1978).
Predictor variables
Environmental factors were measured in situ at each sampling site. Water variables (temperature, dissolved oxygen, pH, conductivity, depth) were measure with the help of an analytical kit of chemical and physical parameters for freshwaters (Alfakit®). Water current was estimated by mass displacement. Visual measure of canopy openness (indicating the local solar incidence) was also determined once it could indirectly affect the madicolous community. Geographic data were obtained with a GPS, and the area of each altitudinal band was calculated with the software Google Earth Pro 7.1.2.2041.
22 Data analysis
Richness patterns
The general tendency of richness variation along the entire elevation range (0-2700 m) was verified and the relationship significance was tested through regression analysis. Based on the general pattern of the observed richness variation, the existence of significant linear or unimodal relationship was tested in each mountain separately with linear regression analysis.
Rapoport’s rule
To test if Rapoport’s rule had any influence over the observed variation in
richness patterns, we verified if the elevational range of species and the altitude was positively and significant correlated applying Spearman correlations (α = 0.05). To
calculate the range size of each species, we considered the distance between the lowest
and the highest altitudinal limit where the species was recorded. Following the Steven’s
method (Stevens 1989), we obtained the mean elevational range of each altitude analyzed, calculating the mean altitudinal range of all species that occurred at each altitude.
Additionally and given that the species in higher altitudes present higher ranges
according to Rapoport’s rule, we tested whether the species in PM have significant higher mean altitudinal range than species in PS and C. We compared the mean altitudinal range in each mountain by means of ANOVA one-way with Tukey HSD test a posteriori.
Spatial constrains
To verify if area and geometric constrains could significant affect the richness, each gradient was divided into 200 m-altitudinal bands. Once different sampling effort have been performed among the altitudinal bands, richness have been standardized by rarefaction procedure, based on the number of individuals sampled at each altitudinal band (Gotelli & Cowell, 2011). Thus, we found the expected number of species in 60 individuals for each altitudinal band in C, 24 for PS, and 297 for PM (respective smallest number of individuals found in the altitudinal bands of each mountain). The rarefactions were performed in R Cran Project 3.0.3. (R Core Development) Software,
23
To test if MDE constrained the richness in each gradient, we analyzed how well the empirical richness values fitted the expected richness curve resultant from a null model. The null model, generated in Mid-Domain-Null for Excel (McCain, 2004), was based on the analytical-stochastic models of Colwell (1999) and Colwell & Hurtt (1994). Through 50000 Monte Carlo simulations (without replacement) on the empirical ranges sizes, the expected variation in richness along each mountain elevation and the complete elevational gradient were determined with 95% of confidence interval. To test if the observed richness were significantly explained by geometric constrains, simple linear regressions were applied to the empirical richness and the expected richness calculated by the null model analysis. The shared influence of area and MDE on richness patterns was also calculated through multiple regression analysis.
Environmental predictors
Multiple regressions analyses have been performed to verify the environmental contribution in shaping the observed richness patterns. Variables have been divided into two groups: elevation-dependent variables (EDV), which presents a unidirectional trend with altitude (Korner, 2007), and elevation-independent variables (EIV), in order to verify which type of variable best influence richness. Variables classified as EDV demonstrated significant relation with the altitude (linear or unimodal variation), and while EIV changed randomly along the gradient, reflecting a noisy relation. Further, we determined which environmental predictors, among all measure factors, best explained the variation in species richness. Data were log-transformed prior to regressions analyses.
All regression analysis and Spearman correlation was performed in Statistica (StatSoft version 7.0).
RESULTS
24
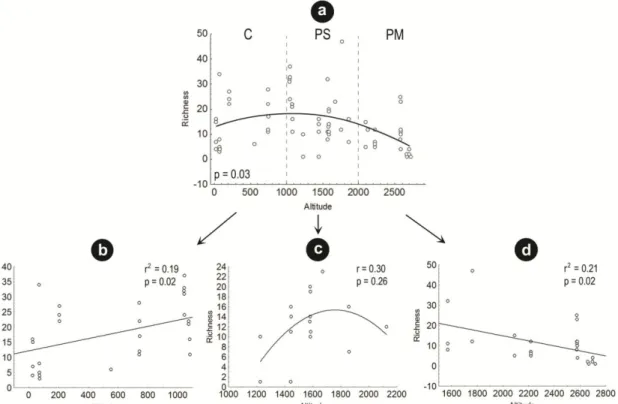
The complete elevational range of madicolous insects’ richness in the Atlantic Forest showed a clear mid-elevational peak (Fig. 2a). Analyzing the altitudinal gradient in each mountain separately, we note that only PM was marked by a monotonic decrease in species richness along the altitude (Fig. 2d); PS was the only to show a hump shape in species richness, although it was not a significant relation (Fig. 2c); and the lower altitudinal range, C, showed a positive relation between richness and altitude (Fig. 2b).
Figure 2 Relationships between richness and altitude. a. Complete range (C+PS+PM) b. Gradient at lower altitudes (C) c. Gradient at intermediate altitudes (PS) d. Gradient at higher altitudes (PM).
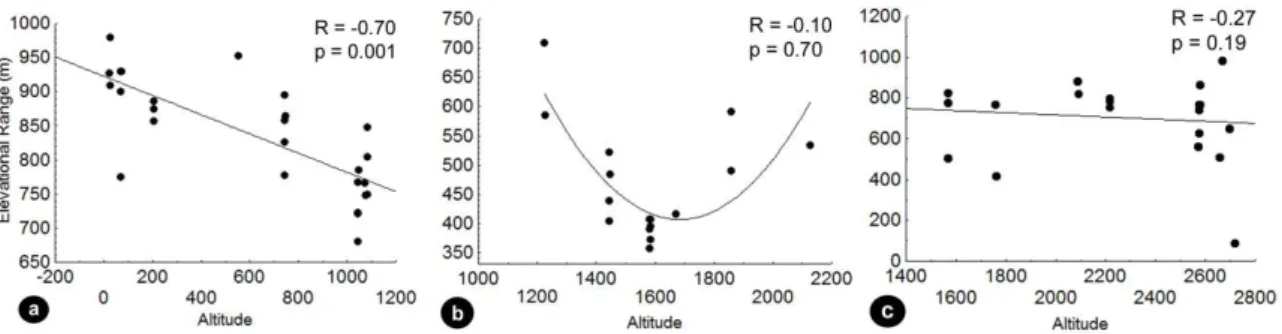
The validity of Rapoport’s rule was not confirmed in any of the analyzed gradients (Fig. 3). The significant correlation between range size and altitude was only verified in Corcovado (Fig. 3a), where lower species ranges were predominant at higher altitudes – the opposite pattern of Rapoport’s rule predictions. In PS, a tendency of
25
Figure 3 a. Gradient at lower altitudes (C) b. Gradient at intermediate altitudes (PS) c. Gradient at higher altitudes (PM). Relation between range size (m) and altitude (m) by
Steven’s method (Stevens, 1992)tested by means of Spearman correlation (α=0.05). Comparing the mean species’ range size at each gradient, a significant higher range is observed at Corcovado (Fig. 4), confirming that higher altitudes did not show any relation with higher distributional ranges of species in the present study.
Figure 4 One-way ANOVA showing significant differences among elevational range of species in each gradient, and post-hoc Tukey HSD test evidencing the groups. C: Gradient at lower altitudes; PS: Gradient at intermediate altitudes; PM: Gradient at higher altitudes.
26
Figure 5 Elevational dependent variables (EDV) that significantly varied with altitude (p<0.05). a. temperature b. dissolved oxygen c. emergence rate.
In all tested cases (four elevational gradients), environmental predictors significantly influenced richness along the elevation (Table 1). We highlight the high explanation power of the environmental predictors over richness in PS (explaining more than 80% of the relation) (Table 1). Among the environmental classes tested, EDV were more important in driving richness in all gradients than EIV (Tab. 1). Area alone did not affect significantly the number of species in any of the gradients, but the shared effect with MDE had potentially influenced the richness in PM, although this relation was not significant (Table 1). This was the only case where spatial constraint showed some influence over the observed richness and this implicated in lower explanation showed by environmental predictors over richness in this locality. MDE alone possibly influenced richness patterns at the complete elevational range (C+PS+PM), and specifically at PS (Table 1). Eight from fifteen values of empirical richness considering the entire elevational range occurred within the predictions of the mid domain model (Fig. 6), and half of those at the central domain, relative to PS gradient. Almost all empirical richness points from PM showed consistent deviation from the mid-domain prediction interval.
27
Table 1 Linear determination coefficients (r2 for simple regressions and adjusted r2 for multiple regressions) between empirical richness and environmental predictors, area and predicted richness for MDE (average of the 50000 simulations). C: Gradient at lower altitudes; PS: Gradient at intermediate altitudes; PM: Gradient at higher altitudes. Bold values highlight significant relations.
Gradient Environmental predictors Spatial constrains
Best fitting* EDV EIV MDE Area MDE + Area
C Ajusted-r2 0.61 0.61 0.08 r2 0.27 0.24 Ajusted-r2 0.02
p-value 0.0004 0.0001 0.17 p 0.30 0.40 p-value 0.49
PS Ajusted-r2 0.82 0.66 0.42 r2 0.53 0.04 Ajusted-r2 0.19
p-value 0.002 0.003 0.03 p 0.02 0.75 p-value 0.40
PM Ajusted-r2 0.45 0.41 0.12 r2 0.17 0.59 Ajusted-r2 0.69
p-value 0.0001 0.0001 0.007 p 0.48 0.07 p-value 0.08
Complete Ajusted-r2 0.2 0.13 0.07 r2 0.38 0.26 Ajusted-r2 0.14
p-value 0.004 0.02 0.03 p 0.01 0.06 p-value 0.18
*Best fitting variables. C: EDV; PS: EDV + water flow; PM: EDV + water flow; Complete range: EDV+EIV.
Figure 6 Empirical richness (black line with filled circles) fitting on null model (95% prediction curve without replacement), performed on Mid-domain null with 50000 simulations, regarding altitudinal bands from 0 to 2800 m a.s.l. C: Gradient at lower altitudes; PS: Gradient at intermediate altitudes; PM: Gradient at higher altitudes.
DISCUSSION
28
ranges extent and grain size can affect our conclusion regarding altitudinal patterns of species richness.
The above mentioned pattern already contradicts what is postulated in
Rapoport’s rule (Steven, 1989; 1992). In fact, we found no positive relation among
elevational range size and elevation, even at PM where a monotonic reduction of
species with increase altitude was observed. Rapoport’s rule has been tested by several studies dealing with latitudinal (Colwell & Hurtt, 1994; Rohde et al., 1992) and elevation gradients (Fleishman et al., 1998; McCain & Knight 2013; Sanders, 2002), but most did not confirm this hypothesis for mountain gradients (McCain & Knight 2013). In addition, we found significantly higher range sizes at the low-gradient, the
opposite result expected from Rapoport’s rule. However, Neotropical lowland streams
have passed through intense climatic variation during Pleistocene (Covich, 1988), what would explain the noticeable higher altitudinal ranges verified in C, especially at its
lowest altitudes, through the theoretical basis of Rapoport’s rule (Steven, 1989; 1992), but in inverse relation. Thus, we may consider that no Rapoport’s rule was verified and it was evident that other processes have been driving richness along elevation gradient. MDE test confirmed that richness has been spatially constrained at the wider scale (complete elevation range) and at PS gradient. The influence of MDE in richness pattern when considering the complete range can be supported, once we are dealing with a hard boundary (Rahbek, 1997; Colwell and Hurtt 1994). It means that species found are completely spatially limited by the lowest altitude (sea) and the highest altitude (top of the highest mountain = 2800 m a.s.l.) found at Atlantic Forest domain. Thus, the distribution of madicolous insects from Atlantic Forest are limited to this range (2800 m) and therefore are more prone to overlap their ranges in the central region of the domain (intermediate altitudes) (Lyons and Willig, 1997; Colwell and Hurtt, 1994). However, the relatively low explanation value found (less than 40%) implies that MDE was not the primary cause of richness variation along elevation gradient.
29
In all cases, the co-variables of altitude (EDV) were more important for the observed richness pattern than the independent variables (EIV). This emphasizes our belief that madicolous habitats are good habitats-models to test ecological patterns, once they are relatively structurally homogeneous and isolated systems (Ward, 1992). EIV are frequently responsible for the absence of richness patterns in altitudinal gradients (Jacobsen et al., 2004; Harrington et al., 2015). EIV poorly affected richness patterns in this study, however, water flow was important for PM and PS gradients. Water flow is known to influence insects’ distribution in running waters (Rabeni & Minshall, 1977; Mazzucco et al., 2015), and although the variation of water flux in madicolous habitats of the present study was discrete, it was enough to cause variations in species richness. Among the EDV, emergence rate, dissolved oxygen and temperature joint effect best explained richness patterns.
Emergence is directly related to the energy dynamics in the ecosystem and can be used as a method for estimating secondary production of aquatic insects (Poepperl, 2000). Here, emergence rate and solar incidence were considered surrogates for biological processes related to productivity. In this study, the increase of madicolous
ecosystems’ productivity with altitude may be intimately related to the increase of light intensity. As the altitude increases, large trees are replaced by small vegetation and solar incidence increases for ground organisms in most tropical mountains (Homeier et al., 2010; Aiba & Kitayama, 1999). Light is the primary responsible for the increase of periphyton production in running waters (Elsaholi et al., 2011; Hill et al., 1995). Given that madicolous insects feed primarily on periphyton (Vaillant, 1955, 1961; Hynes, 1970; Oliver & Sinclair, 1989) is expected that a greater secondary production be observed in congruence with food availability. Decrease of ground-dwellers lichens toward low altitudes has already been evidenced in response to light reduction below forest limit (Grytnes et al., 2006).
30
and consequently, with richness patterns (Hutchinson, 1959), specially explaining the initial increase in richness.
Different from most systems, where the highest productivity occurs at lowest altitudes (at the sea level), and decreases toward the mountaintop (Hawkins et al., 2003; Hutchinson, 1959; Orians 1969; Homeier et al., 2010; Aiba & Kitayama, 1999), for the small aquatic ecosystems analyzed in the present study, we found evidences indicating that productivity increases with increasing altitude. Thus, the relation between richness and productivity here is described by a hump-shaped variation, where the initial increase in richness, at low altitudes, is related to the increase of productivity –
contrasting from the enigmatic and frequently found relation between high-productive lowlands and low richness values, which causes are still unknown (Rozensweig, 1995). Further, our results support that the latter decrease in richness towards higher productive altitudinal bands (top of the higher mountain), is primary a consequence of severe temperature drop at highest altitude. Temperature is world-wide accepted as one of the most important driver of richness patterns for altitudinal and latitudinal gradients (MacArthur 1969;Rahbek, 1995; Jacobsen, et al., 1997; Murray, 1997) Also, oxygen concentration declined monotonically from intermediate altitude toward the top, and
this fact certainly negatively affected madicoulous insects’ community, contributing to
the observed decrease in richness at the highest altitudes of the gradient. Oxygen concentration is hardly considered a predictive variable for richness variation in elevational gradients, maybe because most of studies deal with terrestrial organisms for which this variable constantly decrease with altitude. However, for aquatic organisms the oxygen availability is extremely important (Connolly et al., 2004; Ward, 1992) and it is not the first time that dissolved oxygen has been depicted as the main cause of richness decrease in altitudinal gradients (Jacobsen, 2008). The increase of oxygen concentration in the first half of the domain is probably related to the solubility increase as temperature declines (Tromans, 1999), however, it reaches the peak at approximately 1700 m and then decrease, probably due to the rarefied atmospheric oxygen, which constantly decreases with altitude (Korner, 2007; Jacobsen, 2008).
31
especially regarding temperature and oxygen decrease, which are in accordance with the
“ends are bad” hypothesis.
In this study, area did not affect significantly richness in any of the mountains, although in PM a slight relation was observed. The weak explicability of area over richness is mainly due to the non-conical shape of the mountains (Korner, 2000; Lomolino, 2001). One of the few laws in ecology is the positive relation between area and richness (Schoener, 1976; Dodds, 2009), so the conical shape of most studied mountains may lead to an erroneous monotonic decrease in richness along the elevation (Rahbek, 1997). In addition, estimating altitudinal bands would not have the same importance for madicolous insects than it represents for terrestrial organisms, once area may not be directly related to habitat availability, thus poor effect over richness is expected.
We should highlight that the factors underlining richness variation along elevation in Atlantic Forest are deeply associated with the elevational range, and thus, are scale-dependent. The aspects related to energy dynamics (productivity) and oxygen availability explain the observed patterns more than spatial constraints (area effect and MDE) or Rapoport’s effect. However, the influence of MDE is undeniable, once species
are limited by the elevation boundaries. Leading with the entire altitudinal range existent at Atlantic Forest through the study of three mountains relatively close allowed us to verify a hump-shaped variation of richness along elevation that would not be
noticeable at other scale, and gives more power to the “the ends are bad” hypotheses.
REFERENCES
Aiba, S. & Kitayama, K. (1999) Structure, composition and species diversity in an altitude-substrate matrix of rain forest tree communities on Mount Kinabalu, Borneo. Plant Ecology, 140, 139–157.
Almeida, F.F.M. & Carneiro, C.D.R. (1998) Origem e Evolução da Serra do Mar. Revista Brasileira de Geociências, 28(2), 135–150.
Bachman, S., Baker, W.J., Brummitt, N., Dransfield, J. & Moat, J. (2004) Elevational gradients, area and tropical island diversity: an example from the palms of New Guinea. Ecography,27, 299–310.
32
Baselga, A. (2010) Partitioning the turnover and nestedness components of beta diversity Global Ecology and Biogeography. Global Ecology and Biogeography, 19, 134–143.
Blackburn, T.M. & Gaston, K.J. (1996) Spatial patterns in the species richness of birds in the New World. Ecography, 19, 369–376.
Brown J.H. & Lomolino M.V. (1998) Biogeography. Sunderland. Sinauer. 2nd Ed. Brown, J.H. (1988) Species diversity. Analytical Biogeography – An Integrated Approach to the Study of Animal and Plant Distribution (eds. by Myers, A.A. & Giller, P.S.), pp. 57–89. Chapman and Hall, New York, NY.
Bruhl, C.A., Mohamed, M. & Linsenmair, K.E. (1999) Altitudinal distribution of leaf litter ants along a transect in primary forest on Mount Kinabalu, Sabah, Malaysia. Journal of Tropical Ecology, 15, 265–277.
Colwell, R.K., Rahbek, C. & Gotelli, N.J. (2004) The mid-domain effect and species richness patterns: What have we learned so far? The American Naturalist, 163, 1–23.
Colwell, R.K., Rahbek, C. & Gotelli, N.J. (2005) The Mid-Domain effect: there’s a
baby in the bathwater. The American Naturalist, 166, 149–154.
Colwell, R.K. & Hurtt, G.C. (1994) Nonbiological gradients in species richness and a spurious Rapoport effect. The American Naturalist, 144, 570–595.
Colwell, R.K. (1999) RangeModel: a Monte Carlo simulation tool for assessing geometric constraints on species richness, Ver. 2. User’s guide and application published at http:/www.viceroy.eeb.uconn.edu/RangeModel.
Connell, J.H. & Orians, E. (1964) The ecological regulation of species diversity. The American Naturalist, 98, 399–414.
Connolly, N.M., Crossland, M.R. & Pearson, R.G. (2004) Effect of low dissolved oxygen on survival, emergence, and drift of tropical stream macroinvertebrates Journal of theAmerican Benthological Society, 23(2), 251–270.
Covich, A.P. (1988) Geographical and historical comparisons of neotropical streams: biotic diversity and detrital processing in highly variable habitats. Journal of the North America Bednthological Society, 7, 361–386.