ABSTRACT
RESUMO
Uso de diferentes imagens de satélite e técnicas de classificação para avaliar a contribuição
de árvores fora das florestas no município de Maringá
O objetivo deste trabalho foi mapear a área de cobertura florestal no município de Maringá, região norte do Estado do Paraná. Para isso, foram usadas imagens de alta e média resolução do satélite CBERS 2B, sensores HRC e CCD. As imagens foram georreferenciadas e classificadas segundo a vegetação de porte florestal por meio de duas abordagens de classificação digital: uma, baseada nos números digitais ou refletância dos pixels e, outra, classificação orientada ao objeto. Foram calculados os números e áreas dos polígonos, sendo os mesmos separados em classes de tamanho de áreas. Foram construídos mapas temáticos, apontando as classes de tamanho dos fragmentos florestais, e sumarizadas as áreas de cada uma das classes. Verificou-se que o maior número de fragmentos florestais do município de Maringá encontra-se na classe menor que 500 m², ressaltando a importância que os pequenos maciços florestais (TOFs – trees outside the forest) têm na paisagem. Verificou-se uma diferença de 58,44% de área verde, encontrada nas imagens de alta resolução espacial, em relação à de média resolução espacial. Este resultado denota a importância de se utilizar geotecnologias com maior resolução espacial, na detecção de TOFs, em pequenos verdes urbanos e áreas com elevado grau de antropização.
Palavras-chave: imagem CCD, imagem HRC, mapeamento, sensoriamento remoto, verdes urbanos.
Received: 14/08/2012; Accepted: 17/05/2013.
1 This research was supported by CNPq/Peld Sitio 9.
2 Forest Engineer. Departamento de Ciências Florestais, Universidade Federal do Paraná, Campus III, Avenida Lothário Meissner, 900, Jardim Botânico, 80210-170, Curitiba,
Paraná, Brasil. [email protected]
3 Forest Engineers, Doctors of Science. Departamento de Ciências Florestais, Universidade Federal do Paraná, Campus III, Avenida Lothário Meissner, 900, Jardim Botânico,
80210-170, Curitiba, Paraná, Brasil. [email protected] (corresponding author); [email protected]
Betina Doubrawa2, Ana Paula Dalla Corte3, Carlos Roberto Sanquetta3
Using different satellite imagery and classification techniques
to assess the contribution of trees outside forests in the municipality
of Maringá, Brazil
1Forest cover of the Maringá municipality, located in northern Parana State, was mapped in this study. Mapping was carried out by using high-resolution HRC sensor imagery and medium resolution CCD sensor imagery from the CBERS satellite. Images were georeferenced and forest vegetation patches (TOFs – trees outside forests) were classified using two methods of digital classification: reflectance-based or the digital number of each pixel, and object-oriented. The areas of each polygon were calculated, which allowed each polygon to be segregated into size classes. Thematic maps were built from the resulting polygon size classes and summary statistics generated from each size class for each area. It was found that most forest fragments in Maringá were smaller than 500 m². There was also a difference of 58.44% in the amount of vegetation between the high-resolution imagery and medium resolution imagery due to the distinct spatial resolution of the sensors. It was concluded that high-resolution geotechnology is essential to provide reliable information on urban greens and forest cover under highly human-perturbed landscapes.
INTRODUCTION
The mapping of forest cover and its dynamics has become the object of study of many researchers nowadays. The UN Food and Agricultural Organization published an overview of global forest cover in 2011 (FAO, 2011) and South America still had the highest rate of forest area loss, with 4 million hectares per year, followed by Africa, which lost 3.4 million per year. The Brazilian Ministry of Environment released in 2007 the results of its Biome Land Cover Map, part of the Conservation and Sustainable Use of Diversity Project MMA/PROBIO (2007), which gave an overview of the country’s remaining forests and the Atlantic Forest biome in particular. That project only considered patches of 40 hectares or greater in area.
For a variety of reasons, in the great majority of forest surveys, small fragments are disregarded in the estimation of forest area. For example, in the past, limitations in spatial resolution and more recently, software and computer processing limitations represented problems. Meanwhile, geo-spatial technologies have evolved in recent years, allowing in-dividual trees to be identified. From this innovation, a discussion has emerged about representation of so-called “Trees Outside Forests (TOFs).” A forest is defined according to the Global Forest Resources Assessments – FRA of FAO (2001) as land with a canopy cover (or its equivalent degree of coverage) greater than 10% and with a surface area greater than 0.5 hectare. The general forest definition mentioned above considers typical na-tural forests and forest plantations. According to FAO (2001), TOFs may be more frequent in some contexts, such as: areas of low or highly fragmented forest cover, as it is the case of the Atlantic Forest. It constitutes the main source of timber and non-timber products in many regions, though the trees may not be represented in the maps. TOFs in urban areas also provide important environmental and landscape services, and provide shade and higher quality housing in cities.
According Bierregaard Jr. et al. (1992), TOFs have no ability to protect biological diversity. However, these small remnants can act as stepping stones or small areas of habitat scattered throughout the matrix that for some species may facilitate dispersal between larger fragments (Ranta et al., 1998). They promote an increased heterogeneity in the matrix and act as refuges for species that require particular environments that occur only in those areas. Since fragments of larger sizes are more diverse, the species richness depends on the size of the fragment (Lefkovitch & Faring, 1985).
According to FAO (2010), TOFs are located in so-called “other lands”, especially farms and built up areas, both in
rural and urban areas. A large number of TOFs consist of planted or domesticated trees. These include agroforestry systems, orchards and small groves (FAO 2001).
Another important initiative is France’s National Forest Inventory (IFN) which has established a strategy whose aim is to classify TOFs more effectively. The goal is to use such information to update the data from the country’s National Forest Inventory with a single national classification standard (MMA, 2011).
Herrera-Fernández (2003) developed a method for the classification and modeling of TOFs in Central American landscapes, combining data from remote sensing and Geographic Information Systems (GIS) and thus contributing important methodological tools for identifying TOFs using aerial photographs.
As mentioned by Kleinn (2000) and Herrera-Fernández (2003), TOF research efforts have been focused primarily at local scales, and only in recent years has this issue drawn attention from the Neotropics research community. Because of this lack of information on TOFs, Kleinn (2001) reported that a three-year project has been implemented in Central American countries (Costa Rica, Honduras and Guatemala).
The issue of TOFs in many municipalities has other implications beyond those already discussed. According to Viana et al. (1992), the distribution of size classes of fragments in the landscape is an important element in the development of strategies for biodiversity conservation. Over half of conservation reserves are less than 500 ha, which is insufficient for many plants and animals species. Little attention has been paid in the scientific community to the theme of TOFs in Brazil, resulting most notably in the lack of official statistics and therefore glo-bal and local development of policies on the matter. Amidst increasing deforestation and environmental degradation in Brazil, there is evidence that TOFs are playing a significant role in the sustainability of local and regional environmental resources. These trees help alleviate pressures on native forest fragments and have an important environmental role to play, especially in urban ecosystems and in areas with high levels of fragmentation such as the northern region of Paraná State, a region with the lowest forest cover percentages of native forest in Brazil (Santos, 2005). In the case of Maringá TOFs contribute largely in terms of ensuring a minimum level of biodiversity and gene flow (Viana et al., 1992).
Figure 1. Location of the study area Municipality of Maringá, Paraná State, Brazil in CBERS 2B satellite imagery.
MATERIALS AND METHODS
Location of the study area
The study area is located in Maringá, northern Paraná State, at 23°25’S latitude and 51°57’W longitu-de (Figure 1).
According to Maack (1968), and using the physiognomic-Ecological System Classification of Brazilian vegetation, proposed by Veloso & Goes-Filho (1982), the municipality of Maringá is encompassed in the phytogeographic region named Seasonal Semideciduous Forest (Leite & Klein, 1990), belonging to the Atlantic Forest Biome (IBGE, 1992).
The climate in Maringá, according to the Köppen classification, is of the type Cfa subtropical, with hot summers, infrequent frosts and heavy rains in the summer. Currently the region’s forest cover is composed of small fragments located in some farms and areas adjacent to springs. However, most of the rivers have their riparian vegetation totally unprotected, in which grain crops or pasture extend to the riverbanks. Such a scenario has arisen in the context of occupation and use of highly valued land.
Geo-spatial technologies applied
The images used in this study were supplied by INPE (Brazilian National Institute for Space Research). The HRC sensor image of the CBERS 2B satellite was acquired on August 9, 2008. This sensor has a spatial resolution of 2.7 meters (high resolution) and operates in a single spectral range (0.50 to 0.80 mm). The image covers an area of 729 km² and is located on orbit 160, row (point) 126. The CCD sensor CBERS 2B image was used for comparison, which was acquired on March 24, 2007. This sensor has a spatial resolution of 19.5 meters (medium resolution) and operates over five spectral bands (Nakamura & Novo, 2005).
of high spatial resolution had to be processed using object oriented classification methods.
To classify the CBERS 2B HRC sensor images, the E-cognition software version 5.0 was used to perform automatic segmentation to create homogeneous regions (segments) prior to the classification procedure. Automatic classification in E-cognition tries to differentiate the class of interest, i.e., areas with the presence of forest-like green patches, using the interpretation indicators, or elements such as shape, texture and color. After automatic classification, a visual interpretation of all polygons was carried out to further identify forested areas, in order to improve the accuracy of the results generated. Finally, the images were compared against each other in order to ensure that all green patches were associated with the correct class. The gross results of the classification produced a shapefile (.shp) with polygons sorted for export to an ArcGIS 9.3 environment. Classification of the CBERS CCD image was carried out initially using ENVI 4.5 software, color composition RGB: 3,4,2. Then, points were collected representing the class of interest (areas of tree vegetation). These samples of interest were then used in a supervised classification (Maximum Likelihood). This classification method considers the weights of the average distances and uses statistical parameters to perform the classification. The classified image was then converted into a vector file. In the raster, file polygons were dissolved and exploded by the process mentioned above.
In order to compare the results obtained from both images, the corresponding area of each polygon was calculated and divided into five classes: areas smaller than 500 square meters (Class 1), between 500 and 1,000 m² (Class 2), between 1000 m² and 5,000 m² (Class 3), between 5,000 m² and 10,000 m² (Class 4), and greater than 10,000 m² (Class 5). Later thematic maps were constructed with the results of the fragments to aid visualization, where Classes 1, 2 and 3 were considered TOFs and Classes 4 and 5 were considered forests.
Classes were also created from the polygons representing forests and TOFs. Shape in this step was expressed using the relationship between a forest fragment’s area (m²) and its perimeter (m). The shape clas-ses (area/perimeter) were divided as such: Class 1 – < 5, Class 2 – 5.01-10, Class 3 – 10.01-15 and Class 4 – > 15. The area/perimeter ratio is also known as the core/edge ratio.
According to Lang & Blaschke (2009) the optimal shape in this respect is a circle, in which the interior area of the fragment is maximized with respect to the length of its edges. According to these authors, the current way of characterizing a fragment is to express its degree of deviation from this optimum form. In other words, the area/
perimeter ratio is compared with that of a circle of the same area. This ratio increases with the area of the fragment. Fragments with small areas and with perimeters that are relatively long have therefore low area/perimeter ratios.
RESULTS AND DISCUSSION
Mapping forests and TOFs with both types of satellite images showed quite different results in terms of green area, both on the perimeter of the municipality and the urban district of Maringá (Table 2). In the municipality as a whole, the green area mapped (forest + TOFs) with the high resolution image (HRC) totaled 4,513 hectares, while that mapped with the CCD sensor was of 1,876 hectares, or an area 2.4 times greater for HRC satellite mapping in comparison to CCD satellite mapping. In the urban area of the municipality, in relative terms, the difference was even greater, i.e., of 1,795 hectares and 407 hectares for HRC to CCD, or an area that is 4.4 times greater for HRC.
These differences are even more pronounced when considering the numbers of polygons mapped. The numbers of polygons detected with the sensor HRC were 6.8 times greater (18,495 x 2,710 units), whereas the total area of the municipality and 9.4 times greater (5,305 x 563 units), when taking into account only the urban perimeter. This demonstrates that higher resolution images allow better spatial capture of rather fragmented and small areas, as is usually the urban green areas.
The ability of the sensor HRC (higher spatial resolution) to detect TOFS is evident. The HRC sensor detected an area of 1,172 ha of TOFS in the municipality as a whole and 730 ha in the urban area, whereas the sensor CCR captured 216 ha in total area of the municipality and only 46 ha in the urban perimeter. It is important to note that in terms of numbers of polygons mapped, the HRC sensor, due to its higher spatial resolution, detected a number of TOFs polygons 7.7 ti-mes greater than that for the CCD sensor which were 2,283 x 17,499 polygons in the municipality as a whole, and 4,680 x 468 polygons in the urban part of Maringá.
It was also observed that the TOFs size class distribution assumed a decreasing shape, both for the limit of the whole municipality as well as for the urban Maringá, i.e., a greater number of fragments in the smaller classes was recorded. The majority of TOFs concentrated on the class of less than 500 m2. On the contrary, there
was a concentration of TOFs in the upper size class, i.e., 1,000 to 5,000 m2 (Figure 2). Viana (1990) compared
Regarding the forest area, the larger fragments (over 10,000 m2) were predominant both in area and number of
polygons. This pattern was observed for both the CCD satellite imagery as well as for HRC. However, it is important to note that both in area and number of polygons mapped, the HRC sensor, due to its higher spatial resolution, was able to detect a greater green area, especially because its capability to detect small woods, namely TOFs.
The forest fragments (over 5,000 m2) captured by the
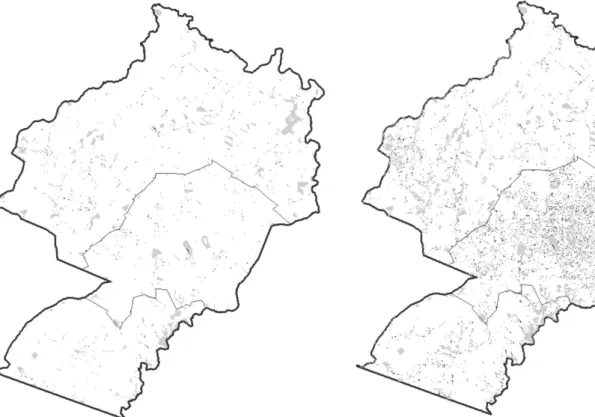
CCD sensor had a spatial distribution concentrated in some regions of the municipality, while TOFs presented a scattered pattern without clear differentiation between the extension of urban and rural areas (Figure 2). However, when analyzing the fragments of forest TOFs captured by the sensor HRC, another reality takes place. It was also indicated a large concentration of TOFs inside the urban area in contrast to the rural zone, since the TOFs occupy 9.96% of the territory’s urban municipality (totaling 7,237.23 ha) and only 2.84% in rural area (41,289.22 ha). This demonstrates that it is in the city that the small woods are concentrated. It could only be observed by using the HRC image. Another fact observable in the HRC image and invisible in the CCD is the presence of aligned woods representing the street and grove trees along the property borders and roads (Figure 3).
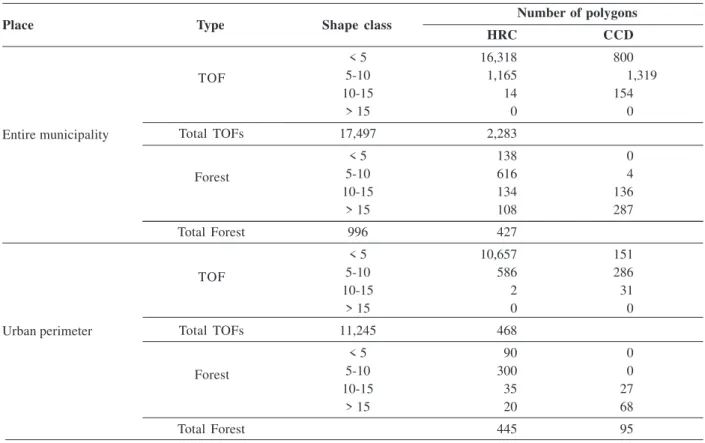
The shapes of forest fragments and TOFs were also analyzed by the area/perimeter ratio (Table 2). The lower
the area/perimeter ratio of polygons mapped the more elongated they are, and conversely, the higher the ratio, the more rounded they are. Forest fragments and TOFs existing in the municipality of Maringá are mostly elongated ones, which may represent a risk. Such elongated fragments are greatly affected by edge effects and have increased risk of collapse. In a study assessing biodiversity in forest fragments, Viana & Pinheiro (1998) reported that 51.9% of fragments were considered elongated, 35% were very elongated, which are heavily affected by edge effects. This fact demonstrates that green area cover is not the only parameter to be taken into consideration but also the shape of the polygons shall be considered in defining conservation strategies in highly perturbed landscapes as the municipality of Maringá.
Heavy forest fragmentation is evident in most municipalities in the Southern and Southeastern Brazil, and notably in the northern Paraná, which has undergone vigorous agricultural development. Fragmentation has been due to anthropological agents such as the land-use structure of the region, laws governing land-use, and more importantly agriculture and livestock, the typical model of land use occupation. Present in a majority of municipalities, these small forest fragments represent a large expanse of tree cover and belong to the Atlantic Forest biome.
Almeida (2008) pointed out this fact during a mapping project of the Campos Gerais National Park, Paraná. In
Figure 3. Municipality of Maringá, vegetation classification in HRC CBERS 2B sensor image.
that study, it was estimated that 91.4% of forest patches were smaller than 5 ha. In the municipality of Ponte Nova, MG, Albanez (2000) highlighted a predominance of isolated fragments in the landscape, mostly consisting of forest patches smaller than 20 ha. Sanquetta et al. (2012), in a study of the Araucaria Forest (FOM) in Parana, using Landsat 5 images acquired in 1998, found that nearly 2.269 million hectares correspond to fragments < 50 ha (i.e. 82.54% of the area of the FOM in Paraná). In this same study, only 13.77% of existing forest fragments were between 50 and 500 ha in size, while 3.69% corresponded to fragments > 500 ha in size.
According to IBGE, Maringá had a population of 357,177 inhabitants in 2010. Considering only the urban
perimeter of Maringá, we identified a total of 1,794.91 hec-tares of green areas in the high resolution image (HRC) and 406.58 hectares in the medium-resolution image (CCD). Maringá therefore had an average of 50.25 m²/inhabitant based on the CBERS HRC sensor image and an average of 11.38 m²/inhabitant for the CBERS CCD sensor image.
Quantification of urban forestry was accomplished through dependent and independent indicators of demography expressed, respectively, in terms of green area per inhabitant (IAV = Green Area Index) or percentage of land occupied by trees (PAV = Percent of Green Areas) (Oliveira, 1996). The existence of the index of 12 m2 of green area/inhabitant, which is considered
as ideal, is rooted and widespread in Brazil and assigned
Table 1. Size and area of forest fragments located in the municipality of Maringá, mapped by using two different sensors
Entire municipality
Forest fragment size Number of polygons Area (ha)
< 500 1,296 48.26
500 - <1,000 380 30.28
1,000 - <5,000 607 137.53
Sub-total TOF 2,283 216.07
Forests 5,000-10,000 156 106.85
>10,000 271 1,552.74
Sub-total Forests 427 1,659.59
Total CCD sensor 2,710 1,875.66
< 500 11,055 266.42
500 - <1,000 3,254 229.05
1,000 - <5,000 3,190 676.23
Sub-total TOFs 17,499 1,171.7
5,000-10,000 465 326.41
Forests >10,000 531 3,014.80
Sub-total Forests 996 3,341.21
Total HRC sensor 18,495 4,512.91
Urban perimeter of the municipality
Forest fragment size Number of polygons Area (ha)
< 500 251 98.88
500 - <1.000 85 67.82
1.000 - <5.000 132 29.18
Sub-total TOFs 468 45.85
5.000-10.000 27 18.87
Forests >10.000 68 341.86
Sub-total Forests 95 360.72
Total CCD sensor 563 406.58
< 500 700 172.61
500 - <1.000 2,163 152.14
1.000 - <5.000 1,997 405.16
Sub-total TOFs 4,860 729.91
5.000-10.000 241 165.54
Forests >10.000 204 899.46
Sub-total Forests 445 1,065.00
Total HRC sensor 5,305 1,794.91
Sensor Forest status
CBERS 2B CCD
CBERS 2B HRC
CBERS 2B CCD
CBERS 2B HRC
TOFs TOFs TOFs TOF
Table 2. Comparison of area/perimeter index of fragments in the entire municipality and within the urban perimeter of Maringá
Number of polygons
HRC CCD
< 5 16,318 800
5-10 1,165 1,319
10-15 14 154
> 15 0 0
Total TOFs 17,497 2,283
< 5 138 0
5-10 616 4
10-15 134 136
> 15 108 287
Total Forest 996 427
< 5 10,657 151
5-10 586 286
10-15 2 31
> 15 0 0
Total TOFs 11,245 468
< 5 90 0
5-10 300 0
10-15 35 27
> 15 20 68
Total Forest 445 95
Urban perimeter
Forest TOF Forest
TOF
Place Type Shape class
Entire municipality
to the UN, WHO and FAO. This index is not known by those institutions and must be assumed as a reference to the categories of neighborhood parks and district/ sector areas useable for outdoor recreation (Cavalhei-ro & Del Picchia, 1992). The Brazilian Society of Urban Forestry (SBAU) proposed as minimum index for public recreation green areas a value of 15 m2 / inhabitant
(SBAU, 1996).
In this context, considering the mapping image with medium resolution imagery (CCD), Maringá was slightly below the lower limit of green area per inhabitant (11.65 m2), considering only the urban area of the city and the
respective population (349,120 inhabitants). However, the interpretation would change completely when considering the mapping of green areas with the high resolution imagery (HRC), i.e., the green area per inhabitant was 3.42 times higher than indicated by SBAU (51.41 m2).
The rural area of the municipality has a different situation, given that the rural population is only 7,997 people and, consequently, the green area per inhabitant is 1,837.05 m2 as mapped by the CCD satellite imagery
and 3,398.77 m2 by the HRC. In the entire municipality,
taking into consideration the total population of 357,117 inhabitants, the green areas per inhabitant are 52.52 m2
and 126.37 m2, respectively for CCD and HRC. These
results demonstrate that it is very important to take into account and analyze separately the green areas in
urban and rural zones when evaluating the forest cover in cities.
Satellite imagery technological advances have improved evaluation of land use and forest cover and helped to determine more accurately the individual green cover rate in urban centers. In Curitiba the green areas were evaluated in the year 2000 by medium-resolution imagery and the individual green rate was of 51.5 m2 per
inhabitant. Another map of forest cover was produced in 2010 and the rate increased to 64.5 m2, by using the
high-resolution GeoEye imagery (SMMA, 2010). This growth in green cover was attributed to technological changes and not to increase in forest cover during the time period. This study shows the role of improvement in geo-technology to provide more reliable information on forest cover focused on the contribution of the small woods, namely TOFs, generally imperceptible by medium-resolution satellite imagery (Table 1).
and stated their concern about theier conservation and ecological role. Further discussion on this issue is necessary, taking into consideration other variables in addition to land cover and area/perimeter ratio.
CONCLUSIONS
TOFs can be more reliably detected and quantified by using high-resolution satellite imagery such as CBERS2 HRC. Medium-resolution imagery such as CCD may underestimate the area of small forest patches and not provide their correct spatial distribution. Cost-benefit analysis must be considered in this context.
The municipality of Maringá’s green cover (forests + TOFs) per inhabitant is above the limit considered by SBAU, if the HRC imagery is used. Otherwise it is a little under that limit. Anyhow, the urban population of Maringa city is provided by an expressive green cover (> 50 m2/
inhabitant), responsible for providing various environmental services to it. The quality and the ecological resilience of these greens should be evaluated in future studies. This paper deals only with their quantification.
Most green patches of Maringá are small-sized (< 500 m2) and scattered across the municipality. Almost 10% of
the urban center of the municipality is represented by TOFs, in opposition to the rural zone, which has 1% of green cover represented by TOFs, as given by the HRC imagery mapping. Overall, TOFs represent 1.1% of the municipality and forest 5.5% of the total territory of the municipality, totaling 6.6%. This forest cover is far from that required by the Brazilian legislation, which is 20% for the Atlantic Forest Biome.
REFERENCES
Albanez ACMP (2000) Caracterização dos fragmentos florestais a partir de estudos de ecologia da paisagem para o município de Ponte Nova, Minas Gerais. Dissertação de Mestrado. Universi-dade Federal de Viçosa, Viçosa. 160p.
Almeida CG (2008) Análise espacial dos fragmentos florestais na área do Parque Nacional dos Campos Gerais. Dissertação de Mestrado. Universidade Estadual de Ponta Grossa. Ponta Gros-sa. 72p.
Bierregaard Jr, Lovejoy TE, Kapos V, Santos AA dos & Hutchings RW (1992) The biological dynamics of tropical rain forest fragments: a prospective comparison of fragment and continuous
forest. BioScience, 42:859-866.
Cavalheiro F & Del Picchia PCD (1992) Áreas Verdes: conceitos, objetivos e diretrizes para o planejamento. In: Encontro Naci-onal sobre Arborização Urbana, 4.,Vitória, 1992. Anais. Vitória, PMV, p.29-38
FAO - Food and Agriculture Organization of the United Nations (2001) Global Forest Assessment FRA - 2000, Main report. FAO Forestry Paper 140. Rome. Italy. Disponível em: <http:// www.fao.org/forestry/32188/en/>. Acessado em: 06 de agosto de 2013.
FAO - Food and Agriculture Organization of the United Nations (2010) Global Forest Assessment 2000, Main report. FAO Forestry Paper 163. Rome. Italy. Disponível em: <http:// www.fao.org/forestry/fra/fra2010/en/>. Acessado em: 06 de agos-to de 2013.
FAO - Food and Agriculture Organization of the United Nations (2011) State of the World’s Forests. Rome. Italy. Access: Dis-ponível em: <http://www.fao.org/docrep/013/i2000e/ i2000e00.htm>. Acessado em: 06 de agosto de 2013.
Herrera-Fernández B (2003) Classification and modeling of trees outside forest in Central American landscapes by combining remotely sensed data and GIS. Dissertação de Mestrado. Albert-Ludwigs-Universität Freiburg, Freiburg. 247p.
IBGE (1992) Manual técnico da vegetação brasileira. Rio de Ja-neiro, Fundação Instituto Brasileiro de Geografia e Estatística – IBGE. 92p.
Kleinn C (2000) On large-area inventory and assessment of trees outside forests. Unasylva, 51:3-10.
Kleinn C (2001) A cautionary note on the minimum crown cover criterion in forest definitions. Canadian Journal of Forestry Research, 31:350-356.
Lang S & Blaschke T (2009) Análise da paisagem com SIG. Ofici-na de Textos, São Paulo. 424p.
Leal L, Bujokas WM & Biondi D (2006) Análise da infestação de erva-de-passarinho na arborização de ruas de Curitiba, PR. Flo-resta, 36:323-330.
Lefkovitch LP & Faring L (1985) Spatial characteristics of habitat patches and population survival. Ecological Modelling, 30:297-308.
Leite P & Klein RM (1990) Vegetação. In: IBGE. Geografia do Brasil: região Sul. v.2. Rio de Janeiro, Instituto Brasileiro de Geografia e Estatística – IBGE. p.113-150.
Maack R (1968) Geografia física do Estado do Paraná. Curitiba, Badep. 350p.
MMA – Ministério do Meio Ambiente (2011) Serviço Florestal Brasileiro. Inventário Florestal Nacional – IFN. Disponível em: <www.ifn.florestal.gov.br> Acessado em: 01 de agosto de 2011.
MMA/PROBIO – Ministério do Meio Ambiente (2007) Mapeamento de cobertura vegetal dos biomas brasileiros. Inserido no Projeto de Conservação e Utilização Sustentável da Diversidade – PROBIO. Disponível em: <http://homolog-w.mma.gov.br/ index.php?ido=publicacao.publicacoesPorSecretaria&idEstrutura =14>. Acessado em: 06 de agosto de 2013.
Nakamura J & Novo E (2005) Mapeamento da mancha urbana utilizando imagens de média resolução: sensores CCD/CBERS2 e TM/Landsat5 – estudo de caso da cidade de Rio Branco-Acre. In: Anais do Simpósio Brasileiro de Sensoriamento Remoto. 12. Goiânia, INPE. 3.843-3. 850p.
Oliveira CH (1996) Planejamento ambiental na cidade de São Carlos (SP) com ênfase nas áreas públicas e áreas verdes: diag-nóstico e proposta. Dissertação de Mestrado. Universidade Fe-deral de São Carlos, São Carlos. 196p.
Ranta P, Blom T, Niemela J, Joensuu E & Sitonen M (1998) The fragmented Atlantic rain forest of Brazil: size, shape an distribuition of forest fragments. Biodiversity and Conservation, 7:385-403.
Santos MN dos (2005) Remanescentes florestais em áreas de pre-servação permanente no estado do Paraná. In: 13º Evento de Iniciação Científica da UFPR. 2005. 1p.
Saunders DA, Hobbs RJ & Margules CR (1991) Biological consequences of ecosystem fragmentation: a review. Conservation Biology, 5:18-34.
SBAU - Sociedade Brasileira de Arborização Urbana (1996) Carta de Londrina e Ibiporã. Boletim Informativo da SBAU, 3:1-3. SMMA - Secretaria Municipal do Meio Ambiente (2010) Curitiba
preserva e aumenta suas áreas verdes. Disponível em: <http:// www.curitiba.pr.gov.br/noticias/curitiba-preserva-e-aumenta-areas-verdes/25478>. Acessado em: 25 de janeiro de 2012.
Veloso HP & Góes-Filho L (1982) Fitogeografia brasileira - clas-sificação fisionômica ecológica da vegetação neotropical.
Bo-letim Técnico Projeto RADAMBRASIL– Série Vegetação,
1:1-80.
Viana VM (1990) Biologia e manejo de fragmentos florestais. In: Anais 6º Congresso Florestal Brasileiro, Campos do Jordão. Anais, CFB. p.113-118.
Viana VM & Pinheiro LAFV (1998) Conservação da biodiversidade em fragmentos florestais. Série Técnica IPEF, 32:25-42. Viana VM, Tabanez AAJ & Martins JLA (1992) Restauração e