Revista Brasileira de
Engenharia Agrícola e Ambiental
Campina Grande, PB, UAEA/UFCG – http://www.agriambi.com.br
v.20, n.6, p.525-532, 2016
Development, yield and quality attributes
of sugarcane cultivars fertigated by subsurface drip irrigation
André L. B. de O. Silva
1, Regina C. M. Pires
1, Rafael V. Ribeiro
2,
Eduardo C. Machado
1, Gabriel C. Blain
1& Augusto Y. P. Ohashi
1 DOI: http://dx.doi.org/10.1590/1807-1929/agriambi.v20n6p525-532A B S T R A C T
The present study aimed to evaluate the development, yield and quality of four sugarcane cultivars fertigated by subsurface drip system. The experiment was carried out in Campinas-SP, Brazil, from January 2012 to November 2013, with the cultivars SP79-1011, IACSP94-2101, IACSP94-2094 and IACSP95-5000 subjected to daily irrigations. The irrigations depths were applied to bring soil moisture to field capacity. Soil moisture was monitored using soil moisture probes. Samples were collected along the crop cycle in order to evaluate crop development and yield, at the end of the first and second ratoons. Stalk height showed good correlation for the estimation of crop yield, with R2 equal to or higher than 0.96. The cultivar IACSP95-5000 showed the highest yield in the first ratoon. In the second ratoon the highest yield was observed in IACSP94-2101, followed by IACSP95-5000 and SP79-1011. Considering the yield results associated with the technological analysis, such as soluble solids content and apparent sucrose, the cultivar IACSP95-5000 excelled the others in the cultivation under subsurface drip irrigation.
Desenvolvimento, produtividade e atributos qualitativos
de cultivares de cana-de-açúcar fertirrigadas
por gotejamento subsuperficial
R E S U M O
Objetivou-se, no presente estudo, avaliar o desenvolvimento, a produtividade e a qualidade de quatro cultivares de canas-de-açúcar fertirrigadas por gotejamento subsuperficial. O experimento foi realizado em Campinas, SP, Brasil, no período de janeiro de 2012 a novembro de 2013, com as cultivares SP79-1011, IACSP94-2101, IACSP94-2094 e IACSP95-5000 com irrigações diárias, sendo a lâmina aplicada para repor a umidade do solo à capacidade de campo. Para tanto foram utilizadas sondas visando à medição da umidade do solo enquanto ao longo dos ciclos foram realizadas biometrias e estimativas da produtividade nas socas. A produtividade final foi estimada no fim de cada soca. A altura dos colmos apresentou boa correlação para estimativa da produtividade da cultura com R2 igual ou maior que 0,96. A maior produtividade na primeira soca foi observada na cultivar IACSP95-5000 e na segunda soca a IACSP94-2101 foi a cultivar mais produtiva seguida das IACSP95-5000 e SP79-1011. Considerando os resultados de produtividade associados à análise tecnológica, como os teores de sólidos solúveis e sacarose aparente, a IACSP95-5000 se sobressaiu no cultivo com irrigação por gotejamento subsuperficial.
Key words: water management water deficit
Saccharum spp.
technological analysis
Palavras-chave: manejo da água déficit hídrico
Saccharum spp.
análise tecnológica
1 Instituto Agronômico/Centro de Pesquisa e Desenvolvimento de Ecofisiologia e Biofísica. Campinas, SP. E-mail: andreluiz.biologia@gmail.com
(Corresponding author); rcmpires@iac.sp.gov.br; caruso@iac.sp.gov.br; gabriel@iac.sp.gov.br; augusto.ohashi@gmail.com
2 Universidade Estadual de Campinas/Instituto de Biologia/Departamento de Biologia Vegetal. Campinas, SP. E-mail: rvr@unicamp.br
Introduction
The demand for renewable energy sources for the reduction in the use of fossil fuel and the generation of energy for the diversification of the energy matrix are aspects of fundamental importance to promote sustainability and economic growth. In this context, the sugar-energy sector expanded the sugarcane cultivation area in order to meet the demand for bioenergy (UNICA, 2013). Despite the expansion in cultivation areas, the national mean yield was 74.8 t ha-1 in the 2013/2014 season
(CONAB, 2013), which can be surpassed considering the potential of the crop of 380 t ha-1 (Waclawovsky et al., 2010).
The occurrence of water deficit, depending on the sugarcane phenological stage, affects its yield (Dalri et al., 2008; Gava et al., 2011). Barbosa et al. (2012) and Ferreira Júnior et al. (2014) observed improvement in production and quality, besides a favoring in the verticalization of sugarcane production, due to the adoption of irrigation in different cultivars and environments. However, different responses of the cultivars to water availability should be taken into account (Ribeiro et al., 2013), with consequent effect on water use efficiency. The knowledge on the response of different genotypes in relation to water deficiency or to the responsiveness to water helps genetic improvement programs (Inman-Bamber & Smith, 2005) and variety management in different cultivation environments.
Studies conducted in the state of São Paulo indicate that, even in environments considered as favorable for the crop, there is an increase in yield due to the use of irrigation. In this context, there were yields above 100 t ha-1 with adequate
values of quality attributes. However, there was variation in the response of different cultivars (Dalri et al., 2008; Gava et al., 2011; Silva et al., 2014; Pires et al., 2014). It is worth while to point out the positive responses of sugarcane cultivars resistant to drought under irrigation (Ribeiro et al., 2013). Thus, it is important to evaluate the response of cultivars with different characteristics related to water availability for the cultivation under irrigated conditions. In this context, the present study aimed to evaluate the development, yield and quality attributes of four sugarcane cultivars, SP79-1011, IACSP94-2101, IACSP94-2094 and IACSP95-5000, irrigated by subsurface drip irrigation during the 1st and 2nd ratoon cycles,
in Campinas, SP, Brazil.
Material and Methods
The experiment was carried out in Campinas, SP, Brazil (22° 54’ 20” S; 47° 03’ 39” W; 669 m), a region with mean air temperature of 23.8 ºC in February and 17.8 ºC in July, total mean annual rainfall of 1,398 mm, winter with a few (or without) rains and rainy summer (Blain, 2012). The soil was classified as eutrophic Red Latosol, well-drained, with clay content ranging from 400 to 510 g kg-1 until the depth of
0.80 m. Along the experimental period, data of air temperature, rainfall and relative air humidity were collected in an automatic weather station located beside the experimental area. The evaluated sugarcane cultivars were: SP79-1011, IACSP94-2101, IACSP94-2094 and IACSP95-5000. These cultivars differ with respect to leaf architecture; two have arched leaves
(IACSP95-5000 and IACSP94-2094) and two have lanceolate leaves (IACSP94-2101 and SP79-1011). IACSP95-5000 and IACSP94-2101 are responsive to environments with good water availability and indicated for favorable environments (Landell & Bressiani, 2008). IACSP94-2094 is considered as rustic, drought-resistant and indicated for less favorable environments (Landell & Bressiani, 2008; Ribeiro et al., 2013). SP79-1011 has characteristics of tolerance to drought (Oliveira et al., 2010).
The experimental area consisted of 40 planting rows with length of 60 m, spaced by 1.5 m, totaling an area of 3600 m². Due to the homogeneous characteristics related to soil fertility and topography, the treatments (cultivars) were arranged in a completely randomized treatment with four replicates and each plot had 8 rows with length of 15 m, with two external rows and 2 m at the end of each row as borders. When biometric evaluations with collection of plants were performed, they always considered a minimum of one border row between samplings and 2 m of planting row.
Irrigation was performed through a subsurface drip system, with one drip line per planting row. The drip lines were installed before planting, 0.20 m deep in the furrows. The emitters had nominal flow rate of 1.6 L h-1 and were spaced by 0.50 m.
After the installation of the drip lines, sugarcane was planted in May 2010, with approximately 18 buds per meter at depth of 0.15 m. Soil water monitoring and irrigation management were performed using the capacitance probes Enviroscan (Sentek Sensor Technologies, Stepney, Australia) and Diviner 2000 (Sentek Sensor Technologies, Stepney, Australia), with measurements of soil moisture every 0.10 m until the depth of 1.0 m. For the monitoring, 3 access tubes per cultivar were installed for soil moisture readings, with the Diviner 2000, and 1 access tube per cultivar, for the EnviroScan probe, with length of 1.0 m and internal diameter of 0.051 m. Then, soil moisture at the upper limit of soil water retention (field capacity) was determined at the field.
Irrigations were daily performed in order to maintain soil moisture close to field capacity in the layer of 0.20-0.40 m. Irrigations were suspended when rainfalls occurred and at the end of the cycle, in order to favor sugarcane maturation in the 2nd ratoon for 40 days before harvest. In the 1st ratoon, it was
not possible to suspend irrigations, because an accidental fire occurred in the experimental area, before the end of the cycle.
Fertilizations were performed according to the recommen-dations of Raij et al. (1996), based on the results of soil chemical analysis. Samplings occurred in January 2012 and 2013. The soil was separately sampled for each cultivar, every 0.20 m from soil surface until the depth of 1.0 m in the 1st ratoon; in the 2nd
ratoon, sampling was performed every 0.10 m from soil surface until the depth of 0.40 m, and then every 0.20 m until 1.0 m.
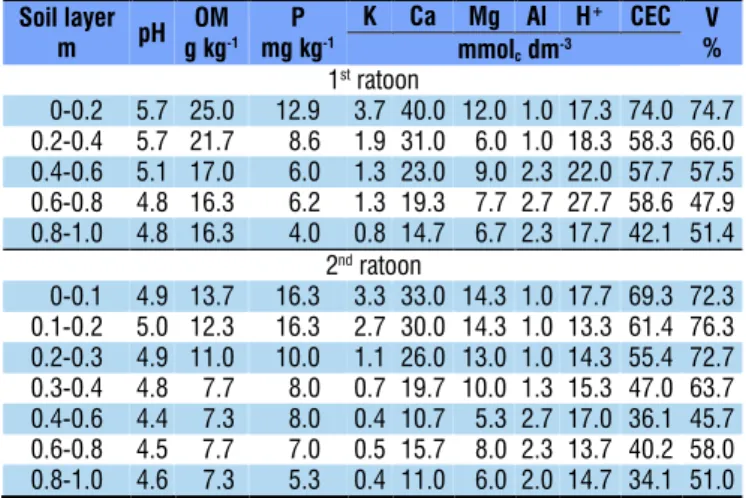
Both evaluated cycles received the total dose of phosphorus (P) and 40% of the doses of nitrogen (N) and potassium (K) as top-dressing, while the rest was applied through weekly fertigations. The mean contents of macro and micronutrients in the soil are shown in Table 1, which refer to mean values of the areas of the four cultivars, because they were similar.
The recommendation of fertilization was the same for the 1st and 2nd ratoons; 45 kg ha-1 of P
2O5 as single superphosphate,
120 kg ha-1 of K
2O and 120 kg ha
-1 of N. The N source in the
1st ratoon was ammonium nitrate and, since pH values were
higher in the 1st ratoon, compared with the 2nd one, the N source
in the 2nd ratoon was changed to calcium nitrate.
Based on the number of stalks per meter, stalk height, stalk fresh matter, leaf area index (LAI) and yield estimation (tons of stalks per hectare – TSH), biometric evaluations were performed in four different periods in both ratoon cycles. During the 1st ratoon, the evaluations were performed at 31,
123, 186 and 275 days after harvest (DAH). In the 1st ratoon, an
accidental fire occurred in the experimental area on October 1, 2012; thus, the last biometric evaluation was harmed and harvest was anticipated. As a result, the 1st ratoon cycle lasted
for approximately nine months, while the 2nd ratoon cycle lasted
for 13 months, with evaluations at 107, 220, 308 and 400 DAH. For TSH estimation, plants along 2 m of the planting row were collected in each replicate, for each cultivar, and the stalks were weighed on a scale with precision of 0.01 kg. From the stalks collected for TSH estimation, in each replicate, a subsample was collected with 5 stalks per replicate for biometric evaluation (height, fresh matter and dry matter). Plant height was measured from the base of the stalk until the insertion of the first leaf with visible ligule.
Leaf area was measured with a planimeter (LI-3000A – Li-Cor, Lincoln NE, USA), using only green leaves from three stalks per replicate. Leaf area index (LAI) was estimated considering the relationship between the area of the leaves and the estimated area occupied by the three stalks, obtained through the count in the experimental area.
Technological analysis was performed at 275 DAH in the 1st ratoon and at 400 DAH in the 2nd ratoon. In the 1st ratoon,
it was not possible to suspend irrigation in order to favor sugarcane maturation due to the anticipated harvest resulting from the fire; in the 2nd ratoon, the technological analysis was
performed 43 days after suspending irrigations. Technological analyses followed the methodology of CONSECANA (2012), through the collection of 10 stalks with four replicates for each cultivar, totaling 40 stalks per cultivar. The samples were sent to the laboratory and the following attributes were determined: apparent sucrose in the juice (POL juice), apparent sucrose in the cane (POL cane), purity, total recoverable sugar (TRS, kg t-1) and soluble solids (SS, °Brix).
The obtained results were subjected to analysis of variance and the means were compared by Tukey test at 0.05 probability level. Potential correlation between TSH and stalk height was determined in order to evaluate its potentiality of use for TSH estimation.
Results and Discussion
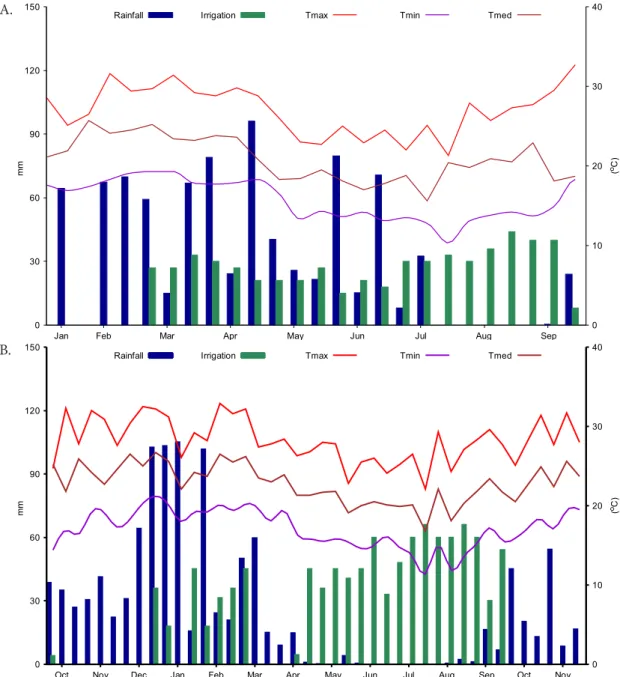
The rainfalls and irrigation depths during the experimental period were equal to 978.6 and 579 mm in the 1st ratoon (Figure
1A) and 1100.9 and 1046.5 mm in the 2nd ratoon (Figure 1B),
respectively. Irrigation depths and rainfalls differed between the evaluated cycles, especially due to the different durations of each cycle.
There were no rains in the 1st ratoon from late July to the
first ten days of September, and in the 2nd ratoon from June to
late August (Figure 1A and B). It should be pointed out that, even in the period from January to March in the 1st ratoon
and from December to March in the 2nd ratoon, in which
the accumulated rainfall reached high values, the rainfall events occurred with irregular distribution and irrigation was necessary. In total, 180 irrigations were performed during the 1st ratoon and 200 irrigations during the 2nd ratoon.
Daily mean air temperature along the experimental period varied from 17 to 29 °C and from 16.8 to 26.7 °C in the 1st
and 2nd ratoons, respectively (Figure 1A and B). Sugarcane
growth is not affected by mean air temperature values from 22 to 30 ºC (Singels et al., 2005a). These authors also report that sugarcane growth is affected by mean air temperature below 15 ºC. Therefore, most values in both evaluated cycles were adequate for crop development (Singels et al., 2005b).
Tables 2 and 3 show the number of stalks per meter and stalk fresh matter along the ratoon cycles of the four evaluated cultivars. In the 1st ratoon, there was difference in the number
of stalks in the first two evaluations, especially for the cultivar IACSP94-2094 (Table 2). In the 2nd ratoon, the cultivar
IACSP94-2094 also showed the highest number of stalks in three evaluations, at 33, 123 and 186 DAH. Only in the last evaluation, at 400 DAH, the cultivar IACSP94-2101 showed the highest value in comparison to the others.
As to the mean mass per stalk, the cultivar IACSP95-5000 was superior to IACSP94-2094 in the last three evaluations of both ratoons (Table 3), although the latter stood out regarding the mean number of stalks per meter (Table 2).
In the 1st ratoon, at 33 DAH, the cultivars IACSP94-2094
and IACSP94-2101 showed higher stalk heights in comparison to the others (Table 4). In the second evaluation, the cultivar IACSP94-2101 showed the lowest value and did not differ from IACSP94-2094 and SP79-1011. In the last two evaluations, at 186 and 275 DAH, the cultivar IACSP95-5000 showed the highest values of stalk height, differing from the others.
In the 2nd ratoon, in the first evaluation (107 DAH), there
were no differences in stalk height between the cultivars and, at 220 DAH, the height of the cultivar IACSP95-5000 stood out from the others. In the third evaluation, at 308 DAH, the cultivar IACSP95-5000 continued to stand out from the others. In this evaluation, there was no difference between the heights of the cultivars IACSP94-2101 and SP79-1011.
OM - Organic matter; CEC - Cation exchange capacity; V% - Base saturation
Soil layer
m pH
OM g kg-1
P mg kg-1
K Ca Mg Al H+ CEC V
% mmolcdm-3
1stratoon
0.0-0.2 5.7 25.0 12.9 3.7 40.0 12.0 1.0 17.3 74.0 74.7
0.2-0.4 5.7 21.7 8.6 1.9 31.0 6.0 1.0 18.3 58.3 66.0
0.4-0.6 5.1 17.0 6.0 1.3 23.0 9.0 2.3 22.0 57.7 57.5
0.6-0.8 4.8 16.3 6.2 1.3 19.3 7.7 2.7 27.7 58.6 47.9
0.8-1.0 4.8 16.3 4.0 0.8 14.7 6.7 2.3 17.7 42.1 51.4
2ndratoon
0.0-0.1 4.9 13.7 16.3 3.3 33.0 14.3 1.0 17.7 69.3 72.3
0.1-0.2 5.0 12.3 16.3 2.7 30.0 14.3 1.0 13.3 61.4 76.3
0.2-0.3 4.9 11.0 10.0 1.1 26.0 13.0 1.0 14.3 55.4 72.7
0.3-0.4 4.8 7.7 8.0 0.7 19.7 10.0 1.3 15.3 47.0 63.7
0.4-0.6 4.4 7.3 8.0 0.4 10.7 5.3 2.7 17.0 36.1 45.7
0.6-0.8 4.5 7.7 7.0 0.5 15.7 8.0 2.3 13.7 40.2 58.0
0.8-1.0 4.6 7.3 5.3 0.4 11.0 6.0 2.0 14.7 34.1 51.0
Table 1. Chemical analysis of the soil sampled in January
0 30 60 90 120 150
Jan Feb Mar Apr May Jun Jul Aug Sep
0 10 20 30 40
mm o(C)
Rainfall Irrigation Tmax Tmin Tmed
0 30 60 90 120 150
Oct Nov Dec Jan Feb Mar Apr May Jun Jul Aug Sep Oct Nov
0 10 20 30 40
mm o(C)
Rainfall Irrigation Tmax Tmin Tmed
A.
B.
Figure 1. Total values of rainfall and irrigation every 10 days and mean values of maximum, minimum and mean air
temperature during the experimental period for the 1st (A) and the 2nd (B) ratoons
Table 2. Mean number of stalks per meter for the sugarcane cultivars IACSP95-5000, IACSP94-2101, IACSP94-2094
and SP79-1011, in four evaluations during the 1st and 2nd
ratoons*
Table 3. Stalk fresh matter (kg) for the sugarcane cultivars IACSP95-5000, IACSP94-2101, IACSP94-2094 and
SP79-1011, in four evaluations during the 1st and 2nd
ratoons* Number of stalks per meter – 1stratoon
Cultivars 33 DAH 123 DAH 186 DAH 275 DAH
IACSP95-5000 38.50 ab 22.25b 20.13 a 20.13 a
IACSP94-2094 48.25 a 34.00 a 24.63 a 21.63 a
IACSP94-2101 26.00b 23.00b 23.00 a 16.38 a
SP79-1011 33.88b 24.75ab 20.88 a 18.75 a
LSD 13.66 9.63 5.41 7.88
CV (%) 17.75 17.64 11.62 19.52
Number of stalks per meter* - 2ndratoon
Cultivars 107 DAH 220 DAH* 308 DAH 400 DAH
IACSP95-5000 26.88 a 21.50 a 23.38 ab 18.13c
IACSP94-2094 29.25 a 26.50 a 27.75 a 27.50 ab
IACSP94-2101 22.25 a 21.13 a 23.25 ab 28.50 a
SP79-1011 20.75 a 19.88 a 20.50b 19.75bc
LSD 9.08 6.94 4.72 8.50
CV (%) 17.45 14.84 9.48 17.24
Stalks fresh matter (kg) – 1stratoon
Cultivars 33 DAH 123 DAH 186 DAH 275 DAH
IACSP95-5000 0.03 a 0.77 a 1.07 a 1.07 a
IACSP94-2094 0.04 a 0.45 b 0.60 c 0.61b
IACSP94-2101 0.06 a 0.59 b 0.76 bc 0.87 ab
SP79-1011 0.03 a 0.60 b 0.85 ab 0.84 ab
LSD 0.03 0.16 0.23 0.29
CV (%) 40.00 12.64 13.61 16.11
Stalks fresh matter (kg) – 2ndratoon
Cultivars 107 DAH 220 DAH* 308 DAH 400 DAH
IACSP95-5000 0.24 a 1.17 a 1.32 a 1.81 a
IACSP94-2094 0.20 a 0.74b 0.72 c 0.98b
IACSP94-2101 0.23 a 0.84b 1.02b 1.30 ab
SP79-1011 0.33 a 0.93b 1.41 a 1.42 ab
LSD 0.14 0.20 0.26 0.52
CV (%) 26.15 10.34 10.98 17.83
*Means followed by the same letters in the columns do not differ statistically by Tukey test at 0.05 probability level (p < 0.05);
LSD – Least significant difference; CV – Coefficient of variation; DAH – Days after harvest
*Means followed by the same letters in the columns do not differ statistically by Tukey test at 0.05 probability level (p < 0.05);
In the last two evaluations (308 and 400 DAH), the cultivar IACSP94-2094 showed the lowest values of stalk height, compared with the others. At 400 DAH, there was no significant difference between the heights of the cultivars IACSP94-2101, IACSP95-5000 and SP79-1011.
The stalk growth rate in the 1st ratoon was vigorous during
the period from 33 to 123 DAH (Table 4), with increment of approximately 0.02 m d-1. However, there was a reduction to
0.01 m d-1 from 123 DAH on, which may be related to the
decrease in mean air temperature in the period (Figure 1) and to crop phenological stage. Almeida et al. (2008) reported stalk height values close to the maximum at 120 DAH in SP79-1011, as observed in Table 4. In the 2nd ratoon, considering a cycle
longer than that of the 1st ratoon, the cultivars showed mean
growth rate of 0.01 m d-1 along the total evaluation period,
until 400 DAH.
In both cultivation cycles, considering the mean of the four cultivars, the growth rates remained below that observed by Ham et al. (2000) in a study with other cultivars in Australia; these authors reported values of up to 0.033 m d-1. On the other
hand, Ferreira Júnior et al. (2014) studied the development of irrigated sugarcane in Brazil and observed mean and maximum growth rates of 0.013 and 0.0165 m d-1, respectively, which are
close to the values found in the present study.
Although the sampling dates and the values obtained for the cultivars were different in the evaluated cycles, the growth curve was similar to that expected for the crop, according to Machado et al. (1982) and Inman-Bamber (2004).
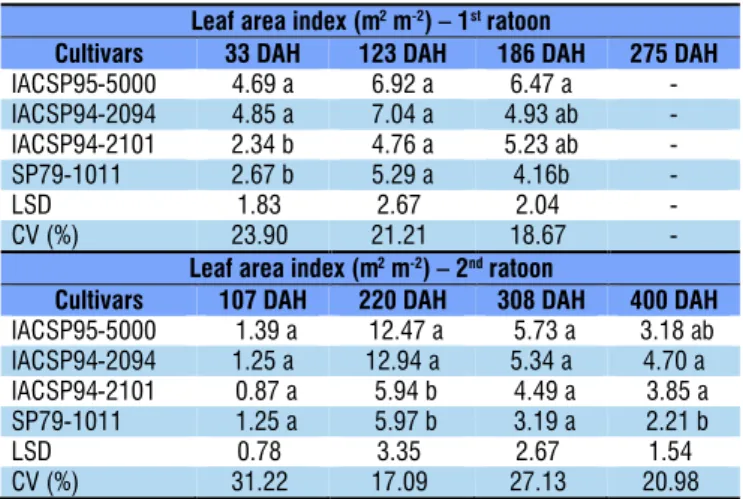
In the 1st ratoon, at 33 DAH, the cultivars IACSP95-5000
and IACSP94-2094 excelled the others; however, at 123 DAH, there was no variation in the LAI of the cultivars (Table 5). At 186 DAH, the observed LAI of IACSP95-5000 was superior to the value of SP79-1011. The LAI values obtained in the cultivars IACSP94-2101 and IACSP94-2094 did not differ from the others (Table 5). In the last sampling, only the LAI of IACSP94-2101 showed increase in relation to the previous evaluation.
In the 2nd ratoon (Table 5), the cultivars IACSP94-2094 and
IACSP95-5000 showed LAI values above those of the others
at 220 DAH, reaching 12.9 and 12.5 (m² m-²), respectively.
At 308 DAH, the LAI values of the cultivars IACSP95-5000 and IACSP94-2094 showed a sharp decrease in relation to the previous evaluation, reaching 5.73 and 5.34 (m² m-²),
respectively. This reduction in LAI from 308 to 400 DAH is probably related to the lodging that occurred in the area and the senescence of the leaves. The cultivars IACSP94-2101 and SP79-1011 showed LAI values of 4.49 and 3.19 (m² m-²),
respectively, also with reduction in relation to the previous evaluation. The reduction in LAI values in the 2nd ratoon
occurred simultaneously to the increase in stalk fresh matter (Table 3) from the sampling of 220 DAH.
According to the LAI values observed in both ratoon cycles (Table 5), there was a variation in their magnitude, which can be attributed to the differences of duration of the cultivation cycle and the environmental conditions observed during the cycles.
LAI values in the 1st ratoon are close to those obtained by
Muchow et al. (1996), who observed 2.5 and 6.8 at 167 and 297 days after planting, respectively. These authors also observed reduction in LAI at the end of the cycle. In the 2nd ratoon, the
LAI values of the cultivars IACSP94-2094 and IACSP95-5000 reached 12.9 and 12.5, thus being higher than those observed by Muchow et al. (1996).
From 308 DAH on, in the 2nd ratoon (Table 5), there was a
reduction in LAI for all cultivars, which may be related to the decrease in the number of green leaves and the senescence of the leaves, characteristic of this development stage (Inman-Bamber & Smith, 2005). On senescence, Ramesh (2000) reports reduction in the energy expenditure for the formation of leaves after 279 DAH in sugarcane, which can also lead to LAI reduction. The values observed in both ratoons were close to those reported by Machado et al. (1985), who found LAI close to 4 (m² m-²), which is sufficient to intercept 95% of the
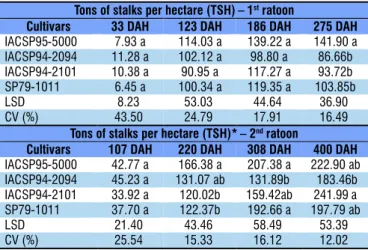
incident solar radiation. Sugarcane yield, in tons of stalk per hectare (TSH), in both evaluated cycles is shown in Table 6. In the 1st ratoon (Table 6), there was no difference between
the values obtained in the first three evaluations (33, 123 and 275 DAH); on the other hand, in the last evaluation, there
Table 4. Mean stalk height (m) for the sugarcane cultivars IACSP95-5000, IACSP94-2101, IACSP94-2094 and
SP79-1011, in four evaluations during the 1st and 2nd ratoons*
Height (m) – 1stratoon
Cultivars 33 DAH 123 DAH 186 DAH 275 DAH
IACSP95-5000 0.50 b 2.04 a 2.36 a 2.37 a
IACSP94-2094 0.66 a 1.72 ab 2.12 b 2.03 b
IACSP94-2101 0.66 a 1.71b 2.14 b 1.99 b
SP79-1011 0.40 b 1.77ab 2.11 b 2.05 b
LSD 0.12 0.33 0.19 0.29
CV (%) 10.62 8.68 4.16 6.56
Height (m) – 2ndratoon
Cultivars 107 DAH 220 DAH 308 DAH 400 DAH
IACSP95-5000 1.16 a 2.70 a 3.26 a 3.08 a
IACSP94-2094 1.08 a 2.31 b 2.46 c 2.73 b
IACSP94-2101 1.10 a 2.39 b 2.78 b 3.10 a
SP79-1011 1.07 a 2.23 b 2.95 b 3.04 a
LSD 0.16 0.21 0.24 0.14
CV (%) 6.81 4.11 3.92 2.25
*Means followed by the same letters in the columns do not differ statistically by Tukey test at 0.05 probability level (p < 0.05);
LSD – Least significant difference; CV – Coefficient of variation; DAH – Days after harvest
Table 5. Leaf area index (LAI) of the sugarcane cultivars IACSP95-5000, IACSP94-2101, IACSP94-2094 and
SP79-1011 in the 1st and 2nd ratoons*
Leaf area index (m2m-2) – 1stratoon
Cultivars 33 DAH 123 DAH 186 DAH 275 DAH
IACSP95-5000 4.69 a 6.92 a 6.47 a
-IACSP94-2094 4.85 a 7.04 a 4.93 ab
-IACSP94-2101 2.34 b 4.76 a 5.23 ab
-SP79-1011 2.67 b 5.29 a 4.16b
-LSD 1.83 2.67 2.04
-CV (%) 23.90 21.21 18.67
-Leaf area index (m2m-2) – 2ndratoon
Cultivars 107 DAH 220 DAH 308 DAH 400 DAH
IACSP95-5000 1.39 a 12.47 a 5.73 a 3.18 ab
IACSP94-2094 1.25 a 12.94 a 5.34 a 4.70 a
IACSP94-2101 0.87 a 5.94 b 4.49 a 3.85 a
SP79-1011 1.25 a 5.97 b 3.19 a 2.21 b
LSD 0.78 3.35 2.67 1.54
CV (%) 31.22 17.09 27.13 20.98
*Means followed by the same letters in the columns do not differ statistically by Tukey test at 0.05 probability level (p < 0.05);
was difference in TSH values and the cultivar IACSP95-5000 showed the highest value (141.9 t ha-1), with approximately 9
months of cycle duration.
In the 2nd ratoon, there were no differences in TSH between
the cultivars at 107 DAH (Table 6); in the other evaluations, there were differences between the cultivars and, at 400 DAH, the highest values were obtained by the cultivars IACSP94-2101, IACSP95-5000 and SP79-1011. The TSH value observed in IACSP94-2094 was lower than that of IACSP94-2101.
Yield values were higher in the 2nd ratoon, for all the
cultivars (Table 6). The shorter duration of the 1st ratoon and
the lower number of stalks per meter for most cultivars (Table 2) certainly contributed to it.
The effect of irrigation on sugarcane production in environments considered as favorable for cultivation in the state of São Paulo has been evaluated in different cultivars (Dalri et al., 2008; Gava et al., 2011; Silva et al., 2014; Pires et al., 2014). Considering the TSH results obtained in the 1st ratoon (Table 6), Gava et al. (2011) and Silva et al. (2014)
obtained mean values similar to those of the present study (Table 6). On the other hand, Dalri et al. (2008) and Pires et al. (2014) obtained higher values (Table 6), except for the cultivar IACSP95-5000, which reached values similar to those reported by Pires et al. (2014). It should be pointed out that the TSH values shown in Table 6 were obtained in cycle with duration of about 9 months, while these authors worked with cycles close to 12 months.
In the 2nd ratoon (Table 6), all the evaluated cultivars showed
TSH higher than that observed by Dalri et al. (2008), Gava et al. (2011), Silva et al. (2014) and Pires et al. (2014). Thus, comparing the yield values obtained under irrigated conditions in plantations of regions suitable for rainfed conditions, it was observed that, although some cultivars stood out (Table 6), they showed potential for use in areas under subsurface drip irrigation. Based on the data obtained in both ratoons, some models were adjusted in order to verify the relationship between the parameters and allow estimations that are important for the monitoring of crop performance, yield and planning.
The measurement of mean height of stalks proved to be an interesting parameter for the estimation of yield of different cultivars (Figure 2). In addition, it should be pointed out that such estimation is a relevant tool in decision-taking and planning, besides being easily measured under field conditions.
The quality attributes POL juice (%), POL cane (%), Purity (%), total recoverable sugar (TRS) and content of soluble solids (SS) were evaluated in both ratoons (Table 7). There were no
Table 6. Sugarcane yield in tons of stalks per hectare (TSH) for the cultivars IACSP95-5000, IACSP94-2101, IACSP94-2094 and SP79-1011, in four evaluations during
the 1st and 2nd ratoons*
Tons of stalks per hectare (TSH) – 1stratoon
Cultivars 33 DAH 123 DAH 186 DAH 275 DAH
IACSP95-5000 7.93 a 114.03 a 139.22 a 141.90 a
IACSP94-2094 11.28 a 102.12 a 98.80 a 86.66b
IACSP94-2101 10.38 a 90.95 a 117.27 a 93.72b
SP79-1011 6.45 a 100.34 a 119.35 a 103.85b
LSD 8.23 53.03 44.64 36.90
CV (%) 43.50 24.79 17.91 16.49
Tons of stalks per hectare (TSH)* – 2ndratoon
Cultivars 107 DAH 220 DAH 308 DAH 400 DAH
IACSP95-5000 42.77 a 166.38 a 207.38 a 222.90 ab
IACSP94-2094 45.23 a 131.07 ab 131.89b 183.46b
IACSP94-2101 33.92 a 120.02b 159.42ab 241.99 a
SP79-1011 37.70 a 122.37b 192.66 a 197.79 ab
LSD 21.40 43.46 58.49 53.39
CV (%) 25.54 15.33 16.12 12.02
*Means followed by the same letters in the columns do not differ statistically by Tukey test at 0.05 probability level (p < 0.05);
LSD – Least significant difference; CV – Coefficient of variation; DAH – Days after harvest
Figure 2. Correlation between tons of stalk per hectare (TSH) and stalk height (m) for the sugarcane cultivars IACSP95-5000, IACSP94-2101, IACSP94-2094 and
SP79-1011, in eight evaluations integrating the cycles of the 1st
and 2nd ratoons
1.0 1.5 2.0 2.5 3.0 3.5 4.0
y = 32.29x R = 0.99
1.68 2
Height (m) 0
50 100 150 200 250 300
0.0 0.5
TS
H
D. 0 50 100 150 200 250 300
y = 28.23x R = 0.96
1.87 2
TS
H
C. 0 50 100 150 200 250 300
y = 26.64x R = 0.97
1.85 2
TS
H
B. 0 50 100 150 200 250 300
y = 29.68x R = 0.99
1.77 2
TS
H
differences in quality attributes in the 1st ratoon; however,
there were differences between the cultivars in the 2nd ratoon.
According to the data of POL juice, POL cane and TRS, the cultivars IACSP95-5000 and IACSP94-2094 stood out. POL cane values in the 2nd ratoon were higher compared with the 1st
ratoon, which is possibly associated with the shorter duration of the 1st ratoon, as well as with the fact that irrigations had not
been suspended yet. This criterion of suspension of irrigations before harvest has been adopted by many authors in order to favor maturation (Pires et al., 2008; Inman-Bamber & Smith, 2005). Gava et al. (2011) and Silva et al. (2014) obtained mean values of POL cane similar to those found in the present study (Table 7). As to POL juice, Pires et al. (2014) observed lower values in a study conducted in northern São Paulo state. The positive effect of the suspension of irrigations in the period prior to harvest and the favoring of quality attributes of the juice were reported by Pires et al. (2008).
The four studied cultivars showed similar values of purity, which were above the minimum, 85% (CONSECANA, 2012) (Table 7). Silva et al. (2014) observed values similar and slightly below those shown in Table 6, considering both ratoon cycles. TRS values in the 1st ratoon (Table 7) were similar to
those obtained by Silva et al. (2014), working with the mean of eight cultivars. The values observed in all evaluated quality parameters in Table 7 reached the standards, according to CONSECANA (2012). In the 2nd ratoon, the cultivar
IACSP95-5000 showed the highest TRS value in comparison to IACSP94-2101 and SP79-1011. The values obtained by the four cultivars in the 2nd ratoon were higher than those reported
by Dalri et al. (2008), Silva et al. (2014) and Pires et al. (2014). As to soluble solids, there was no difference between the evaluated cultivars (Table 7). In the 1st ratoon, the values are
equal to or higher than 18° Brix, with no difference between cultivars. In the 2nd ratoon, with the suspension of the irrigations
and the fact that the cultivation cycle was completed, the values of soluble solids were higher in all cultivars, compared with the 1st ratoon, and higher than 20° Brix. However, there was no
difference between the cultivars in the 2nd ratoon. The values
of soluble solids are within the adequate range, according to Ripoli & Ripoli (2006), in relation to the 1st ratoon.
The obtained values evidenced differences between the evaluated genetic materials in response to irrigation. This information is relevant for purposes of planning and variety management of the crop.
Conclusions
1. The yield of the cultivar IACSP95-5000 was higher compared with the others in the 1st ratoon, while the cultivars
IACSP94-2101, IACSP95-5000 and SP79-1011 stood out in the 2nd ratoon.
2. Considering the results of yield associated with the quality attributes POL cane, POL juice and TRS, the cultivar IACSP95-5000 excelled the others in the cultivation under subsurface drip irrigation in Campinas, SP, Brazil.
Literature Cited
Almeida, A. C. dos S.; Souza, J. L.; Teodoro, I.: Barbosa, G. V. S.; Moura Filho, G.: Ferreira Júnior, R. A. F. Desenvolvimento vegetativo e produção de variedades de cana-de-açúcar em relação à disponibilidade hídrica e unidades térmicas. Ciência e Agrotecnologia, v.32, p.1441-1448, 2008. http://dx.doi. org/10.1590/S1413-70542008000500013
Barbosa, E. A. A.; Arruda, F. B.; Pires, R. C. M.; Silva, T. J. A.; Sakai, E. Revista Brasileira de Engenharia Agrícola e Ambiental v.16, p.952-958, 2012. http://dx.doi.org/10.1590/S1415-43662012000900005 Blain, G. C. Monthly values of the standardized precipitation index in the State of São Paulo, Brazil: trends and spectral features under the normality assumption. Bragantia, v.71, p.122-131, 2012. http:// dx.doi.org/10.1590/S0006-87052012005000004
CONAB - Companhia Nacional de Abastecimento. Acompanhamento da safra brasileira: Cana-de-açúcar, terceiro levantamento, Janeiro 2011. Brasília: CONAB, 2013. 19p.
CONSECANA - Conselho dos Produtores de Cana-de-açúcar, açúcar e Álcool do Estado de São Paulo. Normas para avaliação da qualidade da cana-de-açúcar para o Estado de São Paulo (anexo 1). http://www.unica.com.br. 10 Ago. 2012.
Dalri, A. B.; Duenhas, L. H.; Garcia, C. J. B.; Cruz, R. L. Subsurface drip irrigation on sugarcane yield and quality. Irriga, v.13, p.1-11, 2008. Ferreira Júnior, R. A.; Souza, J. L; Escobedo, J. F; Teodoro, I; Lyra, G;
Araújo Neto, R. A. Cana-de-açúcar com irrigação por gotejamento em dois espaçamentos entrelinhas de plantio. Revista Brasileira de Engenharia Agrícola e Ambiental, v.18, p.798-804, 2014. http:// dx.doi.org/10.1590/1807-1929/agriambi.v18n08p798-804 Gava, G. J. C.; Silva, M. A.; Silva, R. C.; Jeronimo, E. M.; Cruz, J. C. S.;
Kölln, O. T. Produtividade de três cultivares de cana-de-açúcar sob manejos de sequeiro e irrigado por gotejamento. Revista Brasileira de Engenharia Agrícola e Ambiental, v.15, p.250-255, 2011. http:// dx.doi.org/10.1590/S1415-43662011000300005
Ham, G.; McGuire, P.; Kingston, G. Irrigation of sugarcane. In: Hogarth, D. M; Allsopp, P. G. (ed.) Manual of cane growing. Brisbane: Bureau of Sugar Experiment Stations. 2000. 436p. Inman-Bamber, N. G. Sugarcane water stress criteria for irrigation
and drying off. Field Crops Research, v.89, p.107-122, 2004. http:// dx.doi.org/10.1016/j.fcr.2004.01.018
Table 7. Statistical analysis of means of POL juice, POL
cane, purity, total recoverable sugar (TRS, kg t-1) and soluble
solids (SS, °Brix) of the sugarcane cultivars IACSP95-5000, IACSP94-2094, IACSP94-2101 and SP79-1011 under
subsurface drip irrigation, in the 1st and 2nd ratoons*
Cultivars POL juice POL cane Purity TRS
(kg t-1) SS (°Brix) (%)
Technological analyses – 1stratoon
IACSP95-5000 16.99 a 14.41 a 90.05 a 141.54 a 18.88 a
IACSP94-2094 16.58 a 13.80 a 92.01 a 135.16 a 18.02 a
IACSP95-2101 17.16 a 14.28 a 91.96 a 139.67 a 18.66 a
SP79-1011 16.59 a 13.91 a 91.06 a 136.43 a 18.22 a
LSD 1.10 0.94 2.21 8.76 1.08
CV (%) 3.61 3.69 1.34 3.50 3.24
Technological analyses – 2ndratoon
IACSP95-5000 19.98 a 16.88 a 92.03 a 164.46 a 21.71 a
IACSP94-2094 19.45ab 15.98 ab 93.06 a 155.61 ab 20.90 a
IACSP95-2101 18.87bc 15.69 b 91.36 a 153.31 b 20.65 a
SP79-1011 18.29 c 15.26 b 84.61 a 150.94 b 22.14 a
LSD 1.06 1.07 14.69 9.76 4.55
CV (%) 2.64 3.20 7.75 2.98 10.15
*Means followed by the same letters in the columns do not differ statistically by Tukey test at 0.05 probability level (p < 0.05);
Inman-Bamber, N. G.; Smith, D. M. Water relations in sugarcane and response to water deficits. Field Crops Research, v.92, p.185-202, 2005. http://dx.doi.org/10.1016/j.fcr.2005.01.023
Landell, M. G. A.; Bressiani, J. A. Melhoramento genético, caracterização e manejo varietal. In: Dinardo-Miranda, L. L.; Vasconcelos, A. C. M.; Landell, M. G. A. (ed.). Cana-de-açúcar. Campinas: Instituto Agronômico, 2008. p.101-155.
Machado, E. C; Pereira, A. R.; Camargo, M. B. P.; Fahl, J. I. Relações radiométricas de uma cultura de cana-de-açúcar. Bragantia, v.44, p.229-238, 1985. http://dx.doi.org/10.1590/S0006-87051985000100021
Machado, E. C; Pereira, A. R.; Fahl, J. I.; Arruda, H. V.; Cione, J. Índice biométrico de duas variedades de cana-de-açúcar. Pesquisa Agropecuária Brasileira, v.17, p.1323-1329, 1982.
Muchow, R. C.; Robertson, M. J. Wood, A. W. Growth of sugarcane under high input conditions in tropical Australian. II. Sucrose accumulation and commercial yield, Field Crops Research, v.48, p.27-36, 1996. http://dx.doi.org/10.1016/0378-4290(96)00042-1 Oliveira, E. C. A.; Oliveira, R. I.; Andrade, B. M. T.; Freire, F. J.;
Lira Júnior, M. A.; Machado, P. R. Crescimento e acúmulo de matéria seca em variedades de cana-de-açúcar cultivadas sob irrigação plena. Revista Brasileira de Engenharia Agrícola e Ambiental, v.14, p.951-960, 2010. http://dx.doi.org/10.1590/ S1415-43662010000900007
Pires, R. C. M.; Arruda, F. B.; Sakai, E.; Cavalheiros, R. D. O.; Brunini, O. Agricultura irrigada. Revista Tecnologia & Inovação Agropecuária, v.1, p.98-111, 2008.
Pires, R. C. M.; Barbosa, E. A. A.; Arruda, F. B.; Sakai, E.; Silva, T. J. A. Effects of Subsurface Drip irrigation and different planting arrangements on the yields and technological quality of sugarcane. Journal of Irrigation and Drainage Engineering, v.140, p. A5014001-1 - A5014001-6, 2014.
Raij, B. van; Cantarella, H.; Quaggio, J. A.; Furlani, A. M. C. Recomendações de adubação e calagem para o Estado de São Paulo. (2.ed.). Campinas: IAC, 1996.285p. Boletim Técnico, 100
Ramesh, P. Effect of different levels of drought during the formative phase on growth parameters and its relationship with dry matter accumulation in sugarcane. Journal of Agronomy and Crop Science, v.185, p.83-89, 2000. http://dx.doi.org/10.1046/j.1439-037x.2000.00404.x
Ribeiro, R. V.; Machado, R; S.; Machado, E. C.; Machado, D.F.S.P.; Magalhães Filho, J. R.; Landell, M. G. A. Revealing drought resistance and productive patterns in sugarcane genotypes by evaluating both physiological responses and stalk yield, Experimental Agriculture, v.49, p.212-224, 2013. http://dx.doi. org/10.1017/S0014479712001263
Ripoli, T. C. C.; Ripoli, M. L. C.; Ide, B.Y. Plantio de cana-de-açúcar: Estado da arte, Piracicaba: T.C.C. Ripoli, 2006. 216p.
Silva, M. A.; Arantes, M. T.; Rhein, A. F. L.; Gava, G. J. C.; Kolln, O. T. Potencial produtivo da cana-de-açúcar sob irrigação por gotejamento em função de variedades e ciclos. Revista Brasileira de Engenharia Agrícola e Ambiental, v.18, p.241–249, 2014. http:// dx.doi.org/10.1590/S1415-43662014000300001
Singels, A.; Donaldson, R. A.; Smit, M. A. Improving biomass production and partitioning in sugarcane: theory and practice. Field Crops Research, v.92, p.291-303, 2005a. http://dx.doi. org/10.1016/j.fcr.2005.01.022
Singels, A.; Smit, M. A.; Redshaw, K. A.; Donaldson, R. A. The effect of crop start date, crop class and cultivar on sugarcane canopy development and radiation interception. Field Crops Research, v.92, 249-260, 2005b. http://dx.doi.org/10.1016/j. fcr.2005.01.028
UNICA - União da Indústria de Cana-de-açúcar. Etanol e bioeletricidade: A cana-de-açúcar no futuro da matriz energética. São Paulo: Luc, 2013. 315p.