Revista Brasileira de
Engenharia Agrícola e Ambiental
Campina Grande, PB, UAEA/UFCG – http://www.agriambi.com.br
v.21, n.11, p.798-802, 2017
Empirical models in the description
of prickly pear shoot (Nopal) drying kinetics
Emmanuel M. Pereira
1, Wilton P. da Silva
2, Josivanda P. Gomes
3,
Cleide M. D. P. da S. e Silva
2, Anderson dos S. Formiga
1& Franciscleudo B. da Costa
4 DOI: http://dx.doi.org/10.1590/1807-1929/agriambi.v21n11p798-802A B S T R A C T
The objective of this study was to describe the technological process involved in the drying kinetics of fresh-cut prickly pear shoots through numerical and analytical solutions. Shoots of two different prickly pear species were used, ‘Gigante’ and ‘Miúda’. Drying was performed at different temperatures (50, 60, 70 and 80 °C) and weighing procedures were made continuously. The experimental data were expressed as moisture ratio. The Page model showed the best fit to the drying kinetics of minimally processed ‘Gigante’ and ‘Miúda’ prickly pear shoots, with the best coefficients of determination and Chi-square. Peleg and Wang & Singh models can not be used to simulate the drying of ‘Gigante’ and ‘Miúda’ prickly pear shoots within the evaluated range of temperatures, showing an incoherent graphic pattern.
Modelos empíricos na descrição da cinética
de secagem do broto da palma (Nopal)
R E S U M O
Objetivou-se neste trabalho descrever o processo tecnológico envolvido na cinética de secagem dos brotos da palma minimamente processados através de soluções numéricas e analíticas. Foram utilizados brotos provenientes de duas espécies de palma ‘Gigante’ e ‘Miúda’. A secagem foi processada em diferentes temperaturas (50, 60, 70 e 80 °C). As pesagens foram efetuadas de forma contínua. Os dados experimentais foram expressos na forma de razão de umidade. O modelo de Page deteve o melhor ajuste para a cinética de secagem dos brotos da palma ‘Gigante’ e ‘Miúda’ minimamente processados, com os melhores coeficientes de determinação e qui-quadrado. Os modelos de Peleg e Wang & Singh não podem ser utilizados para simular o processo de secagem dos brotos da palma ‘Gigante’ e ‘Miúda’ dentro do intervalo de temperatura estudado, onde apresentam comportamento gráfico incoerente.
Key words:
mathematical modeling
Opuntia Nopalea
minimal processing
Palavras-chave:
modelagem matemática
Opuntia Nopalea
processamento mínimo
1 Universidade Estadual Paulista/Faculdade de Ciências Agrárias e Veterinárias. Jaboticabal, SP. E-mail: emmanuel16mop@hotmail.com;
andersondossantos1991@hotmail.com
2 Universidade Federal de Campina Grande/Centro de Ciências e Tecnologia/Unidade Acadêmica de Física. Campina Grande, PB. E-mail:
wiltonps@uol.com.br; cleidedps@gmail.com
3 Universidade Federal de Campina Grande/Centro de Tecnologia e Recursos Naturais/Unidade Acadêmica de Engenharia Agrícola. Campina
Grande, PB. E-mail: josivanda@gmail.com (Corresponding author)
4 Universidade Federal de Campina Grande/Centro de Ciências e Tecnologia Agroalimentar/Unidade Acadêmica de Tecnologia de Alimentos.
Pombal, PB. E-mail: franciscleudo@yahoo.com.br
Introduction
Prickly pear presents itself as an alternative in the Brazilian semi-arid region, with a wide potential of utilization in human and animal diets and in the manufacture of derivatives. There are two species of prickly pear with economic/agroindustrial potential, ‘Gigante’ (Opuntia ficus-indica (L.) Mill) and ‘Miúda’ (Nopalea cochenillifera (L.) Salm-Dyck).
‘Gigante’ is a large plant with good biomass yield, whereas ‘Miúda’ has small size, branched stem with smaller cladodes and high energetic potential (Oliveira et al., 2011). Both have high phytomass production, creating a potential use of this desert vegetable in agroindustrial production processes, such as the manufacture of flour.
To obtain flour, minimum processing is applied in the cladode, facilitating the movement of water from the tissue to the external environment. Minimum processing physically alters fruits and vegetables to obtain a fresh product (Moretti, 2007). The drying process removes water from the products, totally or partially, until they reach constant weight, allowing their storage for prolonged period, without causing significant losses of quality (Afonso Júnior et al., 2006).
Using mathematical models to describe the drying process aims at the optimization of the technological process of flour production. The models are based on variables external to the product, such as: drying air temperature and relative humidity (Corrêa et al., 2007). The models can be classified as: theoretical, empirical or semi-empirical (Lima et al., 2007; Silva et al., 2008, 2013a,b). Numerous mathematical models have been proposed to describe the behavior of food sorption isotherms (Oliveira et al., 2014).
This study aimed to apply empirical mathematical models to describe the drying kinetics of minimally processed prickly pear shoots at different temperatures.
Material and Methods
The study was carried out at the Laboratory of Food Biochemistry and Chemistry, at the Center of Sciences and Agrifood Technology - CCTA, Campus of Pombal, in Pombal, PB, belonging to the Federal University of Campina Grande, PB.
Two species from different genera were used: ‘Gigante’ (Opuntia ficus-indica (L.) Mill) and ‘Miúda’ (Nopalea cochenillifera (L.) Salm-Dyck), both with high productive potential. The shoots came from a 75-m2 experimental area
of the CCTA, where the cladodes were densely produced at spacing of 0.1 m between plants and 1.80 m between rows.
Shoots were harvested at approximately 7:00 a.m. and taken to the laboratory, under controlled conditions of temperature (20 °C). Subsequently, they were selected for appearance and size, eliminating those with injuries and length greater than 22 cm, to improve the standardization of the samples and remove coarse dirt adhered to their surface. After that, the shoots were cut and standardized with the same size, 97.8 x 43.3 mm (width x length) for ‘Miúda’ and 142.8 x 6 mm (width x length) for ‘Gigante’. Using a Robot Coupe®
industrial processor, the shoots were sliced to obtain a final rectangular shape with the following dimensions: 97.8 x 10 x 2 mm (width x length x thickness). The sanitation process
was performed in three steps. First, the shoots were subjected to sanitation in 200 mg L-1 free chlorine solution (Sumaveg®),
in water containing ice (± 1 °C), for 10 min. Rinse was done in water containing 200 mg L-1 free chlorine (Sumaveg®) and
ice, for 10 min. After that, the shoots were drained for 2 min in a centrifuge (Consul@, model C2A05BB, at 2800 rpm).
After minimum processing, the shoots were dried in a forced-air circulation/renewal oven (Solab® - Model SL 102/42), at four
different temperatures (50, 60, 70 and 80 °C). Subsequently, they were arranged on stainless-steel drip trays (15 cm long, 10 cm wide, 5 cm deep). Each tray received approximately 100 g of plant material, previously weighed on semi-analytical scale (Bell® - Model SSR-600, with 0.05-g accuracy), containing seven
replicates each, at all temperatures. Weighing procedures were performed continuously, counting from time 0 until reaching constant weight. Moisture content data in the prickly pear shoots were determined according to IAL (2008).
The experimental data were fit using the LAB fit curve fitting software (Silva & Silva, 2016). Mathematical models were fitted to the prickly pear shoot dehydration curves using the empirical equations described in Table 1.
The criteria for drying kinetics evaluation used in the selection of the models were the coefficient of determination (R2) and chi-square (χ2), calculated through Eq.1.
RX - Moisture ratio, dimensionless; T - Drying time, h; K, ko, k1 - Drying constants, h-1; a,
b, c, n – Coefficients of the model Source: Rodrigues (2015)
Model Name Empirical expression 1 Lewis (1921) RX = exp(-a tb)
σe- at (2)
2 Henderson & Pabis (1961) RX = a exp(-k t) (3) 3 Wang & Singh (1678) RX = 1 + a.t + b.t2 (4)
4 Peleg (1993) RX= 1 -t/(a + bt) (5) 5 Page (1949) RX = exp(-k tn) (6)
6 Silva et al. (2012) RX = exp(-at - bt1/2) (7)
Table 1. Empirical models used to describe moisture ratios in minimally processed prickly pear shoots
χ2 =
(
−)
2∑
Xexp Xpre* *
where:
χ2 - chi-square;
X*exp - experimental moisture ratio; and X*pre - moisture ratio predicted by the model.
Results and Discussion
Table 2 shows the parameters obtained from the fit of the models Henderson & Pabis, Lewis, Page, Peleg, Silva et al. (2012) and Wang & Singh to the drying of minimally processed ‘Gigante’ prickly pear shoots, at temperatures of 50, 60, 70 and 80 °C.
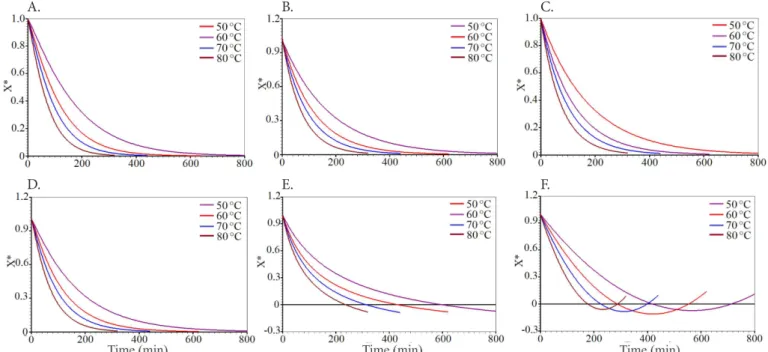
According to the parameters of the models fitted to the experimental data of moisture ratio kinetics during the drying of minimally processed ‘Gigante’ prickly pear shoots, the Page model showed good representation and highest coefficients of determination (R2), which ranged from 0.9957 to 0.9976,
and lowest chi-squares (χ2), from 0.1012 to 0.6092 (Table 2),
demonstrates the high affinity of the model to the experimental data. Thus, it can be used in the prediction of prickly pear shoot drying with high degree of confidence within the temperature range considered in the present study. Galdino et al. (2016), studying atemoya pulp drying kinetics, observed similar behavior to that of the present study, with superior values of R2, above 0.9, for the models Page, Midilli and Henderson &
Pabis, at temperatures of 60, 70 and 80 °C.
For the models Peleg (Figure 1E) and Wang & Singh (Figure 1F), the obtained statistical values are considered as satisfactory; however, based on the graphic representation of the fit to the data, they do not exhibit physical behavior consistent with the study and even crossed the area of negative moisture ratio before reaching the equilibrium point of the dehydration process. This means that the models can not be used to simulate the drying process of ‘Gigante’ prickly pear shoots within the studied temperature range.
Madureira et al. (2012), working with prickly pear at temperatures of 50, 60 and 70 °C, using the models Lewis, Page, Henderson & Pabis, Logarithmic and Midilli, observed that these models fitted well to the experimental data of drying. Melo et al. (2013), studying foam-mat drying of ‘mandacaru’ fruit pulp in forced-air circulation oven at temperatures of 70, 80 and 90 °C, with three different foam-mat thicknesses (0.5, 1.0 and 1.5 cm), using the models Page, Henderson & Pabis and Cavalcanti Mata to describe the drying curve, observed that all models showed coefficients of determination higher than 0.98. Leite et al. (2016), investigating the description of ‘carambola’ drying kinetics by mathematical models at temperatures of 60, 70 and 80 °C, obtained good fits with the models Henderson, Lewis and Page. The behaviors in these studies are coherent with those observed here, with good fits of the models and coefficients of determination higher than 0.98, which represents the efficiency of the model in relation to the experimental data.
Table 2. Parameters of the models fitted to the drying data of minimally processed ‘Gigante’ prickly pear shoots, at temperatures of 50, 60, 70 and 80 °C
Temperature (°C)
Parameters
R2
2
a b
Henderson & Pabis
50 0.1013 0.5715 0.9947 0.2301 60 0.1023 0.8536 0.9950 0.1840 70 0.1017 0.1060 0.9929 0.2179 80 0.1030 0.1393 0.9954 0.1339
Lewis
50 0.5611 - 0.9952 0.2399 60 0.8270 - 0.9956 0.2082 70 0.1036 - 0.9937 0.2302 80 0.1339 - 0.9965 0.1649
Page
50 0.2809 0.1134 0.9968 0.1300 60 0.4234 0.1140 0.9970 0.1012 70 0.5324 0.1146 0.9957 0.1242 80 0.7053 0.1149 0.9976 0.6092
Peleg
50 0.1596 0.7304 0.9900 0.3603 60 0.1043 0.7558 0.9868 0.4338 70 0.8717 0.7197 0.9872 0.3350 80 0.6873 0.7072 0.9913 0.2144
Silva et al. (2012)
50 0.6317 -0.8575 0.9953 0.1937 60 0.9576 -0.1307 0.9958 0.1472 70 0.1189 -0.1384 0.9938 0.1804 80 0.1594 -0.2021 0.9965 0.1474
Wang & Singh
50 -0.3793 0.3347 0.9903 0.5590 60 -0.5289 0.6281 0.9807 0.8847 70 -0.6943 0.1110 0.9903 0.4263 80 -0.9112 0.1954 0.9901 0.3357
Figure 1. Models of Page (A), Henderson & Pabis (B), Lewis (C), Silva et al. (2012) (D), Peleg (E) and Wang & Singh (F) fitted to the moisture ratio obtained in the drying of minimally processed ‘Gigante’ prickly pear shoots at temperatures of 50, 60, 70 and 80 °C
(Figure 1C) and Silva et al. (2012) (Figure 1D) showed good representation of the experimental points of the drying curve, with R2 above 0.98 and χ2 below 0.23 (Table 2). In the fit of
the Page model, the constants a and b exhibited a progressive increase as a function of the increment in temperature. This
A. B. C.
Table 3 shows the parameters of the models Henderson & Pabis, Lewis, Page, Peleg, Silva et al. (2012) and Wang & Singh fitted to the drying of minimally processed ‘Miúda’ prickly pear shoots, at temperatures of 50, 60, 70 and 80 °C.
Considering the statistical values generated from the models fitted to the experimental data of moisture ratio kinetics during the drying of minimally processed ‘Miúda’ prickly pear shoots, there was a similar behavior in relation those of ‘Gigante’ prickly pear shoots, with good representation by the Page model, which showed highest R2 (0.9919 to 0.9969)
and lowest χ2 (0.1118 to 0.1814) (Table 3), and good fit to
the experimental data (Figure 2A). Considering this same criterion, the models Silva et al. (2012) (Figure 2B), Lewis (Figure 2C) and Henderson & Pabis (Figure 2D) showed good fit to the moisture ratio experimental points, with R2 above 0.98
and χ2 below 0.2 (Table 3).
For the models Peleg (Figure 2E) and Wang & Singh (Figure 2F), the statistical indicators used in the selection of the best model to represent the phenomenon were considered as good; however, based on the graphic representation of the fit to the data, they do not exhibit a physical behavior coherent with the study and even crossed the area of negative moisture ratio before reaching the equilibrium point of the dehydration process, indicating that these models can not be used to simulate the drying process of ‘Miúda’ prickly pear shoots within the studied range of temperatures. Such behavior is different from that found by Coradi et al. (2016) for the Wang & Singh model, which was more adequate to describe the drying of soybean grains. However, one must consider the product to be dried, as well as its geometry, which influences not only the model, but also the drying speed.
Regarding the parameters of the models fitted to the experimental data of ‘Gigante’ and ‘Miúda’ prickly pear shoots, there was influence of temperature; drying time decreased as temperature increased (Figures 1 and 2).
In agreement with the present study, Sánchez-Sáenz et al. (2015) evaluating orange bagasse drying using Page and
Figure 2. Models of Page (A), Henderson & Pabis (B), Lewis (C), Silva et al. (2012) (D), Peleg (E) and Wang & Singh (F) fitted to the moisture ratio obtained from the drying curve of minimally processed ‘Miúda’ prickly pear shoots at temperatures of 50, 60, 70 and 80 °C
Table 3. Parameters of the models fitted to the drying data of minimally processed ‘Miúda’ prickly pear shoots, at temperatures of 50, 60, 70 and 80 °C
Temperature (°C)
Parameters
R2
2
a b
Henderson & Pabis
50 0.1006 0.6119 0.9952 0.2041 60 0.1016 0.9549 0.9949 0.1787 70 0.1021 0.1073 0.9942 0.1805 80 0.1012 0.1683 0.9917 0.1926
Lewis
50 0.6061 - 0.9955 0.2067 60 0.9341 - 0.9953 0.1898 70 0.1042 - 0.9950 0.1993 80 0.1655 - 0.9920 0.1973
Page
50 0.3372 0.1116 0.9969 0.1263 60 0.5310 0.1121 0.9966 0.1118 70 0.5361 0.1146 0.9968 0.1280 80 0.1312 0.1056 0.9919 0.1814
Peleg
50 0.1435 0.7518 0.9890 0.3863 60 0.8895 0.7814 0.9846 0.4900 70 0.8628 0.7235 0.9881 0.3177 80 0.5058 0.7736 0.9865 0.3090
Silva et al. (2012)
50 0.6659 -0.7004 0.9956 0.1791 60 0.1051 -0.1114 0.9955 0.1525 70 0.1209 -0.1505 0.9951 0.1417 80 0.1787 -0.9455 0.9918 0.1865
Wang & Singh
50 -0.3953 0.3578 0.9858 0.8534 60 -0.5289 0.6281 0.9807 0.8847 70 -0.6957 0.1114 0.9888 0.4604 80 -0.1008 0.2308 0.9649 0.1237
Fick models, also found that the Page model showed better representation of the experimental data, compared with the Fick model. Lahsasni et al. (2004), evaluating the drying kinetics of prickly pear fruits through the models Newton, Page, Modified Page, Henderson & Pabis, Logarithmic,
A. B. C.
Two Terms, Exponential two terms and Wang & Singh, at temperatures of 50, 55 and 60 °C, observed better fit for the Two Terms model, with coefficient of determination of 0.9999; however, the Page model showed coefficient of determination of 0.9991, close to that found in the present study.
Silva et al. (2015), studying banana drying continuously through the Page, Peleg and Silva et al. (2012) models, observed that Peleg obtained the best fits to the experimental data, with coefficients of variation above 0.9984. Lima et al. (2007), studying ‘facheiro’ (Cereus squamosus) pulp drying at temperatures of 50, 60 and 70 °C, using the Page, Henderson & Pabis and Midilli models, observed that these three models satisfactorily represented the experimental data, with coefficients of determination higher than 0.96.
Conclusions
1. The studied models showed good statistical indices for the fit to the experimental data.
2. The Page model showed the best R2 and χ2 for the drying
kinetics of minimally processed prickly pear shoots.
3. Peleg and Wang & Singh models showed singular graphic behavior and even crossed the area of negative moisture ratio before reaching the equilibrium point of the dehydration process, which indicates that these models can not be used to simulate the dehydration of ‘Gigante’ and ‘Miúda’ prickly pear shoots within the studied range of temperatures.
Literature Cited
Afonso Júnior, P. J. C.; Oliveira Filho, D.; Costa, D. R. Viabilidade econômica de produção de lenha de eucalipto para secagem de produtos agrícolas. Engenharia Agrícola, v.26, p.28-35, 2006. https://doi.org/10.1590/S0100-69162006000100004
Coradi, P. C.; Fernandes, C. H. P.; Helmich, J. C. Adjustment of mathematical models and quality of soybean grains in the drying with high temperatures. Revista Brasileira de Engenharia Agrícola e Ambiental, v.20, p.385-392, 2016. https://doi.org/10.1590/1807-1929/agriambi.v20n4p385-392
Corrêa, P. C.; Resende, O.; Martinazzo, A. P.; Goneli, A. L. D.; Botelho, F. M. Modelagem matemática para a descrição do processo de secagem do feijão (Phaseolus vulgaris L.) em camadas delgadas. Engenharia Agrícola, v.27, p.501-510, 2007. https://doi. org/10.1590/S0100-69162007000300020
Galdino, P. O.; Figueirêdo, R. M. F. de; Queiroz, A. J. de M.; Galdino, P. O. Drying kinetics of atemoya pulp. Revista Brasileira de Engenharia Agrícola e Ambiental, v.20, p.672-677, 2016. https:// doi.org/10.1590/1807-1929/agriambi.v20n7p672-677
IAL - Instituto Adolfo Lutz. Normas analíticas do Instituto Adolfo Lutz: Métodos químicos e físicos para análise de alimentos. 4.ed. São Paulo: IAL, 2008. 1020p.
Lahsasni, S.; Kouhila, M.; Mahrouz, M.; Jaouhari, J. T. Secagem cinética do figo da Índia (Opuntia fícus-indica). Journal of Food Engineering, v.61, p.173-179, 2004. https://doi.org/10.1016/S0260-8774(03)00084-0
Leite, D. D. de F.; Pereira, E. M.; Albuquerque, A. P. de; Mendes, F. de A.; Alexandre, H. V. Avaliação da cinética de secagem da carambola em secador convectivo. Revista Verde de Agroecologia e Desenvolvimento Sustentável, v.11, p.1-4. 2016. https://doi. org/10.18378/rvads.v11i2.4026
Lima, E. E. de; Figueirêdo, R. M. F. de; Melo Queiroz, A. J. de. Cinética de secagem de polpa de facheiro. Revista Brasileira de Produtos Agroindustriais, v.9, p.17-28, 2007. https://doi.org/10.15871/1517-8595/rbpa.v9n1p17-28
Madureira, I. F.; Figueirêdo, R. M. F. de; Queiroz, A. J. de M.; Silva Filho, E. D. da. Cinética de secagem da polpa do figo-da-india. Revista Brasileira de Produtos Agroindustriais, v.14, p.345-354. 2012. https://doi.org/10.15871/1517-8595/rbpa.v14nEspecialp525-534 Melo, K. dos S.; Figueirêdo, R. M. F. de; Queiroz, A. J. de M.; Fernandes,
T. K. da S.; Bezerra, M. da C. T. Secagem em camada de espuma da polpa do fruto do mandacaru: Experimentação e ajustes de modelos matemáticos. Revista Caatinga, v.26, p.9-17, 2013. Moretti C. L. Laboratório de Pós-colheita, Embrapa Hortaliças. 2007.
Disponível em: <http://www.sisbin.ufop.br/novoportal/wp- content/uploads/2015/03/Manual-de-Processamento-Minimo-de-Frutas-e-Hortalicas.pdf>. Acesso em: 30 Jun. 2016.
Oliveira, A. S. C.; Cavalcante Filho, F. N.; Rangel, A. H. do N.; Lopes, K. B. de P. A palma forrageira: Alternativa para o semi-árido. Revista Verde de Agroecologia e Desenvolvimento Sustentável, v.6, p.49-58, 2011.
Oliveira, G. S.; Costa, J. M. C. da; Afonso, M. R. A. Caracterização e comportamento higroscópico do pó da polpa de cajá liofilizada. Revista Brasileira de Engenharia Agrícola e Ambiental, v.18, p.1059-1064, 2014. http://dx.doi.org/10.1590/1807-1929/agriambi. v18n10p1059-1064
Rodrigues, A. F. Modelagem matemática do estudo experimental das secagens contínua e intermitente de bananas. Campina Grande: UFCG, 2015.23p. Tese Doutorado
Sánchez-Sáenz, C. M.; Nascimento, V. R. G.; Biagi, J. D.; Oliveira, R. A. de. Mathematical modeling of the drying of orange bagasse associating the convective method and infrared radiation. Revista Brasileira de Engenharia Agrícola e Ambiental, v.19, p.1178-1184. 2015. https://doi.org/10.1590/1807-1929/agriambi. v19n12p1178-1184
Silva, W. P. da; Mata, M. E. R. M. C.; Silva, C. D. P. S. e; Guedes, M. A.; Lima, A. G. B. de. Determination of diffusivity and activation energy for cowpea grains (Vigna unguiculata (L.) Walp.), always-green variety, based on its drying behaviour. Engenharia Agrícola, v.28, p.325-333, 2008. https://doi.org/10.1590/S0100-69162008000200013
Silva, W. P. da; Rodrigues, A. F.; Silva, C. M. D. P. da S. e; Castro, D. de S.; Gomes, J. P. Comparação entre secagem contínua e intermitente de bananas inteiras utilizando modelos empíricos e de difusão para descrever os processos. Journal of Food Engineering, v.166, p.230-236, 2015.
Silva, W. P. da; Silva, C. M. D. P. da S. e. LAB Fit curve fitting software (nonlinear regression and treatment of data program) versão 7.2.48 (1999-2015). Disponível em: <http://www.labfit.net>. Acesso em: 28 Jan. 2016.
Silva, W. P. da; Silva, C. M. D. P. da S. e; Gomes, J. P. Drying description of cylindrical pieces of bananas in different temperatures using diffusion models. Journal of Food Engineering, v.117, p.417-424, 2013a. https://doi.org/10.1016/j.jfoodeng.2013.03.030