O R I G I N A L A R T I C L E
Analysis of spatial–temporal patterns of water table change
as a tool for conjunctive water management in the Upper Central
Plain of the Chao Phraya River Basin, Thailand
Vitor Vieira Vasconcelos•Sucharit Koontanakulvong •
Chokchai Suthidhummajit• Paulo Pereira Martins Junior•
Renato Moreira Hadad
Received: 24 April 2014 / Accepted: 16 October 2014 / Published online: 4 November 2014 ÓThe Author(s) 2014. This article is published with open access at Springerlink.com
Abstract A sustainable strategy for conjunctive water
management must include information on the temporal and spatial availability of this natural resource. Because of water shortages in the dry seasons, farmers on the Upper Plain of the Chao Phraya River basin, Thailand, are increasingly using groundwater to meet their irrigation needs. To evaluate the possibilities of conjunctive water management in the area, the spatial–temporal changes in the water table of the Younger Terrace Aquifer were investigated. First, a regional geomorphological map based on field surveys, remote sensing and previous environ-mental studies was developed. Then, the well data were analyzed in relation to rainfall, streamflow, yield and pumpage, and the data were interpolated using geostatis-tical techniques. The results were analyzed via integrated
zoning based on color theory as applied to multivariate visualization. The analysis results indicate areas that would be more suitable for groundwater extraction in a conjunc-tive management framework with regard to the natural hydrogeological processes and the effects of human inter-action. The kriging results were compared with the geo-morphological map, and the geogeo-morphological areas exhibit distinct hydrogeological patterns. The western fans exhibit the best potential for the expansion of conjunctive use, whereas the borders of the northern fans exhibit the lowest potential.
Keywords KrigingConjunctive Management of Water
ResourcesMultivariate visualizationChao Phraya River Thailand
Introduction
The lowering of water tables is a serious problem faced by many countries around the world, including India, China, USA and many countries in central Asia (Brown 2005, p. 101–102). The fluctuation of the water table changes the pattern of aquifer recharge and discharge into the rivers. This effect was observed by Promma et al. (2007) in the upper central plain of Thailand, which was studied in this paper. This over extraction of groundwater could reduce the base flow discharge of the aquifer into the river and increase the recharge from the river into the aquifer. If lower flow in the rivers occurs during the dry season, there would be a further increase in the conflicting demands for surface water downstream.
Therefore, attention to the growing demand for groundwater through careful monitoring and management may help to avoid future water conflicts. The zoning of
Electronic supplementary material The online version of this article (doi:10.1007/s13201-014-0240-4) contains supplementary material, which is available to authorized users.
V. V. Vasconcelos (&)
Asia Centre, Stockholm Environment Institute, 15th Floor, Witthyakit Building, 254 Chulalongkorn University,
Chulalongkorn Soi 64, Phayathai Road, Pathumwan, Bangkok, Bangkok 10330, Thailand
e-mail: [email protected]
S. KoontanakulvongC. Suthidhummajit
Faculty of Engineering, Chulalongkorn University, Phayathai Road, n. 254, Pathumwan, Bangkok 10330, Thailand
P. P. M. Junior
Mining School, Federal University of Ouro Preto, Campus Morro do Cruzeiro, Ouro Preto, Minas Gerais CEP: 35.400-000, Brazil
R. M. Hadad
areas with better or worse potential for groundwater use based on the vulnerability or resilience of the water table may be a useful tool in these contexts. Jain et al. (2009) proposed a zoning of spatial–temporal changes of the water table depth in Andhra Pradesh (India) to understand the risk of groundwater stress. Chen et al. (2010) also used spatial–temporal changes in the water table to develop a groundwater suitability zone for the expansion of irrigated agriculture. In urban areas, monitoring the spatial–temporal patterns of the water table is an important tool that has been used to avoid risks of land subsidence and saltwater intrusion (Houzer and Johnson 1985; Foster et al. 2010). Sophocleous (2000, 2012) showed how mapping water table patterns was used in the initial development of inte-grated water management policies in critical zones in Kansas as well as how the subsequent modeling of the groundwater–surface water interactions enabled the pro-tection of a minimum ecological flow in the streams.
Fluctuations of the water table are one of the most widespread metrics for estimating aquifer recharge (Healy and Cook2002). In this context, the elevation of the water table during the rainy (or flood) season may be used to estimate the recharge surplus in the water budget of the aquifer. In the context of cyclic conjunctive use of groundwater and surface water, areas with more recharge would replenish the aquifer more efficiently during the rainy (or flood) period following the extraction stress during the dry period (Bredehoeft and Kendy2008).
Kriging and co-kriging are used as standard tools to interpolate groundwater table levels based on observation wells (Ahmadi and Seghamiz 2008; Nikroo et al. 2010; Moslemzadeh et al. 2011). However, confidence in the interpolation of the water table depends on whether the statistical assumptions of stationarity and normality are achieved by the samples (Peterson et al.2011) and should be evaluated both by the results of cross validation and by the coherency of the trends in the interpolation map, par-ticularly in areas farther from the observation points (Desbarats et al.2002, p. 35).
The expansion of irrigated agriculture in the Chao Phraya River basin, Thailand, has led to water shortages in years with insufficient surface water during the dry season (Molle2007). To mitigate the risk of shortages, farmers in such areas are increasingly using groundwater resources as complementary water sources. However, for sustainable conjunctive management of these water resources, it is important to understand the spatial–temporal behavior of the aquifers and their relationships to other environmental processes.
The objective of this study was to investigate the tem-poral and spatial relationships between groundwater data (water table depth and yield) and other environmental data in the Younger Terrace Aquifer and to evaluate their
implications for conjunctive water management. The multivariate temporal–spatial zoning developed in this paper can be applied as a complementary approach for conventional modeling and planning tools for conjunctive water management. The intermediate objectives were as follows:
1. generate a geomorphological map of the aquifer area; 2. analyze the temporal–spatial relationships between
changes in the water table, rainfall and streamflow; 3. interpolate the results of the temporal–spatial analysis
with kriging techniques and the yield and pumping data from wells;
4. integrate the interpolated maps into multivariate zoning;
5. compare the results of the multivariate zoning with the geomorphological map; and
6. discuss the implications of the results for conjunctive water resources management.
Study area
The Chao Phraya basin consists of a mountainous upland and intermountain plain. The mountains present fractured bedrock aquifers, which consist of fractured metamorphic and igneous rocks, as well as local karstic aquifers (Koo-ntanakulvong2006). The downstream plain is formed by a sequence of eight Quaternary unconsolidated sedimentary aquifer strata that are separated by clayey lacustrine aqui-tards (Takaya1971; Arlai2007).
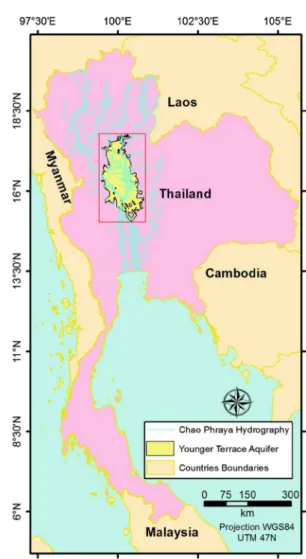
The Younger Terrace Aquifer lies beneath the upper central plain of the Chao Phraya River basin in Thailand (Figs.1and2), and it is a porous aquifer that is primarily composed of unconsolidated Quaternary sediments, such as quartz sand and gravel (Promma et al.2007) that originated from alluvial fans (Koontanakulvong 2006; Uppasit et al. 2012). The aquifer also contains lenses of clay sediments deposited on pre-existing floodplains. The aquifer has an average thickness of 84 m (Fig.3), average hydraulic conductivity of 62 m/day (Fig.4), average specific storage
of 0.01 (Koontanakulvong 2006) and areal extent of 2,097,794 ha. The aquifer is generally covered by a clay soil layer as well as by a clay-alluvial layer near the main streams (Koontanakulvong 2006; Promma et al. 2007).
The area has a tropical monsoon climate with unimodal rainfall oscillation that creates a wet season from May to October and dry season from November to April. The rainfall in the wet season is controlled primarily by con-stant frontal rain from the southwestern monsoon and intertropical convergence zone (ITCZ). The river flow and flooding patterns are heavily affected by orographic storms that occur upstream of the plain when the seasonal tropical cyclonic systems coming from the northern Pacific Ocean or South Chinese Sea hit the mountains bordering the northern and northwestern margins of the Chao Phraya basin (Hungspreug et al. 2000; Komori et al. 2012). Accurate descriptions of the climatological processes in this region can be found in the work by Rungdilokroajn (1992) and the Meteorological Department of Thailand (2013).
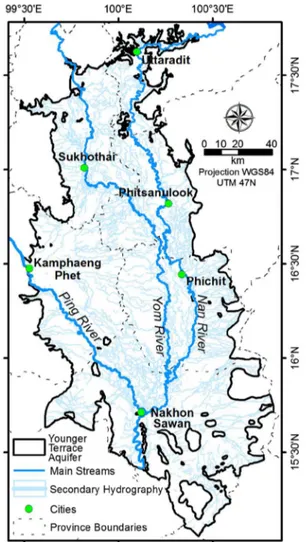
Fig. 2 Boundaries and hydrography of the younger terrace aquifer and locations of the main cities in the study area
In 1974, the floodplains of the rivers Yom, Nan and Ping were already mostly occupied by rice paddy fields (CIA— Central Intelligence Agency, USA 1974). After the con-struction of the Bhumibol Dam in 1964 and Sirikit Dam in 1972, the river flow regulation enabled a rapid spread of irrigated agriculture on the plain that allowed for two or three rice crops per year (Royal Irrigation Department 1979, p. 54). From the 1970s to 1990s, many government irrigation projects were undertaken in the area. In 2009, agriculture (primarily rice cultivation) occupied 90 % of the aquifer surface, whereas urban land occupied 8 % and natural landscape only occupied 2 % (Land Development Department2009a).
The development of irrigation and increasing demand for industrial and urban water supplies have led to conflicts over surface water use in the Chao Phraya River basin. This conflict is particularly evident in years with less rainfall when the main dams in the basin are not able to store enough water to supply the demand during the dry season (Molle 2002). Over the last 10 years, the increasing
subsidies for rice farming in Thailand have increased the demand for water to irrigate second and third crops and further increased the risk of conflict (Bejranonda et al. 2013). To avoid the risk of water shortages, the use of groundwater as a complementary source has become more common among the farmers of the area (Suthidhummajit and Kootanakulvong2011).
Koontanakulvong et al. (2013) and Bejranonda et al. (2007,2013) proposed that conjunctive water management in the upper central plain could decrease the conflicts over water use in the Chao Phraya River basin and may even allow for a further increase in irrigated farmland. The proposed framework is one in which farmers could use the abundant surface water during the wet season and then switch to groundwater during the dry season. Because groundwater extraction takes a longer time to affect river flows (i.e., the drawdown cone in the water table takes a relatively long time to spread before it reaches the river bed and changes the interaction between river and aquifer) (Balleau and Mayer1988), the wet season would provide enough water so that the flows of the rivers would not be severely reduced by the groundwater use. Subsequently, the abundant infiltration during the wet season would replenish the aquifers again before the next cycle of water pumping.
Methods
Data sources
This study used the groundwater and surface water data from the upper central plain of Thailand compiled by Koontanakulvong (2006). The data were acquired from the Groundwater Department of Thailand, the Department of Industry Works, the Royal Irrigation Department and the water authorities at the provincial, municipal and village levels. The dataset is composed of 2,227 observation wells (depth of water table and yield) in the Younger Terrace Aquifer. From this dataset, 617 wells include information on the date of measurement (the measurements were made between 1968 and 2004, with 92 % between 1980 and 1999). The dataset also includes monthly observations of the water level in 6 monitoring wells. In addition, the same project (Koontanakulvong 2006) also catalogued the pumping rates in 3,834 private and public wells that extract water from this aquifer.
Streamflow data from the rivers in the basin were obtained from gauging stations of the Department of Water Resources. The average monthly rainfall data were obtained from the Department of Meteorology, the Royal Irrigation Department and the Department of Water Resources. The hydrographic GIS database was compiled
by Koontanakulvong (2006) based on the datasets of the Department of Water Resources and the Royal Irrigation Department. The aquifer’s boundaries were delineated by the Department of Groundwater Resources.
Geomorphological map
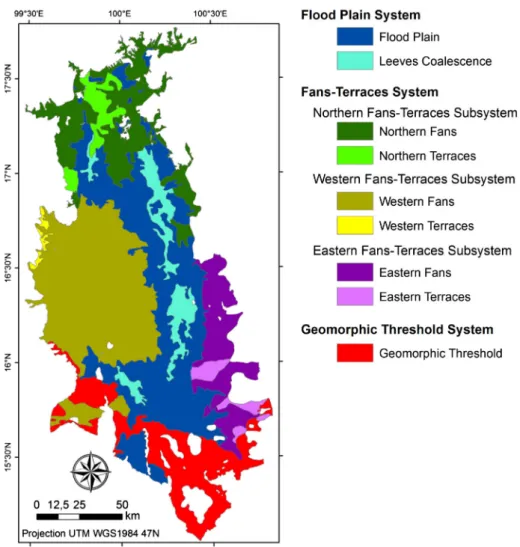
The geomorphological map of the area followed the geo-morphological framework proposed by Takaya (1971), Murata and Matsumoto (1974), Haruyama (1993). The floodplain (back swamps and levees) system is surrounded by systems of fans and terraces and is bottlenecked by a geomorphic threshold on its southern boundary. The map was developed based on field surveys performed in January 2014 and the following auxiliary cartographic database: – The maps of the temporal evolution of the inter- and
intra-annual floods in the Chao Phraya River basin (Prajamwong and Suppataratarn2009; UNITAR 2011; Yumuang 2012; GISTDA2013), interpreted based on the flood patterns of the geomorphic features in this region, as proposed by Haruyama et al. (1996). – The soil map by the Land Development Department
(2009b).
– A mosaic of SPOT optical satellite imagery for the years 2011 and 2012.
– The hydrography (Koontanakulvong2006).
– The geomorphic indices of slope and terrain ruggedness based on the SRTM (Shuttle Radar Topography Mission) elevation data (Jarvis et al.2008).
– The hydrogeomorphic index of vertical distance to base river level, calculated from the SRTM elevation and hydrography.
The slope, ruggedness index and height to the river base level were calculated using the software Saga 2.1 and the SRTM elevation data. The ruggedness index was calcu-lated based on the difference between the elevation of a cell and that of its 8 surrounding cells (Riley et al.1999). The vertical distance to the river base level was calculated by interpolating the elevation at each vertex of the hydrographic polyline to create a base level-smoothed surface of the terrain and subsequently subtracting the value of this smoothed surface from the original elevation model (Bock and Ko¨the2008).
Rainfall and streamflow
Monthly rainfall time series were collected from 23 rainfall stations; the data from each station had less than 15 % missing values. To fill in the missing rainfall data, the expectation maximization (EM) technique (Hartley 1958; Dempster et al.1977), available in the SPSS software, was used, as proposed by Firat et al. (2010). Another four
adjacent stations, with less than 10 % missing values, were added to aid in the estimation. Prior to the calculation, the dataset was divided into data from the wet and dry seasons to take into account the different climatic systems that dominate each period, as suggested by Presti et al. (2010) for regions with a unimodal climate oscillation.
Using the complete time series, Voronoy (Thiessen) polygons with centers at each rainfall station were delin-eated on the Younger Terrace Aquifer. The annual and monthly rainfall at each station was weighted proportion-ally to the area of the respective polygon overlying the aquifer surface. For those stations less than 15 km from each other, the polygons were clustered, and the areas of the clusters were evenly distributed among the inner stations.
Interpolation Kriging techniques
To interpolate the water table and yield data points, kriging and co-kriging techniques were employed, making use of the Geostatistical Analyst tool in the ArcGIS 10.1 software. The parameters used in the interpolations were optimized by cross validation. Simple kriging was used to interpolate the yield data using the dataset containing all of the wells. The water table depth was chosen as the interpolated data instead of the height (elevation) of the groundwater table to assure the assumption of data stationarity when using the kriging technique (Desbarats et al.2002). The use of the water depth isolates the external drift caused by the natural conformity between the height of the groundwater table and the surface elevation.
To create a general head map, the SRTM elevation was subtracted by the simple kriging interpolation of the depths in the dataset that includes all of the wells. Smoothed head contour lines were generated after applying a focal filter (using a ray parameter of 2.7 km) to the water table head raster.
Data subsets and respective thresholds
of the water resources. However, as there is no specific referential factor in the approach differentiating only between the dry and wet seasons, the changes in the water
table will reflect the overall result of many inputs and outputs in the water balance (including interactions between rivers, adjacent aquifers, water use, plant tran-spiration and other factors). In this last approach, the pri-mary focus of the analysis was on the effects of the changes in the water table with regard to the proposed conjunctive water use (i.e., areas with more drawdown during the dry season are less suitable for the expansion of cyclic groundwater use) instead of focusing on the causes of the changes in the water table.
To develop an average streamflow value, the average was weighted proportionally to the basin area of each river overlying the Younger Terrace Aquifer (Nan: 48 %; Yom: 43 %; and Ping: 9 %)
The thresholds for rainfall, streamflow and date periods were chosen to divide the dataset into two nearly equal samples in relation to the number of observations. Data normalization
As the observation data from the wells are not randomly or regularly spaced, there are areas with higher sampling densities. For this reason, it was important to use a normal score transformation of the samples and a declustering technique, which are available as part of the simple kriging approach in the Geostatistical Analyst tool, to ensure that the histogram sample better reflects the population histo-gram (ESRI 2005, p. 211). The goal of the normal score transformation was to ensure that all random errors in the whole population (not only the sample) are normally dis-tributed, thereby decreasing the uncertainty in the esti-mated interpolation. The normal score transformation allowed for the use of the declustering technique, which reduces the weight of the data in densely sampled areas in the interpolation and increases the weight of the data in sparsely sampled areas (ESRI 2005, p. 201–202). Although kriging produces the interpolation with the best unbiased predictor (Cressie1990), the transformation of the data that provides a normal distribution theoretically ensures that the interpolation follows the best predictor among all unbiased predictions, not only the weighted averages (ESRI 2005, p. 201). After distributing the interpolation weights, the variable values were transformed back to their original values.
Co-kriging procedure
The results of the kriging of water table data from the wells that have measurement dates were compared to the co-kriging interpolation using the water table observations that lacked measurement dates as a secondary auxiliary dataset. As the interpolation proceeded farther from the primary observation points, the co-kriging gradually used the
cross-Table 1 Subsets of well data used to investigate spatial–temporal change in the water table
Subset approach Description Testing hypotheses
Wet and dry seasons The wet season subset is composed of observations from May to October, whereas the dry season subset is composed of observations from November to April
The absence of rainfall recharge and pattern of groundwater flow during the dry season may cause a drop in the water table
Dry and wet rainfall years
The wet and dry years were classified using a rainfall threshold of 1125.5 mm/year
The wettest years favor greater recharge of the aquifer and raise the water table
Years in which the rivers exhibited high or low streamflow during the wet season
The average flow of the Nan, Yom and Ping rivers at the entrance to the aquifer area was used, with a flow rate threshold of 400 million m3/ month. Each classified year includes the data from observation wells during the wet season and the subsequent dry season
Flooding in the years with more rainfall will increase the recharge of the aquifer and raise the water table
Years in which the rivers exhibited high or low streamflow during the dry season
The average flow of the Nan, Yom and Ping rivers at the entrance to the aquifer area was used, with a flow rate threshold of 275 million m3/ month. Each classified year includes the data from observation wells during the dry season and the subsequent wet season
The absence of surface water will lead water users to pump more water from the wells, causing more stress on the aquifer
Observations before and after 1992/1993
The data were grouped into two subsets according to the measurement date
covariation between the primary and the secondary datasets to improve the predictions (Desbarats et al.2002). Because the subsets contained observations from various locations, the key role of the auxiliary data in the method used in this study was to provide a fixed reference in the areas with fewer observations and thus guarantee a minimum coher-ence between the compared interpolation maps of the complementary subsets.
The interpolated means, medians and interquartile ran-ges of the mapped chanran-ges in the water table are illustrated with a box plot.
Radial basis interpolation of pumping rate
The rates of pumping from the wells were grouped in squared grids of 10,000 ha each. These values were divided by the areas of the grids, and each specific pumping value (m3/day/ha) was attributed to the centroid of each grid. Subsequently, the values at the centroids were interpolated using the radial basis function in the Geostatistical Analyst tool. The radial basis function is a deterministic interpo-lation that fits selected spatial functions to better describe the observation data (Bishop 1995). The parameters of these functions were optimized by minimizing the root-mean-square prediction errors using cross validation. Integrated zoning
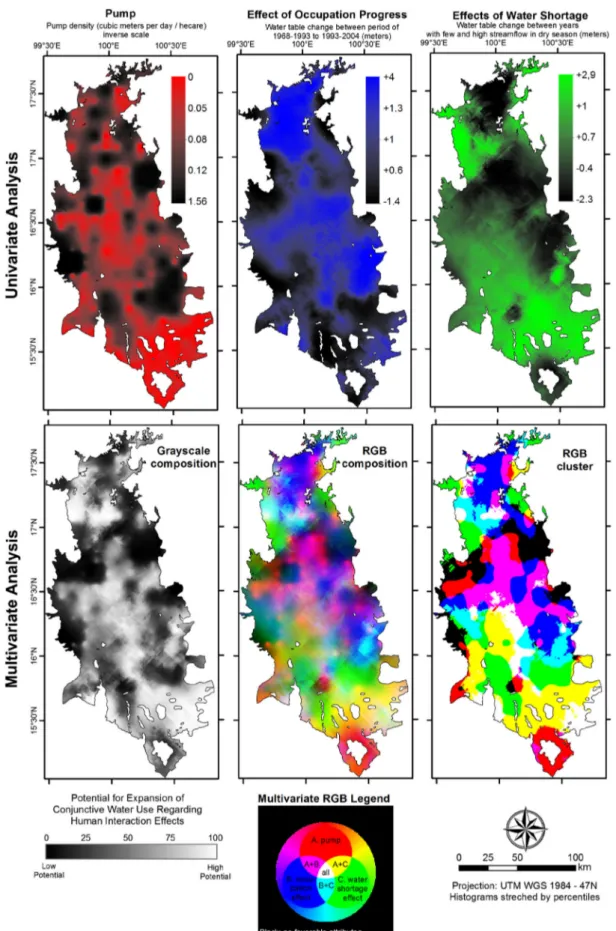
Multivariate maps
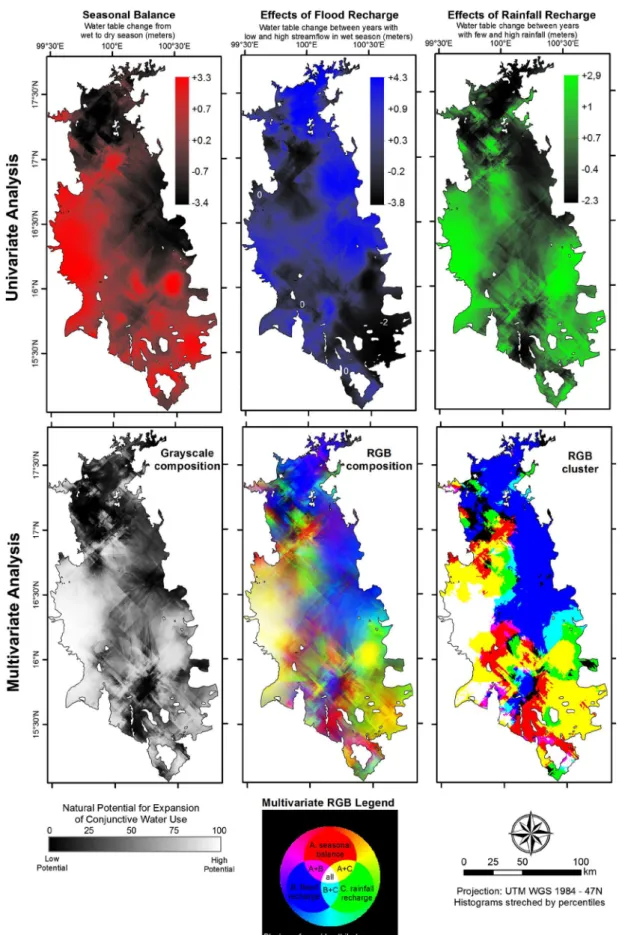
The objective of the zoning is to illustrate areas that have a greater or lesser potential to expand the conjunctive use of groundwater and surface water. The proposed multivariate visualization technique consists of a set of six maps: three univariate maps and three multivariate maps. This paper presents three map sets: (1) natural potential, (2) human interaction potential and (3) integrated zoning (composed of the integrated results of two first sets and the well yields).
For the multivariate zoning, it was necessary to assume a simplification, attributing equal weight to the variables (Table2) of natural potential, human interaction potential and well yields. The division between the natural and human interaction potentials is primary and is assumed to have the greatest influence on the respective univariate maps. However, it should be remembered that this division is merely a simplifying assumption and there are complex interactions between the natural and human factors. Histogram ranking and visualization techniques
The histogram of the univariate layers was stretched into rank percentiles in relation to the raster pixels (equivalent
to the Histogram Equalize remote sensing technique of Muray (1996, p. 190–191)). This procedure was performed to focus on the areal differentiation and make the variables comparable among one another. Based on the percentile rank, the legend of each univariate layer shows the quantile distribution of the box plot. The multivariate map sets (each with 3 multivariate maps) were developed for the intermediate zoning (natural potential and human interac-tion potential) and for the final integrated zoning. The first map in the set is based on the average of the three uni-variate layers, applying a new stretch based on the per-centile rank and visualizing in grayscale. The second map is an RGB (red, green, blue) composition of the three univariate layers, relying on the theory of color mixing. Although the RGB approach is generally used in remote sensing visualizations, its use in other quantitative contexts still has few documented applications (Hargrove and Hoffman2004; Craig et al.2006).
The third map is a thematic cluster map, which was developed by combining the upper 50 % quantiles of each of the three univariate layers while preserving the basic color patterns of the RGB map. This map follows the suggestion of Hargrove and Hoffman (2004) that the clustering of the three color mixing maps into map classes can improve the multivariate interpretation.
The three maps (grayscale, RGB composite and RGB cluster) constitute a progressive transition from quantita-tive to qualitaquantita-tive variable zoning. Because the human brain perceives gray scales (luminance-based) and mixed color scales (luminance- vs. hue-based) differently in terms of patterns of contrast, graduations, clustering, shapes, texture and stereo depth (Ware 1988; Merwing and
Table 2 Variables used for the integrated zoning to assess the potential for the expansion of conjunctive water use
Zoning Layers Weight
Natural potential Difference in water table level between wet and dry seasons (seasonal balance)
1/3
Difference in water table level between years with high and low streamflow during the wet season (effects of flood recharge)
1/3
Difference in water table level between years with high and few rainfall (effects of rainfall recharge)
1/3
Human interaction potential
Pumping 1/3
Difference in water table level between years with high and low streamflow during the dry season (effects of water shortage)
1/3
Difference in water table level between the periods before and after 1992/1993 (effects of occupation increase)
1/3
Wickens 1993; Rogowitz and Treinish 1996), the com-plementary maps using both color scales improve the user’s ability to visually analyze the map dataset. The univariate and gray scale multivariate zoning are also useful for users with color blindness because these users may face difficulties in evaluating the hue differences in the RGB maps (Borland and Taylor2007).
Qualitative zoning
A final zoning was determined based on the qualitative interpretation of the patterns identified in the maps presented in this study. To discuss the physical meaning of their spatial heterogeneity, the quantitative values were also analyzed with regard to their distribution among the primary geo-systems identified in the geomorphological map.
Results
A geomorphological map is presented in Fig.5, and a detailed description of the geomorphological system is
presented in the supplementary document that follows this paper. The supplementary document also presents the analysis of rainfall and streamflow.
The map of Fig.6 shows the head levels based on the kriging interpolation that applied all of the well data. Table3 presents the standard error, root-mean-squared error and deviation from the standard root-mean-squared error from the kriging and co-kriging interpolation of the
Fig. 5 Geomorphological map of the younger terrace aquifer
Table 3 Comparison of cross-validation results from kriging and co-kriging interpolations of water table data from the wells
Standard error
Root-mean-squared error
|1
-SRMSE|
Kriging of the whole dataset with measurement date
3.135 2.987 0.038
Co-kriging of the whole dataset with measurement date
2.973 2.936 0.011
Kriging of the subsetsa 3.266 3.055 0.063
Co-kriging of the subsetsa 2.962 3.008 0.055
water tables. Figure7 presents the box plot with the average results of the interpolation for each subset, and Table4presents the average results of the interpolations of each geomorphological system.
The maps of Figs.8and9show the multivariate zoning related to the potential of expanding the conjunctive use of water resources with regards to natural patterns and the effects of human interactions. The maps of Fig.10integrate the multivariate zoning of Figs.8and9and the interpolation of well yields. The map in Fig.11shows a qualitative zoning that interprets the patterns presented in Figs.8,9and10.
Discussion
Geomorphology
The geomorphological mapping aids in understanding the relationship between water and agricultural plants. Con-junctive water management for agricultural use should consider not only the surface water and groundwater use, but
also the water stored in the soil and used by the plants. In the back swamps of the floodplain, the traditional paddy fields are the crop best adapted to the hydromorphic soils, but the farmers in the area should consider seasonal flooding in their agricultural calendar. The flooding also brings with it new organic matter, which contributes to the soil fertility and inter-granular water retention. On the levees, the better drainage favors orchards that supply food for the local vil-lages and cities. Both the orchards and residences are usually located on the levees to remain relatively safe during floods. On the alluvial fans, the gently undulatory topography generates a striped pattern. In the higher strips, the farmers should be mindful of water stress in the soil, whereas crops are likely to be flooded in the lower areas in the event of heavy local rains. On the terraces and on the geomorphic threshold, field crops are more common than paddy fields (Land Devel-opment Department2009a) because the field crops are better adapted to soil without saturated surficial layers. However, in all of the geomorphic areas, irrigation (from surface water or groundwater) improves agricultural production because it maintains the desired soil moisture during the dry season. Kriging analysis
Table3 shows that the co-kriging improved the results of the interpolation because the procedure decreased the standard error and the root-mean-squared error of the interpolations and made the standard root-mean-squared error closer to 1. As a consequence, the addition of the auxiliary data improved the coherence of the spatial interpolations in the areas that are farther from the obser-vation wells of the primary dataset.
A comparison of the subsets based on rainfall and streamflow (both wet and dry seasons) indicates that there is a general lowering of the water table in dry years and that the aquifer is affected more on a time scale of years than months (wet and dry seasons).
The absence of a general lowering of the water table both during the dry seasons and in the comparison of the periods before and after 1992/1993, which is shown in Fig.7, supports the hypothesis that the aquifer still has good potential for cyclic seasonal conjunctive use. The overall stability of the level of the water table between the wet and dry seasons may indicate that the aquifer has significant interactions with the rivers or other aquifers that regularize the surplus or deficit in the water balance during the wet and dry seasons, respectively.
It is noteworthy that the subsets before and after 1992/1993 indicate an increase in the water table during the latter period. One explanation for this difference may be that the irrigation channels and ponds created for rice irrigation allow water to pass through the clay layers, thus allowing more recharge into the aquifer in addition to
contributions from the irrigation itself. This effect has already been noted by Bejranonda et al. (2008) in a field study in the area. This effect bodes well for the expansion of future irrigation projects based on conjunctive water use. Multivariate zoning
Nevertheless, even considering the average differences shown in the box plot, the results from the maps (Figs.8,9,
10) show a very distinct spatial heterogeneity in the changes in the aquifer water table. This heterogeneity may indicate areas with better potential for expansion of sea-sonal groundwater use.
The natural potential map set (Fig.8) shows that the areas more favorable for the expansion of conjunctive use are located in the western fans, whereas the areas with the least potential are in the northern fans–terraces systems. The northern fans and the floodplain exhibit good potential
Table 4 Average results of the interpolation of water table depth for each geomorphological system Geomorphological
system
Rain difference
Seasonal difference
Difference with regard to streamflow during wet season
Difference with regard to streamflow during dry season
Before and after 1992/1993
Pumping Yield
Floodplain 0.487 -0.326 0.554 -1.280 1.048 0.101 6.912
Fans–terraces (average) 0.761 0.112 0.374 -1.213 1.133 0.119 6.582
northern 0.137 -0.922 1.029 -1.292 1.552 0.115 6.502
western 0.993 0.773 0.320 -1.287 0.820 0.122 7.249
eastern 1.125 -0.053 -0.528 -0.884 1.325 0.117 4.869
Geomorphic threshold 0.804 0.709 -0.547 -0.780 0.581 0.046 4.176
Whole aquifer 0.672 0.036 0.320 -1.181 1.034 0.103 6.389
The italic fonts denote the two lower values, and the bold fonts denote the two higher values (not taking into account the average of the fans– terraces system as a whole but considering each of the three subsystems)
-10 -5 0 5 10 15 20
Diference from periods aer and before
1/1/1993
Data from 1993 to 2004
Data from 1968 to 1992
Difference from the Hight to Low Streamflow
Year in the Dry Season
Year with Low Streamflow in the Dry Season
Year with High Streamflow in the Dry Season
Difference from the High to Low Streamflow
Year in the Wet Season
Year with High Streamflow in the Wet
Season
Year with Low Streamflow in the Wet Season
Difference from Dry to Wet Rain Year
Wet Rain Year
Dry Rain Year
Difference from Wet to Dry Season
Dry Season
Wet Season
Observaon Data
Depth (m)
for recharge only due to flooding. The eastern fans and the geomorphic threshold systems possess good attributes with regard to rainfall recharge and seasonal balance but not flood recharge.
The multivariate zoning regarding human interaction (Fig.9) indicates that the best areas would be the eastern fans–terraces system and the geomorphic threshold area. There is a gradual southward change in favorability across the maps. The northern part of the aquifer mostly exhibits highly favorable potential with regard to the progress of occupation. At the latitude of the city of Phitsanulook, there is a belt with the worst values, which may be partly due to the higher pumping around the cities of Phitsanu-look, Phichit, Sukhothai and Kamphaeng Phet. South of this belt, there is an area with good potential regarding both the occupation trends and the lower pumping density (the
purple color indicates this pattern). In the southern part of the aquifer, there is an area with less water shortage stress during the dry seasons and a lower pumping density but with less potential as a result of the effect of occupation trends.
The integrated zoning (Fig.10) indicates that the best area for expansion of conjunctive use would be the western fans (except for the northern regions of these fans). Moreover, the integrated maps show other areas with good overall attributes across the aquifer; many of them on the floodplain. The borders of the northern half of the aquifer show the worst overall potential, which may be partly because the aquifer has a high hydraulic gradient. Thus, the gradient draws water away from these areas, and the thinner aquifer thickness (Fig.3) means that this part of the aquifer is more easily exhausted. However, the high
hydraulic gradient of these borders also indicates propi-tious conditions for recharge in conjunctive use schemes if they are articulated with retention ponds and controlled canals. The geomorphic threshold and the eastern fans have good potential based on the natural and human interaction effects, but they have the poorest yields. Furthermore, certain parts of the geomorphic threshold area with more rocky outcrops and lesser thicknesses exhibit poor overall potential.
Comparison of the water table patterns
with the geomorphology of the Upper Central Plain Compared to the average results of the fans–terraces and geomorphic threshold systems (Table4), the floodplain system displays less recharge from rainfall, more recharge from flooding, more stress during the dry season and more stress when there is less surface water during the dry sea-son. In contrast, the geomorphic threshold systems exhibit the reverse pattern, which, in addition to less pumping, shows a worse yield and a smaller increase in the level of the water table between the years before and after 1992/93. A plausible explanation for the smaller amount of rainfall recharge in the floodplain may be the larger pro-portion of clay deposited during the Quaternary, which hampers the percolation of the pluvial water. This thick clay layer may also hamper the leakage from rivers during the dry season, contributing to the more intense drawdown during that time of year. Based on these patterns, to expand the conjunctive use of water resources in the floodplain, special attention should be paid to lowering of the water table when extracting groundwater. However, there would also be a positive counterbalancing effect: the thicker clay layer that hampers the leakage from rivers to the aquifer during the dry season would also ensure that groundwater extraction during that season would not aggravate the conflicting demand for surface water downstream in the Chao Phraya River basin.
The fans–terraces system displayed intermediary values between those of the floodplain and the geomorphic threshold. However, when this system is subdivided into northern, western and eastern subsystems, the results are clearly different. The northern fans–terraces subsystem exhibits results much closer to that of the floodplain and, in many cases, even slightly more accentuated. Because the floodplain and the northern fans area are interfingered in the northern part of the aquifer, this mutual similarity may be due to similar water use patterns or similar aquifer attributes and processes in addition to possibly a thicker clay layer covering the northern part of the aquifer in general.
The western fans–terraces subsystem exhibits a better water budget (fluctuation of the water table) during the dry season. Finally, the eastern fans–terraces subsystem is the
least influenced by the flood recharge and also has the worst yield, very similar to that of the geomorphic threshold system. Two possible factors leading to these patterns in the western fans and the geomorphic threshold system include lesser aquifer thicknesses and the influence of clay and silt from igneous rocks that are mixed with the sediments of this aquifer (as noted by Takaya (1971, p. 394)).
The integrated zoning and the comparison among the subsystem also indicate a general spatial trend in the overall results, which starts in the north (the northern terraces) and the floodplain and changes gradually toward the western, eastern and especially the southern edges of the aquifer (the geomorphic threshold). This pattern is consistent with the groundwater flow in the aquifer, which can be inferred from the overall head elevations (Fig.6). In this aspect, each side contributing to the aquifer (north, west and southeast) has a different pattern of zoned attributes.
Because they are interfingered with broader systems, the terraces and coalescing levees usually reflect the pattern surrounding them (the fans and floodplains, respectively). Due to their smaller extent, the results of the kriging interpolation on a regional scale do not precisely reflect their effect on the local water table.
Limitations
The primary limitation of the interpolation of the groundwater table is the local heterogeneity that affects the hydrogeological processes. For example, perched aquifers created by clay lenses (which are common in the Younger Terrace Aquifer) may create local areas with a higher water table than the main groundwater surface (Desbarats et al. 2002). The kriging technique, as a non-deterministic interpolator, allows for an attempt to com-pensate for local heterogeneity by adding the nugget effect in the interpolation function (Cressie 1993). Fur-thermore, in spite of certain local scale uncertainties, the identification of the general regional trends observed in the area, based on many measured wells, produces a more consistent picture of the aquifer. However, in the areas with fewer observation wells, the interpolation is conse-quently less reliable and relies more on the covariation of the primary dataset with the spatial pattern of the auxil-iary data used for co-kriging.
Conclusions
This study was able to show temporal–spatial patterns in the fluctuation of the water table in the Younger Terrace Aquifer. It was possible to suggest explanations for the hydrogeological attributes and processes associated with a few of these patterns. However, many of these temporal and spatial changes warrant further investigation in future studies. Nonetheless, the description of these patterns is already a useful contribution to the conjunctive manage-ment of water use. The zoning indicated areas that have higher or lower potential for the expansion of the cyclic use of groundwater during dry seasons. The areas with higher yields, higher recharge from rainfall and flooding and less drawdown related to pumping, water shortages and inter-seasonal balance should be considered the best areas for conjunctive use. In the worst areas, increased caution regarding the amount and timing of groundwater use is advised.
The proposed method may be used with other tech-niques of hydrogeological research to produce a broader and more accurate understanding of an aquifer. For example, because the input data used in this study are usually available when building numerical groundwater models, modelers could use both methods in a comple-mentary evaluation of the hydrogeological processes. The comparison with the geomorphological maps also creates a better understanding of the underlying hydrogeological processes.
Complementary approaches could still be used for the analysis of aquifer recharge and discharge. Among the most frequently used techniques for such analyses include field methods (piezometers, lysimeters, tracers, etc.) and methods that employ indirect inference (water balance and hydrograph assessments). The use of fieldwork methods for large basins is associated with a high cost for the required sampling network and presents uncertainties regarding the spatial heterogeneity of the hydrogeological processes. The indirect methods may be useful in the evaluation of lumped recharge in watersheds, although they are problematic when evaluating the role of intra-basin and inter-basin differentiation of environmental attributes (soil, geomor-phology and lithostratigraphy). Maps of water quality indicators can also help to demonstrate the linkages between groundwater flows and lithostratigraphy.
The combined use of these complementary methods may help overcome the limitations of each method and provide a better understanding of the water table patterns investigated in this paper. The multivariate zoning that was presented focuses on the effect of the groundwater pro-cesses in the water table, whereas the complementary methods may be capable of providing an improved dif-ferentiation of the role of these processes (recharge,
discharge, leakage, river interaction, pumping) in the aquifer. The multivariate visualization method proposed in this paper may be used in other contexts that require the spatial evaluation of several variables. The method may also be used for just two variables because the two-color approach of the bivariate color maps (Trumbo 1981; Rei-mer 2011) is analogous to the three-color RGB approach.
Acknowledgments This research was supported by the CAPES Foundation [Coordenac¸a˜o de Aperfeic¸oamento de Pessoal de Nı´vel Superior (Coordination for the Improvement of Higher Level Per-sonnel)], process 5937-13-2, the Federal University of Ouro Preto (Universidade Federal de Ouro Preto—UFOP) and the Water Resources Engineering Department of the Faculty of Engineering at Chulalongkorn University. We thank Werapol Bejranonda and Chaweewan Wikarmparaharn for kindly sharing their research data from the upper central plain of Thailand. We also thank Apinyapon Seingyai, Anurak Sriaiyawat and Takahiro Sayama for helping in the fieldwork surveys and Sak Sakulthai for helping with the GIS data.
Open Access This article is distributed under the terms of the Creative Commons Attribution License which permits any use, dis-tribution, and reproduction in any medium, provided the original author(s) and the source are credited.
References
Ahmadi SH, Seghamiz A (2008) Application and evaluation of kriging and cokriging methods on groundwater depth mapping. Environ Monit Assess 138:357–368
Arlai P (2007) Numerical modeling of possible saltwater intrusion mechanisms in the multiple- layer coastal aquifer system of the Gulf of Thailand, Dr. Ing. Dissertation, School of Civil Engineering, University of Kassel, Germany
Balleau WP, Mayer AB (1988) The transition from groundwater mining to induced recharge in generalized hydrogeologic systems. In: Proceedings of FOCUS conference on Southwestern Ground Water Issues, National Water Well Association, Dublin, Ohio, pp 81–103
Bejranonda W, Koontanakulvong S, Koch M et al (2007) Ground-water modeling for conjunctive use patterns investigation in the upper Central Plain of Thailand, International Association of Hydrogeologists selected papers, Aquifer Systems Management: Darcy’s Legacy in a World of Impending Water Shortage. Taylor & Francis Group, London
Bejranonda W, Koontanakulvong S, Suthidhummajit C (2008) Study of the Interaction between Streamflow and Groundwater toward the Conjunctive use Management: a Case Study in an Irrigation Project. 1st NPRU Academic Conference, Oct. Annals. p 59–67 Bejranonda W, Koch M, Koontanakulvong S (2013) Surface water and groundwater dynamic interaction models as guiding tools for optimal conjunctive water use policies in the central plain of Thailand. Environ Earth Sci 70(5):2079–2086
Bishop CM (1995) Neural networks for pattern recognition. Oxford university press, Oxford, p 482
Borland D, Taylor RM (2007) Rainbow color map (still) considered harmful. Comput Graph Appl 27(2):14–17
Bredehoeft J, Kendy E (2008) Strategies for offsetting seasonal impacts of pumping on a nearby stream. Groundwater 46(1):23–29 Brown R (2005) Outgrowing the Earth: The Food Security Challenge
in an age of falling water tables and rising temperatures. Earth Policy Institute. Norton & Co, New York
Chen Y, Chen J, Xevi E et al (2010) GIS-based spatial hydrological zoning for sustainable water management of irrigation areas. In: International Congress on Environmental Modelling and Soft-ware. Modelling for Environment’s Sake, Fifth Biennial Meet-ing, Ottawa, Canada, International Environmental Modelling and Software Society (iEMSs)
CIA—Central Intelligence Agency, USA (1974) Vegetation Map of Thailand. http://www.mapcruzin.com/free-maps-thailand/ thailand_1974_vegetation.jpg. Cited 13 Dec 2013
Craig N, Aldenderfer M, Moyes H (2006) Multivariate visualization and analysis of photomapped artifact scatters. J Archaeol Sci 33:1617–1627
Cressie N (1990) The origins of kriging. Math Geol 22(3):239–252 Cressie NAC (1993) Statistics for spatial data, rev edn. Wiley, New York Dempster A, Laird N, Rubin D (1977) Maximum likelihood from incomplete data via the EM algorithm. J R Stat Soc Ser B 39(1):1–38
Desbarats AJ, Logan CE, Hinton MJ et al (2002) On the kriging of water table elevations using collateral information from a digital elevation model. J Hydrol 255:25–38
Firat M, Dikbas F, Koc AC et al (2010) Missing data analysis and homogeneity test for Turkish precipitation series. Sa¯dhana¯ Indian Acad Sci 35(6):707–720
Foster S, Van Steenbergen F, Zuleta J et al (2010) Conjunctive use of groundwater and surface water: from Spontaneous Coping Strategy to Adaptive Resource Management. Sustainable Groundwater Management Contributions to Policy Promotion. World Bank. Global Water Partnership. Strategic Overview Series, (2). http://www.un-igrac.org/dynamics/modules/ SFIL0100/view.php?fil_Id=202. Cited 14 Sep 2014
GISTDA (2013) Thailand flood monitoring system. http://flood. gistda.or.th/. Cited 13 Jan 2014
Hargrove WW, Hoffman FM (2004) The potential of multivariate quantitative methods for delineation and visualization of ecore-gions. Environ Manag 34(5):S39–S60
Hartley H (1958) Maximum likelihood estimation from incomplete data. Biometrics 14:174–194
Haruyama S (1993) Geomorphology of the central plain of Thailand and its relationship with recent flood conditions. Geo J 31(4):327–334
Haruyama S, Ohokura H, Simking T et al (1996) Geomorphological zoning for flood inundation using satellite data. Geo J 138(3):273–278
Healy R, Cook P (2002) Using groundwater levels to estimate recharge. Hydrogeol J 10:91–109
Houzer TL, Johnson AI (1985) Land subsidence caused by ground water withdrawal in urban areas. Geo J 11(3):245–255 Hungspreug S, Khao-uppatum W, Thanopanuwat S (2000) Flood
management in Chao Phraya river basin. The Chao Phraya Delta: Historical Development, Dynamics and Challenges of Thai-land’s Rice Bowl: Proceedings of the International Conference, 12–15 Dec 2000, Kasetsart University, Bangkok
Jain AK, Muralikrishna Rao BM, Rama Mohan Rao MS et al (2009) Groundwater Scenario in Andhra Pradesh. WASHCost - CESS Working Paper No.3, Hyderabad, India. p 29. http://www. washcost.info/page/1641. Cited 14 Dec 2013
Jarvis A, Reuter HI, Nelson A et al (2008) Hole-filled SRTM for the globe Version 4. CGIAR-SXI SRTM 90 m database.http://srtm. csi.cgiar.org. Cited 31 Mar 2013
Komori D, Nakamura S, Kiguchi M et al (2012) Characteristics of the 2011 Chao Phraya River flood in Central Thailand. Hydrol Res Lett 6:41–46
Koontanakulvong S (coord) (2006) The study of Conjunctive use of Groundwater and Surface Water in Northern Chao Phraya Basin Final Report. Department of Groundwater Resources. Chul-alongkorn University
Koontanakulvong S, Chaowiwat W, Mizayato T (2013) Climate change’s impact on irrigation system and farmers’ response: a case study of the Plaichumpol Irrigation Project, Phitsanulok Province, Thailand. Paddy and Water Environ. doi: 10.1007/ s10333-013-0389-8
Land Development Department (2009a) Thailand Land Use Map of 2009. Thailand Government
Land Development Department (2009b) Thailand Soil Map. Thailand Government
Merwing DH, Wickens CD (1993) Comparison of eight color and gray scales for displaying continuous 2D data. Proc Hum Factors Ergon Soc Ann Meet 37(19):1330–1334
Meteorological Department of Thailand (2013) The Climate of Thailand. p 7. http://www.tmd.go.th/en/archive/thailand_ climate.pdf. Cited 14 Dec 2013
Molle F (2002) The Closure of the Chao Phraya River Basin in Thailand: Its Causes, Consequences and Policy Implications. Asian Irrigation in Transition–Responding to the Challenges Ahead. 22–23 Apr, Workshop, Asian Institute of Technology, Bangkok, Thailand, p 16
Molle F (2007) Scales and power in river basin management: the Chao Phraya River in Thailand. Geogr J 173(4):358–373 Moslemzadeh M, Salarizazi M, Soleymani S (2011) Application and
assessment of kriging and cokriging methods on groundwater level estimation. J Am Sci 7(7):34–39
Murai S (ed) (1996) Remote sensing note. Japan Association on Remote Sensing, 2nd edn. Nihon, Tokyo
Murata G, Matsumoto E (1974) Natural vegetation and physiography of the Central Plain of Thailand. Southeast Asian Stud 12(3):280–290
Nikroo L, Zare MK, Sepaskhak AR et al (2010) Groundwater depth and elevation interpolation by kriging methods in Mohr Basin of Fars province in Iran. Environ Monit Assess 166:387–407 Peterson TJ, Chengb X, Westerna AW et al (2011) Novel indicator
geostatistics for water table mapping that incorporate elevation, land use, stream network and physical constraints to provide probabilistic estimation of heads and fluxes. In: 19th Interna-tional Congress on Modelling and Simulation, Perth, Australia, 12–16 Dec
Prajamwong S, Suppataratarn P (2009) Flood Mitigation Management in Urban Areas. Bangkok, Thailand: Royal Irrigation Depart-ment. Expert Group Meeting on Innovative strategies towards flood resilient cities in Asia-Pacific 2009.http://www.unescap. org/idd/events/2009_EGM-DRR/index.asp. Cited 13 Jan 2014 Presti RL, Barca E, Passarella G (2010) A methodology for treating
missing data applied do daily rainfall data in the Candelaro River Basin (Italy). Environ Monit Assess 160:1–22
Promma K, Zheng C, Asnachinda P (2007) Groundwater and surface-water interactions in a confined alluvial aquifer between two rivers: effects of groundwater flow dynamics on high iron anomaly. Hydrogeol J 15:495–513
Reimer A (2011) Squaring the Circle: bivariate color maps and Jacques Bertin’s concept of disassociation. In: Proceedings of the 25th International Cartography Conference. CO-054. p 10 Riley SJ, DeGloria SD, Elliot R (1999) A terrain ruggedness index
that quantifies topographic heterogeneity. Intermountain J Sci 5(1–4):23–27
Royal Irrigation Department (1979) Chao Praya-Mekong Basin Study—Phase 1. Ministry of Agriculture and Cooperatives, Thailand. Main Report, p 147
Rungdilokroajn V (1992) Natural disasters in Thailand. In: Seminar in Technology for Disaster Prevention, 16. Japan. National Research Institute for Earth Science and Disaster Prevention Science and Technology Agency. pp 141–52
Sophocleous M (2000) From safe yield to sustainable development of water resources: the Kansas experience. J Hydrol 235:27–43 Sophocleous M (2012) The evolution of groundwater management
paradigms in Kansas and possible new steps towards water sustainability. J Hydrol 414:550–559
Suthidhummajit C, Kootanakulvong S (2011) Climate Change Impact on Groundwater and Farmer’s Response. The Wang Bua Irrigation Project, Kampheng Phet Province, Thailand: Case Study. Society for Soc Manag Syst Internet J, p 11
Takaya Y (1971) Physiography of rice land in the Chao Phraya Basin of Thailand. Southeast Asian Stud 9(3):375–397
Trumbo BE (1981) A theory for coloring bivariate statistical maps. Am Stat 35(4):220–226
UNITAR (2011) Time Series Analysis of Thailand Flooding 2011. UNOSAT. United Nations. http://www.unitar.org/unosat/node/ 44/1615. Cited 13 Jan 2014
Uppasit S, Natthawiroj S, Fuangswasdi A et al (2012) Managed Aquifer Recharge Using Infiltration Pond: case study of Ban Nong Na, Phitsanulok, Thailand. IAH 2012 Congress, Annals, Niagara Falls, USA. p 7
Ware C (1988) Color Sequences for univariate maps: theory, experiments and principles. Comput Graph Appl 8(5):41–48 Yumuang S. (coord) (2012) Map of flooded areas in the period of