ISSN: 1809-4430 (on-line)
_________________________
1 Médico Veterinário, Professor, Doutor, Colégio Politécnico, UFSM, Santa Maria (RS), Brasil, fone: (55)3220-8375,:
2 Engenheiro A grônomo, Professor, Doutor, Pós-Graduação em Zootecnia, UFRGS, Porto Alegre (RS), Brasil, [email protected] 3 Administrador de Empresas, Professor, Doutor, Pós-Graduação em Engenharia de Produção, UFSM, Santa Maria (RS), Brasil,
4 Engenheira Agrônoma, Professora, Doutora, Pós-Graduação em Zootecnia, UFRGS, Porto Alegre (RS), Brasil, [email protected] 5 Engenheiro Mecânico, Pós-Graduação em Engenharia de Produção, UFSM, Santa Maria (RS), Brasil, [email protected]
USE OF INTERACTIVE PERFORMANCE OPTIMIZATION FOR IDENTIFYING THE IDEAL PROFILE OF SWINE FINISHING PRODUCERS
Doi:http://dx.doi.org/10.1590/1809-4430-Eng.Agric.v35n2p 197-205/2015
LUIZ F. SANGOI1, ALEXANDRE M. KESSLER2, JULIO C. M. SILUK3, ANDREA M. L.
RIBEIRO4, ALVARO L. NEUENFELDT JÚNIOR5
ABSTRACT: The present research aimed to develop a modeling capable of identifying the ideal
profile of swine finishing producers using the interactive performance optimization, which began by verifying qualitative the criteria considered most relevant to the decision-making, generating a closed structured diagnosis that covers the socioeconomic aspects about the activity, until the design of a mathematical model able to translate the data obtained in quantitative information. For the verification, it was proposed a practical study for a universe of 120 members of a cooperative in the state of Rio Grande do Sul, Brazil. The results showed that, from the application and the definition of the ideal profile, it was possible to verify that 82 producers are in the group of those who have obtained a "Good" performance, and to 44 the result is in the range between 86% to 90% from the ideal, which means that most have short or medium-term conditions to evolve their status for the considered "Very Good", where only 12.5% of the producers are currently.
KEYWORDS: swine production, performance optimization, competitiveness, agribusiness.
USO DA OTIMIZAÇÃO DE DESEMPENHO INTERATIVA NA IDENTIFICAÇÃO DO PERFIL IDEAL DE PRODUTORES TERMINADORES DE SUÍNOS
RESUMO: A presente pesquisa teve por objetivo desenvolver uma modelagem capaz de identificar
o perfil ideal de produtores terminadores de suínos utilizando a otimização de desempenho interativa, que se iniciou através da verificação qualitativa dos critérios considerados de maior relevância para o contexto decisório, gerando um diagnóstico contendo perguntas estruturadas fechadas que abrangem aspectos socioeconômicos acerca da atividade, até se chegar à concepção do modelo matemático capaz de traduzir os dados obtidos em informações q uantitativas. Para a verificação, foi proposto um estudo prático para um universo de 120 produtores associados a uma cooperativa localizada no Rio Grande do Sul. Os resultados mostraram que, a partir da definição do perfil ideal, foi possível verificar que 82 produtores estão no grupo dos que obtiveram um desempenho “Bom”; sendo que, para 44, o resultado se encontra na faixa entre 86% e 90% do ideal,
o que significa que a maioria possui condições a curto ou médio prazos de evoluir seu status para o
considerado “Muito Bom”, onde apenas 12,5% dos produtores se encontram atualmente.
PALAVRAS-CHAVE: suinocultura, otimização de desempenho, competitividade, agronegócio.
INTRODUCTION
nutritional status, health management, genetic quality and productivity of the squad (BAPTISTA et al., 2011; ABCS, 2011; COELHO et al., 2011; EMBRAPA, 2013).
Despite of this progress, discrepancies are still observed in the way that the control of productivity on farms which can result in management prognoses flawed regarding the performance of each one of the producers, resulting in a scenario of high unpredictability at the moment of the prediction realization about the future behavior of the market for pig production industries and cooperatives (BEATTIE et al., 2000; SILVA et al., 2008).
Therefore, the importance of the interactive optimization role for the management context of enterprise operations allow an increase in the level of competitiveness in the market (KAPLAN & NORTON, 2008; PORTER, 2009; NEUENFELDT JÚNIOR et al., 2014), as well as a convergent way to the increase of earnings of farming activities according to special emphasis given the proposal described by DILL et al. (2010) when dealt with the implementation of strategies to optimize the portfolio products as changes seasonality and climate of a region, KING et al. (2010) about the ways in which the economic dynamics and management are interrelated in the sector, and
ZARÓD (2011) for the dynamic optimization of production-related factors in agribusiness.
Consistent to the foregoing the present research aimed to develop a model capable of identifying the ideal profile of pig's finishing producers using the interactive performance optimization.
In relation to the technical professional framework the correct management of pig farming allows an increase in the level of competitiveness between cooperative industries located in the same region, in order to obtain incremental productivity gains. As for the academic sphere it is expected that the article fills a gap recurring to searches involving performance measurement of activities related to agribusiness management.
MATERIAL AND METHODS
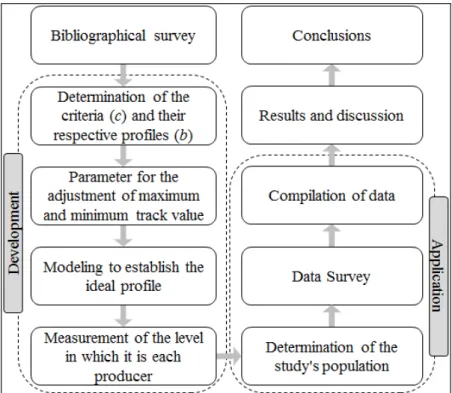
The development of the research is grounded through the completion of ten methodological steps (Figure 1), assuming the bibliographical survey initially based on the studies of BEATTIE et al. (2000), EMBRAPA (2003), GIVANT & MIRANDA (2004), EMBRAPA (2006), GONÇALVES & PALMEIRA (2006), DILL et al. (2010), KING e t al. (2010), ABCS (2011), FERREIRA (2012) and EMBRAPA (2013).
Being tied to a vertical organizational structure favored for its vast Brazilian territory the swine industry has been directly linked to production capacity of its main inputs as corn, soybean and the technology used in the creation which entails the possibility of falling operating costs compared to the international competition (BEATTIE et al., 2000; EMBRAPA, 2013).
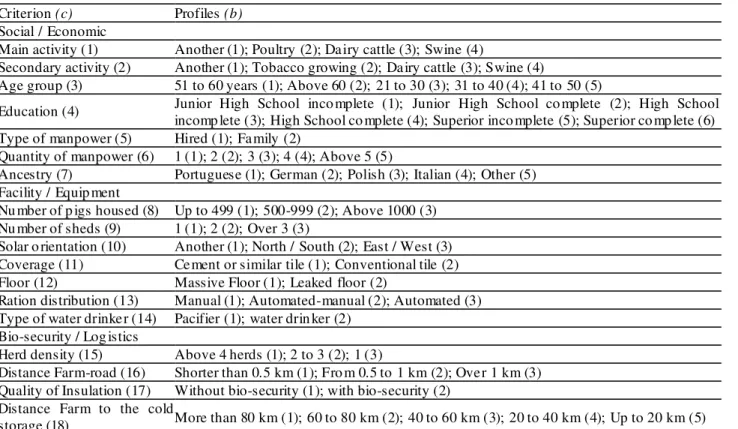
Criteria (c) determination was established in 18 points which were divided into three groups (Social / Economic, Facilities / Equipment and Bio-security / Logistics) in order to facilitate the
verification where each consists of a series of profiles (b) (Table 1) in such a way there is the
possibility of individually list all producers (p) in at least one of these.
It is a particular highlight issues the main activities ( ) and secondary ( ) it was
found that all producers are involved in the execution of more than one productive activity beyond swine industry. Thus, when a swine producer is characterized as the main, this profile was automatically excluded from the selection of the secondary activity.
TABLE 1. Criteria and profiles selected.
Criterion (c) Profiles (b)
Social / Economic
Main activity (1) Another (1); Poultry (2); Dairy cattle (3); Swine (4)
Secondary activity (2) Another (1); Tobacco growing (2); Dairy cattle (3); Swine (4)
Age group (3) 51 to 60 years (1); Above 60 (2); 21 to 30 (3); 31 to 40 (4); 41 to 50 (5)
Education (4) Junior High School inco mplete (1); Junior High School co mplete (2); High School incomp lete (3); High School co mplete (4); Superior inco mplete (5); Superior co mp lete (6) Type of manpower (5) Hired (1); Family (2)
Quantity of manpower (6) 1 (1); 2 (2); 3 (3); 4 (4); Above 5 (5)
Ancestry (7) Portuguese (1); German (2); Polish (3); Italian (4); Other (5) Facility / Equip ment
Nu mber of p igs housed (8) Up to 499 (1); 500-999 (2); Above 1000 (3) Nu mber of sheds (9) 1 (1); 2 (2); Over 3 (3)
Solar o rientation (10) Another (1); North / South (2); East / West (3) Coverage (11) Cement or similar tile (1); Conventional tile (2) Floor (12) Massive Floor (1); Leaked floor (2)
Ration distribution (13) Manual (1); Automated-manual (2); Automated (3) Type of water drinker (14) Pacifier (1); water drin ker (2)
Bio-security / Log istics
Herd density (15) Above 4 herds (1); 2 to 3 (2); 1 (3)
Distance Farm-road (16) Shorter than 0.5 km (1); Fro m 0.5 to 1 km (2); Over 1 km (3) Quality of Insulation (17) Without bio-security (1); with bio-security (2)
Distance Farm to the cold
storage (18) More than 80 km (1); 60 to 80 km (2); 40 to 60 km (3); 20 to 40 km (4); Up to 20 km (5)
The quantitative guided optimization aimed to be able to describe the data collected in logical mathematics information, in order to make feasible the process of comparison of the production of each swine producer, for which later became feasible identifying the ideal profile.
To this, the checking counts with five numeric data treatment steps beginning by defining the
function of maximizing the global index ( ), described to this modeling as shown in Equation 1,
determined by the value which refers directly to the ideal profile definition (b) of the producer for
each criterion (c),
(1)
where,
is the feed conversion ratio (kg animal/ kg feed),
the mortality rate (absolute numbers),
, theaverage daily gain index (kg animal / days) ( ),
and : generic variable indices used for modeling
purposes of calculation, expressed in the case of normalized proportionately ( ), as
measurement scales are different which makes it infeasible to compare the values without prior standardization in favor of the same unit of measure. It is necessary to determine the values that served as a parameter for a needed standard scale, making use of the determination by the two limits researchers, referred to as maximum in proportion, and
and minimum .
The index is proposed concerning the search for results that establish the best outcome
( ) for feed conversion concerning to producers being both essential to find the average
value that can express the best relationship between the function of the variable amount of feed (kg
feed) ( ) consumed in relation to the live weight of the pig (kg animal) ( ) obtained for each o f
the live animals (an) passed along to the cooperative to slaughter (YAGUE, 2008; IRGANG, 2011),
resulting in the expression described by [eq. (2)]:
(2)
For the second index called mortality ( ), it must also find the minimum value ( )
that can express the best relationship established in mortality parameter ( ), calculated through
the number of animals housed for animal husbandry ( ) with the mortality total ( ) during the
growth and termination period, based on SOTO el al. (2008) and calculated using the [eq. (3)]:
(3)
Finally, the third index, as determined by Average Daily Gain (ADG) available by
indicator , aims to find the highest value ( ) regarding to the gain estimates checked
for each producer, in accordance with the established maximizing for Equation 4, to relative to
the total weight of each animal at slaughter (Kg animal) and the number of housed days,
according to AMARAL & MORES (2008) and EMBRAPA (2013).
(4)
Regarding to the relative percentage values of each producer for the three selected
indexes, feed conversion ( ), mortality ( ) and Average Daily Gain ( ), that its calculatio n
is directly linked to the minimum and maximum estimates parameterized previously in relation to
(5)
Therefore, it becomes feasible to measure the overall index of the ordained profiles, in
descending order, as to their level of importance obtaining individual types of producers that refer
to a configuration considered optimal for the problem ( ) regarding the differences
for profiles located between the maximum and the minimum overall, from the
descriptions proposed in the eqs. (6) and (7):
(6)
(7)
Through the ideal propositions established, it can perform the grouping in order to identify, in
a unified way, the characteristics that best refer the considered ideal profile (AIG) through the set
. Yet in order to provide an additional verification tool, it is proposed the development of the indicator which can refer the situation of the producers in
relation to the profiles determined as ideal in pig farms ( ), in order to enable the separate
measurement of the situation of these with the system to which they are inserted, following the definitions proposed by the Equation 8 in relation to the stipulated criteria,
(8) where,
the result of the comparison returns a value in percentage units so that the more the
approach the , the better the producer's situation, besides allowing the measurement of
the global status of it in relation to other cooperatives.
In order to visualize more clearly the context of the situation, it is proposed the use of a range of fractional values of five parts: the worst, referred to as "Fair", is found in a distribution from to 70%, the "Intermediate" comprises the values in between 71% and 80%, "Good"
from 81% to 90%, "Very Good" from 91% to 99% and finally with has the
profile referred as "Ideal", according to the demand for clarification identified by the researches authors.
For the practical application of the development of interactive optimization, the research was conducted by the data obtained in a cooperative which covers 47 municipalities in the Vale do Taquari region, located in the state of Rio Grande do Sul, comprising the research the universe of 120 producers between February and March 2012, in the termination phase (100 days of animal production), where the average weight of the piglets in the termination shed was 25.27 kg and 112.2 kg for slaughter.
Data were collected from two sources: the first relating the use of a diagnosis with structured closed questions generated by prescribed criteria, and the second was referring to all the productive results provided by the cooperative for the year 2011. Finally, this set of information was compiled
by using spreadsheets provided by software Microsoft Excel®.
RESULTS AND DISCUSSION
characteristics of the producers it is possible to say that 96% are male, and 64% of the totals are primarily involved with activities directly linked to swine, fact considered normal by noting that many of the properties have conditions to engage in different activities.
As for education, only 6.7% of the respondents have degree in graduate courses, while 58.3% are in or not completing primary education and, finally, 35% are finishing or have already completed high school. For the age group, 56.7% of the producers were in an age from 41 to 60 years old, and the sum of the values that are at the extremes of the curve (21 to 30 and over 61 years old) fills only 42.5% of the adopted universe.
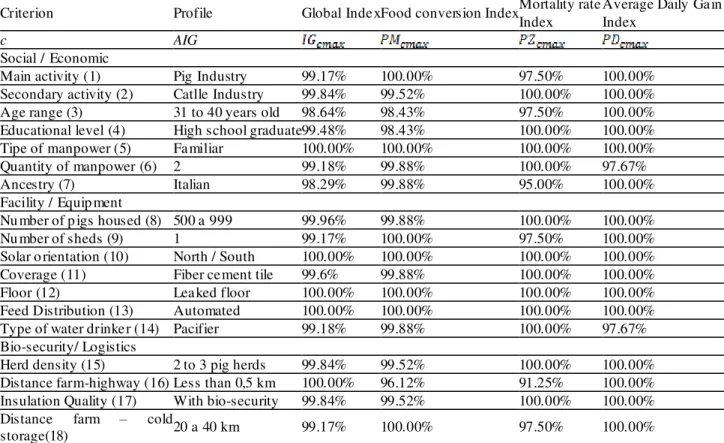
Following the population characteristic predisposed, Table 2 shows the consolidated results
for determining the ideal profile of the pig farmers by maximizing the overall index ( ) of
each criterion, considering the minimum and maximum parameters: feed conversion
( and ), mortality ( and ) and ADG
( and ), identified in the course of the data collection stage.
TABLE 2. Profile set as ideal for each criterion.
Criterion Profile Global Index Food conversion Index Mortality rate Index
Average Daily Gain Index
c AIG
Social / Economic
Main activity (1) Pig Industry 99.17% 100.00% 97.50% 100.00% Secondary activity (2) Catlle Industry 99.84% 99.52% 100.00% 100.00% Age range (3) 31 to 40 years old 98.64% 98.43% 97.50% 100.00% Educational level (4) High school graduate 99.48% 98.43% 100.00% 100.00% Tipe of manpower (5) Familiar 100.00% 100.00% 100.00% 100.00% Quantity of manpower (6) 2 99.18% 99.88% 100.00% 97.67% Ancestry(7) Italian 98.29% 99.88% 95.00% 100.00% Facility / Equip ment
Nu mber of p igs housed (8) 500 a 999 99.96% 99.88% 100.00% 100.00% Nu mber of sheds (9) 1 99.17% 100.00% 97.50% 100.00% Solar o rientation (10) North / South 100.00% 100.00% 100.00% 100.00% Coverage (11) Fiber cement tile 99.6% 99.88% 100.00% 100.00% Floor (12) Leaked floor 100.00% 100.00% 100.00% 100.00% Feed Distribution (13) Automated 100.00% 100.00% 100.00% 100.00% Type of water drinker (14) Pacifier 99.18% 99.88% 100.00% 97.67% Bio-security/ Logistics
Herd density (15) 2 to 3 pig herds 99.84% 99.52% 100.00% 100.00% Distance farm-highway (16) Less than 0,5 km 100.00% 96.12% 91.25% 100.00% Insulation Quality (17) With bio-security 99.84% 99.52% 100.00% 100.00% Distance farm – cold
storage(18) 20 a 40 km 99.17% 100.00% 97.50% 100.00%
First of all, it was found that only four of the criteria (c) calculated in peaked 100%
proposed for the application, family manpower ( ), north / south orientation ( ), leaked
floor ( ) and distribution of automated feed ( ), a fact derived only from partial
homogeneity of the results for the ideal profile for the three indexes, since its composition is proposed by the average of these. Notably, it can be seen that the results of the ADG index are
equivalent to 100%, and in only two points ( and ) this
pattern is not perpetuated.
Based on the calculated results, in terms of the producers' age, it was noticed a relative higher production values for those who declared the range between 31 to 40 years old when contact with production becomes more intensive and direct. Education has become a global superiority relative
to those who finished high school ( ), because it is believed that they were able
to correlate effectively studies up to this level and the development of their skills.
Two people are the ideal number involved, as cited in a figure that usually involves responsible for the property and another member who as noted on the best results, it is someone directly connected to the family, a fact that complements the argument that this type of manpower is more appropriate together with the fact that from 1992 to 2013 there is a gradual shortage of this type of worker in agribusiness as shown in the data by FEE (2013) for the state of Rio Grande do Sul.
For structural issues it was observed that the leaked floor has an advantage over the massive one of 1.70%, and the roof with cement tile type took advantage of 3.60% over the clay tile although most of the nationwide, almost entirely, the clay tile has advantages to fiber cement ("asbestos") due to the physical characteristics of the products (thermal conductivity, thermal delay and damping) (ABCS, 2011; SARUBBI, 2012).The isolation was a favorable trend for producers using bio-security facilities accessed by a building containing office, dressing room, and pharmacy, in attention to the rules that prevent access and movement of people and vehicles to the farm according to the recommended by EMBRAPA (2003).
For the two criteria involving measurements of distances, on the first proposal, the
relationship between the highway and the farm ( ), was obtained the optimal outcome for the
lowest proposal (Less than 0.5 km), as the easiest especially for the arrival of inputs which enables the reduction of freight costs for charging to the property and facilitate the access of rural technicians responsible for monitoring the activities progress . For the distance between the farm to
the slaughterhouse ( ), it was noted that the ideal outcome is proposed for intermediate
distances (20-40 km) seen the best conditions in which are the roads used to transport the production of producers who are featured in this range.
As to items related to bio-security it was found that the most appropriate feeding is performed
automatically ( ), as well, in accordance to ORRICO et al. (2010) and ABCS
(2011), is assessed that the producer can control more effectively the way feeding is being conducted on animals regardless to the type of feed.
For the water drinker there was a slight predominance of system that uses a pacifier type
( ) in relation to the feeder ( ), which is consistent with
recommendations cited by OLIVEIRA (2002) in concern the most rational use of water resources for swine. To verify the ideal profile by the results obtained to the context of pig farming area surveyed it allowed to check the following situation in which are each of the 120 clients studied. Therefore, the article's focus is not individually specify the status of each proposal but was to see the general results as the previously defined methodology scale.
Thus, it was found that 82 producers are in the group of those who obtained "Good" performance, and for 44 the result is in the range of 86% to 90% of the ideal, which means that most of them have conditions in the short or medium-term to improve their status for the considered "Very Good", where only 12.5% of the producers are presently, as the highest percentage was found
, being 3% above the second placed ( ). Finally, the arithmetic mean result
for the population subject to verification is equal to 85%, equivalent to a level of performance considered "Good" level.
CONCLUSIONS
presented for finishing pig farming producers, where were reached a set of points that were determined as a guidance standard on the search for the optimization of the farms which are in a lower standard level.
It was evident that the application of the tool to other universes refer, as the system characteristics adopted in other ideal profiles, a fact that is consistent with the proposal of the study to make the model applicable to any settings in pig farming. Finally, for future prospects, it is believed that the development of specific software for this purpose shall refer to improvements in the condition of exploring the situation of the producer in relation to the context.
REFERENCES
ABCS. Manual brasileiro de boas práticas agropecuárias na produção de suínos. Brasília:
Associação Brasileira dos Criadores de Suínos, 2011, 140p. Disponível em:
<http://issuu.com/revistaabcs/docs/manual_brasileiro_de_boas_praticas>. Acessed in: 4 set. 2013. AMARAL, A.L.; MORES, N. Planejamento da produção de suínos em lotes com vazio sanitário.
Acta Scientiae Veterinariae, Porto Alegre, v. 36, p. 143-154, 2008.
BAPTISTA, R.I.A.A.; BERTANI, G.R.; BARBOSA, C.N. Indicadores do bem-estar em suínos.
Ciência Rural, Santa Maria, v. 41, n. 10, 2011.
BEATTIE, V.E.; O’CONNELL, N.E.; MOSS, B.W. Influence of environmental enrichment on the
behavior, performance and meat quality of domestic pigs. Livestock Production Science,
Amsterdam, v. 65, p.71-79, 2000.
COELHO, L., LÉGA, E.; MARTINS, J.R.; MARQUES, P.A.; SILVEIRA, A.L.G.; MENEZES, M.C. Avaliação espermática e dosagem sérica do cortisol em dois suínos em diferentes períodos do
dia. Nucleus Animalium, São Paulo, v. 3, n. 1, maio 2011.
DILL, R.P.; DE SOUZA, F.C.; BORBA, J.A. A proposal of a portfolio optimization model for the
summer cultures. Custos e Agronegócio, Recife, v. 6 n. 3, p. 90-110, 2010.
EMBRAPA. Produção suínos: biossegurança. Concórdia: Embrapa Suínos e Aves, 2003. 2p.
Disponível em: <http://sistemasdeproducao.cnptia.embrapa.br/FontesHTML/Suinos/SPSuinos/ biosseguranca.html>, Acessed in: 18 jun. 2013.
EMBRAPA. Boas práticas de produção de suínos: Concórdia: Embrapa Suínos e Aves, 2006. 60p. (Circular Técnica, 50). Disponível em: <http://www.cnpsa.embrapa.br/sgc/sgc_publicacoes/ publicacao_k5u59t7m.pdf>. Acessed in: 4 set. 2013.
EMBRAPA. Produção suínos: mercado e comercialização. Concórdia: Embrapa Suínos e Aves, 2013. 2p. Disponível em: <http://sistemasdeproducao.cnptia.embrapa.br/FontesHTML/Suinos/ SPSuinos/mercado.html>, Acessed in: 18 jun. 2013.
FEE. Estimativas e índices do nível de ocupação, por setor de atividade econômica -1992/2013.
Porto Alegre: Fundação de Economia e Estatística, 2013. Disponível em: <http://www.fee.tche. br/sitefee/pt/content/publicacoes/pg_boletins_ped_mensal_sh.php>. Acessed in: 4 set. 2013.
FERREIRA, R.A. Suinocultura manual prático de criação. Viçosa: Aprenda Fácil, 2012.
GONÇALVES, R.G.; PALMEIRA, E.M. Suinocultura brasileira. Revista Acadêmica de Economia,
Colômbia, n. 71, p. 1-11, dez. 2006.
GUIVANT, J. S.; MIRANDA, C.R. Desafios para o desenvolvimentos da suinocultura: uma
abordagem multidisciplinar. Chapecó: Argos, 2004. 332 p.
IRGANG, R. Conversão alimentar em tempos de crise na suinocultura: Cascavel: BIRIBA’S
KAPLAN, R.S.; NORTON, D.P. A Execução premium. Rio de Janeiro: Campus, 2008.
KING, R.P.; BOEHLJE, M.; COOK, M.L.; SONKA, S.T. Agribusiness economics and
management. American Journal of Agricultural Economics, Urbana, v. 92, n. 2, p. 554-570, 2010.
NEUENFELDT JÚNIOR, A.L.; SILUK, J.C.M.; SOLIMAN, M.; MARQUES, K.F.S. Study to
evaluate the performance development of Brazilian franchise segments. Independent Journal of
Management & Production, São Paulo, v. 5, n. 2, p. 381-397, 2014.
OLIVEIRA, P.A.V. Uso racional da água na suinocultura. Brasília: Embrapa Suínos, 2002. v.1, p.
63-71.
ORRICO JÚNIOR, M.A.P.; ORRICO, A.C.A.; LUCAS JÚNIOR, J. Avaliação de parâmetros da biodigestão anaeróbia de dejetos de suínos alimentados com dietas à base de milho e sorgo.
Engenharia Agrícola, Jaboticabal, v. 30, n. 4, p. 600-607, 2010.
PORTER, M. Competição. São Paulo: Campus, 2009.
SARUBBI, J.; ROSSI, L.A.; MOURA, D.J.; OLIVEIRA, D.A.; MAIA, A.P.A. Nocturnal thermal
comfort in facilities for growing swines. Engenharia Agrícola, Jaboticabal, v. 32, n. 6, p.
1034-1040, 2012.
SILVA, I.J.O.; PANDORFI, H.; PIEDADE, S.M.S. Influência do sistema de alojamento no
comportamento e bem-estar de matrizes suínas em gestação. Revista Brasileira de Zootecnia,
Viçosa, MG, v. 37, n. 7, p. 1319-1329, 2008.
SOTO, F.R.M.; VUADEN, E.R.; BENITES, N.R.; AZEVEDO, S.S.; PINHEIRO, S.R.; COELHO, C.P.; VASCONCELLOS, S.A. Avaliação dos índices zootécnicos de uma granja comercial de
suínos com a utilização do tratamento homeopático. Veterinária e Zootecnia, Botucatu, v. 15,
p. 577-586, 2008.
YAGUE, A.P. Parâmetros produtivos em suínos em crescimento. Campinas: Suínos & Companhia,
2008. (Revista Técnica da Suinocultura). 2p. Disponível em: <http://www.suinosecia.com.br/25/ htmls/creche.html>. Acessed in: 18 jun. 2013.
ZARÓD, J. Implementation of unused production factors in agriculture by means of dynamic
optimization models with random constraints. Journal of Agribusiness and Rural Development,