Vol.49, n. 3 : pp. 503-514, May 2006
ISSN 1516-8913 Printed in Brazil BRAZILIAN ARCHIVES OF BIOLOGY AND TECHNOLOGY
A N I N T E R N A T I O N A L J O U R N A L
Influence of the Reactor Shape on the Kinetics of Ethanol
Production in Laboratory-Scale Batch Fermentation Tests
Carried out in Unstirred Vessels
Walter Borzani*, Fabiana Saraguza de Souza, Claudia Yoshie Soyama, Patricia Marie Furuko and Daniela Souza Ferreira
Instituto Mauá de Tecnologia; Escola de Engenharia Mauá; Praça Mauá 1; 09580-900; [email protected]; São Caetano do Sul - SP - Brasil
ABSTRACT
The influence of the shape of laboratory-scale unstirred reactors on the kinetics of ethanol production in batch ethanol fermentation was studied. Two reactors were used: a 1-L glass measuring cylinder and a 2-L Erlenmeyer flask. The volume of inoculated medium in each reactor was 1,000 mL. The above influence was affected by the ratio between the initial yeast cells concentration (X0: ∼7 g/L, ∼14 g/L, and ∼21 g/L, dry matter) and the initial glucose
concentration (S0: ∼100 g/L, ∼150 g/L and ∼200 g/L). When X0/S0 increased from 0.038 to 0.219 the influence of the
reactor shape decreased, and was not observed when X0/S0 = 0.22 to 0.24. The reactor shape practically did not
affect the ethanol yield, the final yeast cells concentration and both the viability and the morphology of the cells in tests carried out at the same value of X0/S0.
Key words: Batch ethanol fermentation; ethanol production kinetics; reactor shape; unstirred reactor
*
Author for correspondence
INTRODUCTION
Due to the difficulty to obtain useful information on the kinetics of fermentation processes from reactors that have spatially nonuniform conditions, it is desirable to study kinetics in reactors that are well mixed (Bailey and Ollis, 1986).
Laboratory-scale fermentation tests, however, are frequently carried out in small unstirred reactors. When gases are produced (e.g. ethanol fermentation, anaerobic treatment of wastewater, acetone-butanol fermentation), the ascending gas bubbles, depending on the experimental conditions, may significantly affect the degree of homogeneity of the fermenting medium and, consequently, the kinetic behavior of the microbial
cells. Among the above conditions, the reactor shape must be considered.
Such facts clearly show that the reactor shape must be considered mainly to compare the kinetic results obtained in different experiments.
The aim of this work was to study the influence of the shape of laboratory-scale unstirred reactors on the kinetics of ethanol fermentation.
MATERIALS AND METHODS
Baker’s compressed yeast (Sacharomyces
cerevisiae) was used as inoculum in all the experiments. Tests were carried out with initial yeast concentrations (dry matter) approximately equal to 7 g/L, 14 g/L and 21 g/L.
The fermentation media were prepared dissolving D-glucose, KH2PO4, urea, yeast extract and MgSO4.7H2O in distilled water. The initial glucose concentrations of the inoculated media were approximately equal to 100 g/L, 150 g/L and 200 g/L. The initial concentrations of the other
nutrients (% of the initial glucose concentration) were: KH2PO4, 4.00; urea, 1.75; yeast extract, 1.75; MgSO4.7H2O, 0.75. The initial pH of the inoculated media was 4.5. No antifoam was used, since very small quantities of foam were produced. The reactors used in this work were 1-L glass measuring cylinders and 2-L Erlenmeyer flasks. With the only purpose to assure the same evaporation losses in both reactors, the cover schematically represented in Fig. 1 was placed on the cylinder. The above reactor shapes were chosen because they are the most frequently used to carry out ethanol fermentation laboratory-scale experiments. Each reactor received 1,000 mL of inoculated media, leading to H/D (H = height of the medium layer; D = average reactor diameter) equal to 6.3 and 0.46 in the cylinder and in the Erlenmeyer flask, respectively. The tests were carried out at 32±1ºC. The rectors were not stirred and no air was supplied.
Figure 1 - Schematic representation of the cover placed on the cylinder. 1: metallic cover. 2: cover neck dimensionally equal to the Erlenmeyer flask neck. 3: reactor wall. 4: rubber gasket. 5: cotton wool plug (4.5g).
The DNS method (Miller, 1959), dichromate method (Joslyn, 1970) and the method described by Borzani et al. (1977) were used to measure the concentrations of glucose, ethanol and yeast cells, respectively. The yeast cells viability was measured by the methylene blue staining method (Vairo, 1961).
The relative ethanol yield (η) and the ethanol productivity (P) were calculated by Equations [1] and [2], respectively, where Ep is the concentration of produced ethanol, S0 is the initial glucose concentration, tf is the time to attain complete
fermentation and 0.511 is the stoichiometric ratio between ethanol and glucose.
0
511
.
0
100
S
E
p=
η
[1]f p
t E
P= [2]
The ethanol production rates (dE/dt) were
RESULTS
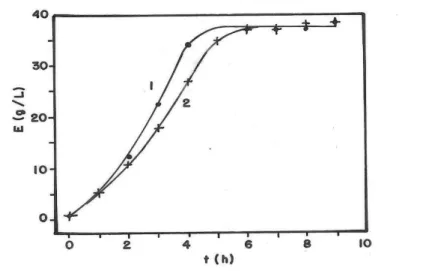
Fig. 2, where E is the ethanol concentration at time
t, shows the results obtained in a typical
experiment.
Table 1, where X0 and Xf are the initial and the final yeast cells concentrations (dry matter) respectively, shows the results obtained in our tests. The final concentrations of glucose were smaller than 1% of S0.
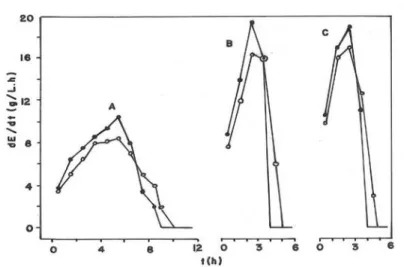
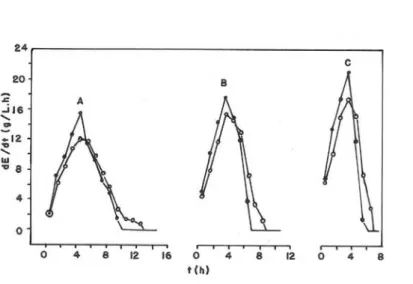
Figs. (3), (4) and (5) present the influence of both X0/S0 and the reactor shape on the ethanol production rates.
The yeast cells viability at the end of the experiments carried out in the cylinder and in the Erlenmeyer flask varied from 77% to 85% and from 83% to 89%; respectively. The cells viability of the inocula was 97-99%. The yeast cells morphology was not affected by the reactor shape.
Figure 2 - Ethanol concentrations (E) during tests carried out using the same medium (S0 = 96.8
g/L; X0/S0 = 0.062) in a 1-L glass measuring cylinder (Curve 1; Test N°1) and in a 2-L
Erlenmeyer flask (Curve 2; Test N°2). See Table 1.
Table 1 - Results obtained in all the tests.
Test Nº Reactor (*) S0 (g/L) X0 (g/L) Xf (g/L)
X0/S0 tf
Figure 3 - Influence of both the reactor shape (Cylinder, •; Erlenmeyer flask, o) and X0/S0 on the
ethanol production rate (dE/dt) when S0≅ 100 g/L. A: tests nº 1 and 2 (X0/S0 = 0.062).
B: tests nº 3 and 4 (X0/S0 = 0.139). C: tests nº 5 and 6 (X0/S0 = 0.219). See Table 1.
DISCUSSION
During batch ethanol fermentation experiments carried out in unstirred reactors, the frequency of the contacts between the yeast cells and the molecules of the substances dissolved in the medium, depends on both the CO2 production rates (mainly affected by the concentrations of glucose and yeast cells) and the velocities of the ascending CO2 bubbles (affected by both the CO2 production rates and the reactor shape).
When media with the same composition are fermented in the cylinder and in the Erlenmeyer flask, the CO2 will be produced at the same rate at the beginning of the test, but the velocities of the ascending gas bubbles in the cylinder will be greater than in the Erlenmeyer flask. If the CO2 production rate is sufficiently high, the yeast cells will be maintained in suspension in both reactors leading to practically the same kinetic results (see Fig. 3,C).
Figure 4 - Influence of both the reactor shape (Cylinder, •; Erlenmeyer flask, o) and X0/S0 on the
ethanol production rate (dE/dt) when S0≅ 150 g/L. A: tests nº 7 and 8 (X0/S0 = 0.048).
Figure 5 - Influence of both the reactor shape (Cylinder, •; Erlenmeyer flask, o) and X0/S0 on the
ethanol production rate (dE/dt) when S0≅ 200 g/L. A: tests nº 13 and 14 (X0/S0 = 0.038).
B: tests nº 15 and 16 (X0/S0 = 0.074). C: tests nº 17 and 18 (X0/S0 = 0.108). See Table 1.
Figure 6 - Influence of X0/S0 on VC/VE. Initial glucose concentration: ~ 100 g/L (•), ~150 g/L (o)
and ~ 200 g/L (+).
If, however, the CO2 production rate is relatively small, the yeast cells will tend to settle faster in the Erlenmeyer flask than in the cylinder. In this last case, the fermentation will be more rapid in the
steady-state process, that is, the glucose and cells concentrations, as well as the CO2 production rate, the number, diameters and velocities of the ascending CO2 bubbles (whose measurement is presently unfeasible), vary from time to time. Consequently, it is very difficult (perhaps impossible) to propose theoretical correlations between the obtained kinetic results and the actual experimental conditions, since such conditions change as fermentation proceeds. Borzani et al. (1993), however, reported that the time necessary to complete the batch ethanol fermentation may be calculated by K(SO/XO)α, where K (K>1) and α
(0<α<1) depend on the experimental conditions. In other words, the above time decreases, and consequently the CO2 production rate increases, when X0/S0 increases. Based on the above fact, the ratio X0/S0was assumed as a reference parameter to discuss the experimental results, leading to several empirical and practical consequences. Fig. 6 where VC and VE are, respectively, the maxima values of dE/dt in tests carried out in the cylinder and in the Erlenmeyer flask for the same value of X0/S0, show how X0/S0 affects VC/VE. Equation [3] is also represented in Fig. 6 (r = correlation coefficient). 0 0 E C S X 425 . 1 33 . 1 V V −
= [3]
(r = - 0.882)
Calling tfC and tfE, respectively, the complete fermentation times in tests carried out in the
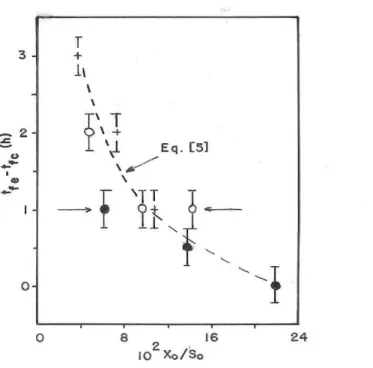
cylinder and in the Erlenmeyer flask for the same value of X0/S0, Figs. 7 and 8 show, respectively, the correlation between tfE and tfC (see Equation [4]) and the correlation between tfE - tfC and X0/S0 (see Equation [5]).
tfE =−0.62+1.335tfC [4]
(r = 0.996)
(
)
(
0 0)
0 0 f fE S / X 021 . 0 S / X 219 . 0 02 . 1 t t C + − =
− [5]
(r = 0.985)
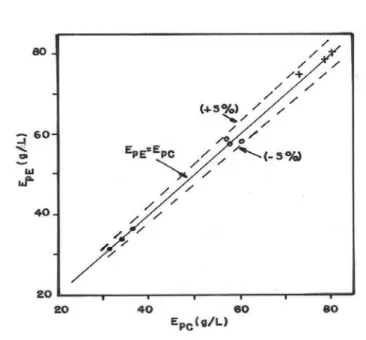
Fig. 9, where EpC and EpE are, respectively, the concentrations of produced ethanol in tests carried out in the cylinder and in the Erlenmeyer flask for the same value of S0/X0, clearly shows that the shape of the flask practically did not affect the quantity of produced ethanol. Obviously, the same conclusion was reached regarding the relative ethanol yield.
Calling PC and PE the ethanol productivities in tests carried out in the cylinder and in the Erlenmeyer flask, respectively, for the same value of S0/X0, Fig. 10 shows the correlation between
PC/PE and S0/X0 (see equation [6]).
0 0 E C S X 457 . 1 356 . 1 P P −
= [6]
Figure 7 - Correlation between tfE and tfC. Initial glucose concentration: ~100 g/L (•), ~150 g/L (o) and ~200 g/L (+).
Figure 8 - Influence of X0/S0on tfE – tfC. Initial glucose concentration: ~100 g/L (•), ~150 g/L (o)
Figure 9 - Correlation between EpE and EpC. Initial glucose concentration: ~100 g/L (•), ~150 g/L
(o) and ~200 g/L (+).
Figure 10 - Influence of X0/S0on PC / PE. Initial glucose concentration: ~100 g/L (•), ~150 g/L (o)
and ~200 g/L (+).
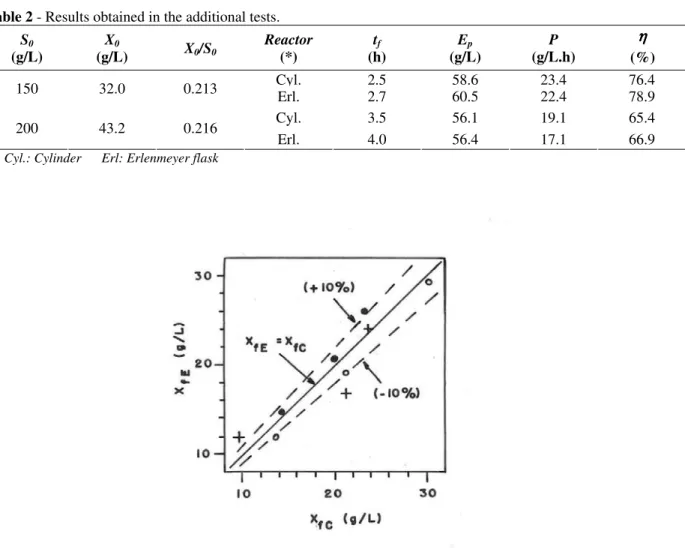
Fig. 11, where XfC and XfE are, respectively, the final yeast cells concentrations in tests carried out in the cylinder and in the Erlenmeyer flask for the same value of X0/S0, seems to indicate that there is no systematic and significant influence of the reactor shape on the yeast cells final concentrations.
Figs. 3 to 8 and 10 clearly show that the influence of the reactor shape on the kinetics of the ethanol production decreased when X0/S0 increased. In the
particular case of the tests carried out with S0≅100
g/L, the above influence disappeared when
X0/S0=0.219 (see Fig. 3).
Table 2 - Results obtained in the additional tests.
S0
(g/L)
X0
(g/L) X0/S0
Reactor (*)
tf
(h)
Ep
(g/L)
P (g/L.h)
ηηηη (%)
Cyl. 2.5 58.6 23.4 76.4
150 32.0 0.213
Erl. 2.7 60.5 22.4 78.9 Cyl. 3.5 56.1 19.1 65.4 200 43.2 0.216
Erl. 4.0 56.4 17.1 66.9
(*) Cyl.: Cylinder Erl: Erlenmeyer flask
Figure 11 - Correlation between XfE and XfC. Initial glucose concentration:~100 g/L (•), ~150 g/L (o) and ~200 g/L(+).
The average of the X0/S0 values cited above (0.219, 0.234 and 0.244) is 0.232 (standard deviation, 0.013).
Assuming X0/S0 = 0.232, Equation [5] leads to tfE
– tfC = -3.1 min, i.e., considering the uncertainties associated with the evaluations of tfE and tfC, tfE =
tfC.
We may then conclude that the reactor shape affected the ethanol production kinetics when X0/S0 was smaller than 0.22 to 0.24.
Considering that with S0 approximately equal to 150 g/L and 200 g/L the maximum values of X0/S0 were 0.143 and 0.108, respectively, two sets of additional tests were carried out with the only purpose to confirm the conclusions cited above. The results obtained in such tests (see Table 2) are in accordance with the results presented in Figs. 7 to 10.
The evolved CO2 was not measured. Otherwise, considering that the mass of produced CO2 is
practically proportional to the mass of produced ethanol, the influence of X0/S0 on the CO2 productivity would be represented by an Equation similar to Equation [6].
It seems advisable to point out that the results presented in this paper could be important mainly when the purpose is to compare kinetic parameters calculated from different batch ethanol experiments carried out in unstirred reactors. In this case, depending on the value of X0/S0, the reactor shape could significantly affect the values of the above parameters. Otherwise, the cells morphology, cells viability, quantity of the produced cells and the relative ethanol yield were pratically not affected by the reactor shape.
APPENDIX
The CO2 production rates and the velocities of the ascending CO2 bubbles were previously assumed as the causes of the obtained kinetic results (see DISCUSSION and Figs. 3 to 5). The calculation (or the measument) of the velocities of the ascending CO2 bubbles, however, is presently impossible.
Otherwise, when the calculation of the actual flow velocities is unfeasable (e.g. the flow of gases through a porous membrane and the flow of liquids through a fixed bed), the superficial velocities are usually considered as the flow parameters. The superficial velocities of the evolved CO2 were then calculated.
The above calculation was carried out considering the following values: a) volume of fermenting medium, 1L (see MATERIALS AND METHODS); b) ratio between the mass of produced CO2 and the mass of produced ethanol, 0.955 g/g; c) specific volume of the CO2 at the experimental conditions (temperature, 32°C;
atmospheric pressure, 9.33.104Pa), 617 mL/g; d) cylinder diameter,
5.9 cm; e) Erlenmeyer flask average diameter (considering only the portion containing the fermenting medium), 14.0 cm.
Equations [1-A] and [2-A] permitted to calculate the superficial velocity (measured in cm/min) of the evolved CO2 at time t (R) and the average superficial velocity of the evolved CO2 (Rav),
respectively.
dt
dE
D
5
.
12
R
=
2⋅
[1-A]f p 2 av
t
E
D
5
.
12
R
=
⋅
[2-A]The values of R were calculated at t = 0.5 h, since the produced CO2 evolves after saturating the fermenting medium. Table 1-A shows the calculated values o R at t = 0.5 h and Rav.
Table 1-A - Calculated values of the superficial velocity at t = 0.5 h (R) and of the average superficial velocity (Rav)
of the evolved CO2.
Test N°
R (at t = 0.5h) (cm/min)
Rav
(cm/min)
1 1.76 2.62
2 0.28 0.39
3 1.44 3.51
4 0.24 0.54
5 4.31 4.54
6 0.76 0.81
7 1.29 2.41
8 0.22 0.34
9 3.16 5.21
10 0.45 0.74 11 3.84 5.14 12 0.64 0.75 13 0.79 2.69 14 0.14 0.39 15 1.83 4.05 16 0.30 0.56 17 2.48 4.38 18 0.38 0.68
Figs. 3 to 5 show that only Tests N°5 (cylinder) and N°6 (Erlenmeyer flask), carried out using the same inoculated medium (see Table1), led to identical results. It is then possible to conclude that R = 0.76 cm/min (at t = 0.5 h), or Rav = 0.81
cm/min, were sufficiently high to maintain all the yeast cells suspended in the medium.
Otherwise, Table 1-A also shows that: a) all the values R (at t = 0.5 h) and all the values of Rav of
excluding Test N° 6, the values R (at t = 0.5 h) and Ravof the tests carried out in Erlenmeyer flasks are
smaller than 0.76 cm/min and 0.81 cm/min, respectively.
The above results permit to say that the assumption presented at the DISCUSSION is acceptable.
ACKNOWLEDGMENTS
The authors acknowledge the technical assistance of Douglas Dalla Justina and Renato Piplovic.
NOMENCLATURE
dE/dt ethanol production rate (g/L.h) D reactor internal diameter (cm)
E ethanol concentration (g/L)
Ep produced ethanol concentration (g/L) EpC value of Ep in test carried out in the
cylinder (g/L)
EpE value of Ep in test carried out in the Erlenmeyer flask (g/L)
H height of the medium layer (cm)
P ethanol productivity (g/L.h)
PC value of P in test carried out in the cylinder (g/L.h)
PE value of P in test carried out in the Erlenmeyer flask (g/L.h)
r correlation coefficient
R superficial velocity of the evolved CO2 (cm/min)
Rav average superficial velocity of the evolved
CO2 (cm/min)
S0 initial glucose concentration (g/L)
t time (h)
tf value of t to attain complete fermentation (h)
tfC value of tf in test carried out in the cylinder (h)
tfE value of tf in test carried out in the Erlenmeyer flask (h)
VC maximum value of dE/dt in test carried out in the cylinder (g/L.h)
VE maximum value of dE/dt in test carried out in the Erlenmeyer flask (g/L.h)
X0 initial yeast cells concentration (dry matter) (g/L)
Xf final yeast cells concentration (dry matter) (g/L)
XfC value of Xf in test carried out in the cylinder (g/L)
XfE value of Xf in test carried out in the Erlenmeyer flask (g/L)
η relative ethanol yield (%)
RESUMO
Estudou-se a influência da geometria de reatores não agitados na cinética de produção de etanol em experimentos de fermentação alcoólica realizados por processo descontínuo em escala de laboratório. Foram utilizados dois reatores: um cilindro graduado de 1 L e um frasco de Erlenmeyer de 2 L. Cada reator operou com 1000 mL de meio inoculado. A influência da geometria do reator foi afetada pela relação entre a concentração inicial de levedura (X0: ∼7 g/L, ∼14 g/L, e ∼21 g/L, matéria seca) e a concentração inicial de glicose (S0: ∼100 g/L, ∼150 g/L e ∼200 g/L). A influência da geometria do reator diminuiu quando X0/S0 aumentou de 0,038 a 0,219, tornando-se nula para X0/S0 = 0,22 a 0,24. A geometria do reator praticamente não afetou tanto o rendimento em etanol e a concentração final de levedura quanto a viabilidade e a morfologia das células em experimentos com o mesmo valor de X0/S0.
REFERENCES
Bailey, J. A. and Ollis, D. F. (1986), Biochemical Engineering Fundamentals. New York: McGraw-Hill Book Company.
Borzani, W.; Gerab, A.; Higuera, G. A. D. L.; Pires, M. H. and Piplovic, R. (1993), Batch ethanol fermentation of molasses:a correlation between the time necessary to complete the fermentation and the initial concentrations of sugar and yeast cells. World J. Microbiol. Biotechnol., 9, 265-268.
Borzani, W.; Gregori, R. E. and Vairo, M. L. R. (1977), Some observations on oscillatory changes in the growth rate of Saccharomyces cerevisiae in aerobic continuous undisturbed culture. Biotechnol. Bioeng.,
19, 1363-1374.
Gómez, E. I. V.; Vairo, M. L. R. and Borzani, W. (1981), Influência da geometria do fermentador no andamento de fermentações alcoólicas. Arq. Biol. Tecnol., 24, 361-366.
Miller, G. L. (1959), Use of dinitrosalicylic acid for determination of reducing sugars. Anal. Chem., 31, 426-428.
Sinclair, C. G. and Cantero, D. (1990), Fermentation modeling. In: McNeil, B. and Harvey, L. M. (Eds.).
Fermentation: a pratical approach. Oxford: IRL Press.
Sung, S. and Dague, R. R. (1995), Laboratory studies on anaerobic sequencing batch reactor. Water Environ. Res., 67, 294-301.
Vairo, M. L. R. (1961). Methylene blue solutions for staining dead yeast cells. Stain Technol., 36, 329-330.