Inês Filipa da Mota Costa
Licenciada em Ciências da Engenharia Civil
Sorption properties of biobased and raw earth
materials: investigation of temperature and dry mass
measurements
Dissertação para obtenção do Grau de Mestre em Engenharia Civil
Orientador: Antonin Fabbri, Researcher, École Nationale des Travaux Publics
de l’État
Co-orientador: Paulina Faria, Professora Associada, Faculdade de Ciências e
Tecnologia da Universidade Nova de Lisboa
Júri:
Presidente: Professora Doutora Zuzana Dimitrovová Arguente: Professor Doutor Daniel Aelenei
Vogal: Doutor Antonin Fabbri
Sorption properties of biobased and raw earth materials: investigation of
temperature and dry mass measurements
Copyright © Inês Filipa da Mota Costa, Faculdade de Ciências e Tecnologia,
Universidade Nova de Lisboa.
I
Acknowledgements
First of all, the person to whom I owe the sincerest thanks is Professor Paulina Faria, for having given me the opportunity to develop my dissertation in a French university and for trusting my abilities to do so, and to represent FCT. I would also like to thank for all the support and advices given during this period and during the time I was attending her classes.
I would also like to thank my supervisor doctor Antonin Fabbri and also to doctor Fionn McGregor, who received me for an internship in the university lab. Their help was essential for this experience to be possible. I want to thank for all the theoretical and practical support and for all the amazing experience I have been through. I also want to thank the help and the friendliness given by the university staff, and the financial support I received from ENTPE.
During this adventure, I had the opportunity to meet and work with many people from different countries, who became great friends. They accompanied me and motivated me throughout this experience away from home. I want to thank some of my friends, whom I met in ENTPE for the help in the lab, and to my roommates for the warming welcome every day.
My friends from Portugal and fellow scouts have always accompanied me on this journey and motivated me during all the good and bad moments. I owe them a big thanks. Equally important, my friends from FCT were very important members along my journey through all the course, in which I made great friends.
I also want to thank my good friend Sara Jerónimo, who accompanied me throughout the adventure in Lyon, and who willingly helped me through the difficulties in the lab and through study and project times.
III
Abstract
Relative humidity influence strongly the indoor air quality and human comfort. Therefore, the hygrothermal behaviour of building materials is an important parameter and there has been a growing interest in studying passive solutions to regulate the indoor relative humidity. Since earth materials have the ability to absorb and release water vapour, they can be used to moderate the amplitude of indoor relative humidity and therefore to improve the indoor air quality and consequently save energy.
Many researchers have been focussed on studying the hygrothermal properties of earth building materials, but it is still a scientific challenge tocharacterize precisely the hygrothermal coupling of those materials.
This dissertation focuses on two main objectives, developed and studied in three different porous materials: compacted earth, earth plaster and hemp concrete.The first one is to analyse the effectiveness and the influence of three different drying-methods (oven-drying at 60°C, oven-drying at 105°C and vacuum-drying), and recommend one standard method, for each material studied, since there is no clear guidance to determine the correct dry mass of biobased and earth materials. Complementary to the first objective, it is evaluated the impact of drying/wetting cycles using the same three drying-methods. The second objective is to study the evolution of sorption curves with temperature, for biobased and raw-earth materials.
The analysis of the results showed that the first drying process affects the moisture uptake of all the studied materials, from there forward. Oven-drying at 60ºC and vacuum-drying are the methods that produce less impact in the porous network. More specifically, vacuum-drying is the method that allows less impact in the first drying of compacted earth and hemp concrete, and both, vacuum-drying and oven-drying at 60°C,
are suitable for a non-impact drying of earth plaster. However, they are not completely efficient in drying earth materials since hysteresis is observed in drying/wetting cycles. Using oven-drying at 105°C it is not
observed hysteresis and therefore, this is the most effective method, but it is the method that most presents impact in the porous network after the first drying.
Analysing the influence of temperature on the absorption curves, the results show that temperature cycles have no relevant impact on the hygrothermal behaviour of earth materials. Comparing the sorption curves of the three materials plotted at the same temperature,the influence of temperature is more relevant than the materials itself for compacted earth and earth plaster. The same cannot be stated for the hemp concrete.
V
Resumo
A humidade relativa influencia fortemente a qualidade do ar interior e o conforto humano. Assim sendo, o comportamento higrotérmico é um parâmetro importante e o interesse em estudar soluções passivas para regular a humidade relativa interna tem crescido. Uma vez que os materiais de terra têm a capacidade de absorver e libertar vapor de água, estes podem ser usados para moderar a amplitude da humidade relativa interna e, portanto, melhorar a qualidade do ar interno e consequentemente economizar energia.
A comunidade científica tem se concentrado no estudo das propriedades higrotérmicas dos materiais de construção de terra, mas ainda é um desafio caracterizar o comportamento higrotérmico desses materiais.
Esta dissertação foca-se em dois objetivos diferentes, desenvolvidos e estudados em três materiais porosos diferentes: terra compactada, argamassa de terra e betão de cânhamo. Sendo que não existe nenhuma orientação clara para determinar a correta massa seca de materiais de terra. O primeiro objetivo é analisar a eficácia, a confiabilidade e a influência de três métodos diferentes de secagem (secagem em estufa a 60°C, secagem em estufa a 105°C e secagem usando vácuo) e recomendar um método padrão que possa ser usado como método standard para cada material estudado. Complementariamente ao primeiro objetivo é avaliado o impacto de ciclos de secagem/molhagem usando os mesmos três métodos de secagem. O segundo objetivo é estudar a evolução das curvas de adsorção com a temperatura.
A análise dos resultados mostrou que a primeira secagem, em todos os materiais de terra estudados, afeta o seu comportamento higrotérmico daí para frente, e que o método de secagem em estufa a 60ºC e a secagem usando vácuo são os métodos que menor impacto produzem na rede porosa. Mais especificamente, a secagem usando vácuo é o método que permite menor impacto na primeira secagem de terra compactada e betão de cânhamo. Ambos os métodos, secagem a vácuo e secagem no forno a 60°C, são adequados para secagem de argamassa de terra. No entanto, eles não são completamente eficientes na secagem de materiais de terra, pois é observada histerese nos ciclos de secagem/molhagem. Utilizando a secagem em estufa a 105ºC não é observada histerese e, portanto, é o método mais eficaz, mas é observado que é o método que mais afeta a porosidade do material.
Analisando a influência da temperatura nas curvas de absorção, os resultados mostram que os ciclos de temperatura não têm impacto relevante no comportamento higrotérmico dos materiais de terra. Comparando as curvas de absorção dos três materiais determinadas à mesma temperatura, a influência da temperatura é mais relevante do que os próprios materiais para terra compactada e argamassa de terra. Relativamente ao betão de cânhamo, não se pode afirmar o mesmo.
VII
Notations and symbols
Roman-letter notations:
A Exposed surface area (m2)
d Thickness (m)
е Voids Index (-)
EMC Equilibrium moisture content (%)
g Gravity acceleration (m/s²)
gv Water vapour diffusion flux density (kg/(m2s))
MBV Moisture buffering value (g/(m2 .%RH))
m Mass of wet material (g)
m0 Mass of dry material (g)
Mw Molar mass of water (kg/mol)
ρc Capillary pressure (Pa)
Pv Water vapour partial pressure (Pa)
Pv,sat Saturation water vapour pressure (Pa)
Δp Capillary pressure gradient (Pa)
Δpv Water vapour pressure gradient (Pa)
R Perfect gas constant (J/kg mol)
Rv Gas constant for water vapour (J/kg mol)
RH Relative humidity (%)
r Pore radius (m)
S Sorptivity (m/√𝑠 )
Sr Saturation degree (-)
T Temperature (K)
t Time (s)
𝑡𝑠 Dew point temperature (°C)
u Water content (kg/kg) (is also used w (%))
𝑊𝑤 Weight of the water (kg)
𝑊𝑠 Weight of the solid particles (kg)
w
x
Water content (%) (is also used u (kg/kg))
Distance of the humid front (m)
VIII
Greek-letter notation:
δa Water vapour permeability of air (kg/ (m.s.Pa ))
δp Water vapour permeability within the material (kg/ (m.s.Pa))
θ Wetting contact angle (°)
λ Thermal conductivity (W/ (m °C))
µ Water vapour resistance factor of a dry material (-)
𝜇𝑤 Water viscosity (Pa.s)
ν Water vapour concentration (kg/m3)
ν𝑠 Saturation limit (kg/ m3)
ξ Specific hygroscopic capacity (kg/kg/RH)
σ Surface tension of water (N/m)
𝜌 Liquid density (kg/m3)
ρw Water density (kg/m3)
ɸ Porosity (-)
ɸ𝐿 Porosity filled by liquid (-)
ɸ𝐺 Porosity filled by gas (-)
Ω Total volume of the material (m3)
Ω𝐿 Volume of the liquid (m3)
Ω𝑣 Volume of voids (m3)
Ω𝐺 Volume of the gas (m3)
IX
Contents
Acknowledgements ... I Abstract ... III Resumo ... V Notations and symbols ... VII Contents ... IX List of Figures ... XI List of Tables ... XIII
1. Introduction ... 1
1.1 Context ... 1
1.2 Objective and methodology ... 2
1.3 Dissertation structure ... 3
2. Hygrothermal behaviour of clay-based and biobased materials ... 5
2.1 Porous materials ... 5
2.1.1 Phases characteristics ... 5
2.1.1.1 Volumetric features ... 5
2.1.1.2 Gavimetric features ... 6
2.1.2 Type of pores ... 6
2.1.3 Clay based porous material... 7
2.1.4 Biobased porous material ... 9
Hemp shives characteristics... 9
Hemp concrete ... 10
2.2 Moisture transport ... 11
2.2.1 Water vapour diffusion ... 12
2.2.2 Liquid water transport ... 13
2.3 Moisture storage ... 15
2.4 Moisture buffering ... 19
3. Materials and methods ... 23
3.1 Initial remarks ... 23
3.2 Materials ... 23
3.2.1 Compacted earth ... 24
3.2.2 Earth plaster ... 25
3.2.3 Hemp concrete ... 25
3.3 Experimental methods ... 26
3.3.1 Methods used to study the drying methods ... 26
Drying methods ... 26
Sorption isotherms ... 28
X
3.3.2 Methods used to estimate the impact of temperature ... 32
4. Effect of drying method (and cycles) ... 35
4.1 Initial remarks ... 35
4.2 Sorption isotherms before and after drying ... 35
4.3 Cycles of drying and wetting ... 37
4.4 Moisture buffer value ... 41
4.5 Discussion ... 47
5. Effect of the temperature on the sorptions curves ... 49
5.1 Initial remarks ... 49
5.2 Sorption isotherms at different temperatures ... 49
5.3 Discussion ... 53
6. Conclusion ... 55
6.1 Summary ... 55
6.2 Future work ... 56
XI
List of Figures
Figure 2.1- Porous material as a three-phase system – based on Fredlund & Rahardjo (1993). ... 5
Figure 2.2- Schematic cross-section of a porous network - adapted from Rouquerol et al. (1994). ... 7
Figure 2.3- mechanism of permeability reduction caused by clays porous media. (a) Migration (non-swelling effect): changing ionic conditions cause the detachment of clays from pore walls and result in pore blockage. (b) Swelling: changing ionic conditions cause swelling of clays, lining the pore walls and reduce the cross-sectional area for flow (Mohan et al., 1993) ... 7
Figure 2.4- Examples of morphology of crystals of clay species: a) montmorillonite, b) kaolinite and c) illite (Meunier, 2005). ... 8
Figure 2.5- Clay minerals structures: kaolinite layers (1:1 structure) and Montmorillonite layers (2:1 structure), (Meunier, 2005). ... 8
Figure 2.6- Ionic layer: arrangement between the clay particle and water molecules – adapted from Antão (2010). ... 9
Figure 2.7- Microtomography of clay particle (open source)... 9
Figure 2.8- hemp shives (a) and microtomography of hemp shives (b). Figure (b) from open source. ... 10
Figure 2.9- Microtomography of hemp concrete (Dubois et al., 2014) ... 11
Figure 2.10- Capillary suction within a pore – based on Henriques (2007) ... 14
Figure 2.11- Adsorption domains and molecular saturation states - adapted from Hall & Allison (2009) and Henriques (2007) ... 15
Figure 2.12- Types of sorption isotherms (Sing et al., 1985) ... 16
Figure 2.13- psychometric diagram (open source). ... 17
Figure 2.14- Examples of hysteresis of two different materials: Materials with mineral binders (a) and materials like rocks (b) – adapted from Henriques (2007). ... 18
Figure 2.15- Contact angles in adding/removing volume method (Zhou, 2013). ... 18
Figure 2.16- Predicted scanning curves when k is set to a constant (Zhou, 2013). ... 19
Figure 2.17- Moisture buffer phenomena in the indoor environment, divided into three descriptive levels: room level, system level and material level – adapted from Rode et al. (2005) ... 20
Figure 3.1- Example of samples used in sorption isotherm test - Earth plaster on the left, hemp concrete in the middle and compacted earth on the right. ... 23
Figure 3.2- Example of samples used in MBV test - Earth plaster on the left (with two thicknesses:2cm and 4cm), hemp concrete on the superior right corner and compacted earth on the inferior right corner. ... 24
Figure 3.3- Temperature and RH inside the oven (60°C), with silica-gel. ... 27
Figure 3.4- Temperature and RH inside the vacuum system, with silica-gel. ... 27
Figure 3.5- Elements of the vacuum system. ... 28
Figure 3.6- Samples placed in a salt solution box for the sorption isotherms test. ... 29
Figure 3.7- Experimental steps used to study the effect of drying methods (and cycles) ... 29
Figure 3.8- DVS equipment (Intrinsic 2, SMS®) ... 30
Figure 3.9- Practical Moisture Buffer Value categories (Rode et al., 2005) ... 31
Figure 3.10- RH measured experimentally in MBV cycle. ... 31
Figure 3.11- Temperature measured experimentally in MBV cycle. ... 32
Figure 3.12- Experimental steps used to study the effect of drying methods (and cycles) using the MBV. ... 32
Figure 3.13- Experimental steps used to study the effect of the temperature on the sorption isotherms. ... 32
Figure 4.1- Sorption isotherms at 23°C before and after drying for compacted earth, using oven-drying method at 60°C (a), oven-drying method at 105°C (b) and vacuum-drying method (c). ... 36
XII
Figure 4.3- Sorption isotherms at 23°C before and after drying for hemp concrete, using oven-drying
method at 60°C (a), oven-drying method at 105°C (b) and vacuum-drying method (c). ... 37
Figure 4.4- Water content in dry mass and wet mass during the drying/wetting cycles, using oven-drying method at 60°C, oven-drying method at 105°C and the vacuum-drying method in compacted earth samples placed at 75%RH. ... 38
Figure 4.5- Water content in dry mass and wet mass during the drying/wetting cycles, using oven-drying method at 60°C, oven-drying method at 105°C and the vacuum-drying method in earth plaster samples placed at 75%RH. ... 38
Figure 4.6- Water content in dry mass and wet mass during the drying/wetting cycles, using oven-drying method at 60°C, oven-drying method at 105°C and the vacuum-drying method in hemp concrete samples placed at 75%RH. ... 38
Figure 4.7- dry mass (a) and wet mass (b)in each cycle for compacted earth samples, using oven-drying method at 60°C (1), oven-drying method at 105°C (2) and the vacuum-drying (3). ... 39
Figure 4.8- dry mass (a) and wet mass (b)in each cycle for earth plaster samples, using oven-drying method at 60°C (1), oven-drying method at 105°C (2) and the vacuum-drying (3). ... 40
Figure 4.9- dry mass (a) and wet mass (b)in each cycle for hemp concrete samples, using oven-drying method at 60°C (1), oven-drying method at 105°C (2) and the vacuum-drying (3). ... 41
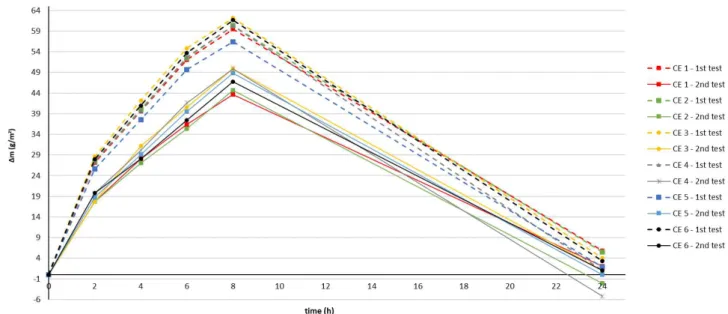
Figure 4.10- MBV test for compacted earth samples. ... 42
Figure 4.11- MBV test for earth plaster samples... 43
Figure 4.12- MBV test for hemp concrete samples. ... 43
Figure 4.13- MBV test before (1st test) and after (2nd test) the drying cycles, for compacted earth samples. ... 44
Figure 4.14- MBV test for earth plaster samples, with 2cm of thickness. ... 44
Figure 4.15- MBV test for earth plaster samples, with 4cm of thickness. ... 45
Figure 4.16- MBV test for hemp concrete samples. ... 46
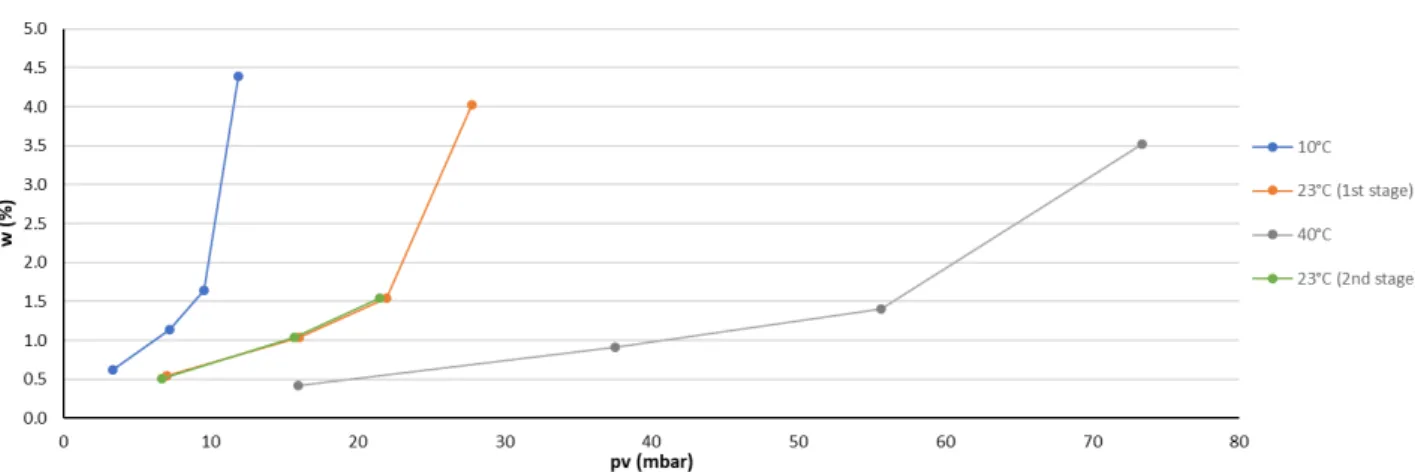
Figure 5.1- Sorption isotherms at each temperature step, for compacted earth, ... 50
Figure 5.2- Sorption isotherms at each temperature step, for earth plaster. ... 50
Figure 5.3- Sorption isotherms at each temperature step, for hemp concrete. ... 50
Figure 5.4- Average of water content in the temperatures steps, for compacted earth. Each bar represents the average of three equal samples placed in the same RH. The value corresponding to the error bar represents the difference between the maximum and the minimum water content value of the three samples. ... 51
Figure 5.5- Average of water content in the temperatures steps, for earth plaster. Each bar represents the average of three equal samples placed in the same RH. The value corresponding to the error bar represents the difference between the maximum and the minimum water content value of the three samples. ... 52
Figure 5.6- Average of water content for the temperatures steps, for hemp concrete. Each bar represents the average of three equal samples placed in the same RH. The value corresponding to the error bar represents the difference between the maximum and the minimum water content value of the three samples. ... 52
Figure 5.7- Sorption isotherms given by compacted earth (green), earth plaster (blue) and hemp concrete (orange), resulting from different temperatures. ... 53
XIII
List of Tables
Table 3.1- Samples dimensions used in the sorptions isotherms and MBV tests. ... 24
Table 3.2- Properties of compacted earth samples ... 24
Table 3.3- Formulation of earth plaster (F0) ... 25
Table 3.4- Mixtures proportions of hemp concrete, wet density and curing conditions ... 26
Table 3.5- Salt solutions subastances for each RH at 23°C... 29
Table 4.1- Percentage of water content between sorption curves before and after drying. ... 35
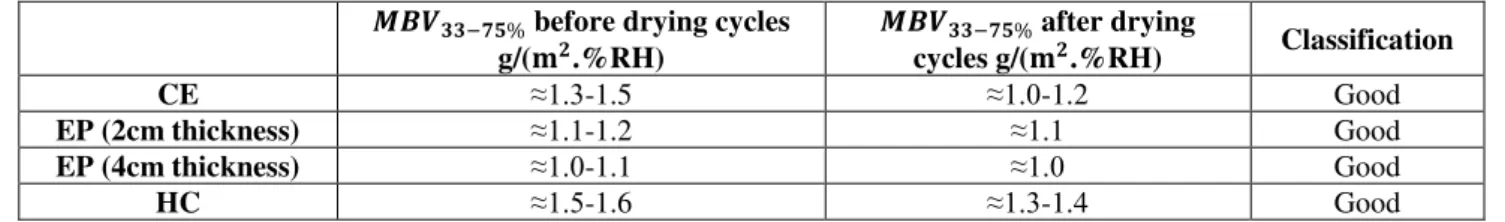
Table 4.2- Difference in moisture uptake per square meter obtained through the MBV test, before and after the drying cycles, using each drying cycle, for compacted earth samples. ... 44
Table 4.3- Difference in moisture uptake per square meter obtained through the MBV test, before and after the drying cycles, using each drying cycle, for earth plaster samples, with 2cm thickness. ... 45
Table 4.4- Difference in moisture uptake per square meter obtained through the MBV test, before and after the drying cycles, using each drying cycle, for earth plaster samples with 4cm of thickness. ... 45
Table 4.5- Difference in moisture uptake per square meter obtained through the MBV test, before and after the drying cycles, using each drying cycle, for hemp concrete samples. ... 46
Table 4.6- Moisture Buffer Value classification for compacted earth, earth plaster with 2 and 4cm of thickness and hemp concrete. ... 46
Table 4.7- Difference in moisture uptake after the drying/wetting cycles, for all the materials, depending on the dry methods used. ... 48
Table A.1- Water content in sorption isotherms, before and after the first drying, for compacted earth. ... A1 Table A.2- Water content in sorption isotherms, before and after the first drying, for earth plaster. ... A1 Table A.3- Water content in sorption isotherms, before and after the first drying, for hemp concrete. ... A2 Table A.4- Water content during the drying/wetting cycles at 23%RH, using oven-drying at 60°C, for
compacted earth. ... A3 Table A.5- Water content during the drying/wetting cycles at 53%RH, using oven-drying at 60°C, for
compacted earth. ... A3 Table A.6- Water content during the drying/wetting cycles at 75%RH, using oven-drying at 60°C, for
compacted earth. ... A4 Table A.7- Water content during the drying/wetting cycles at 75%RH (repeatability), using oven-drying
at 60°C, for compacted earth. ... A4 Table A.8- Water content during the drying/wetting cycles at 97%RH, using oven-drying at 60°C, for
compacted earth. ... A5 Table A.9- Water content during the drying/wetting cycles at 23%RH, using oven-drying at 105°C, for
compacted earth. ... A5 Table A.10- Water content during the drying/wetting cycles at 53%RH, using oven-drying at 105°C,
for compacted earth. ... A6 Table A.11- Water content during the drying/wetting cycles at 75%RH, using oven-drying at 105°C,
for compacted earth. ... A6 Table A.12- Water content during the drying/wetting cycles at 75%RH (repeatability), using
oven-drying at 105°C, for compacted earth. ... A7 Table A.13- Water content during the drying/wetting cycles at 97%RH, using oven-drying at 105°C,
for compacted earth ... A7 Table A.14- Water content during the drying/wetting cycles at 23%RH, using vacuum-drying, for
compacted earth. ... A8 Table A.15- Water content during the drying/wetting cycles at 53%RH, using vacuum-drying, for
compacted earth ... A8 Table A.16- Water content during the drying/wetting cycles at 75%RH, using vacuum-drying, for
XIV
Table A.17- Water content during the drying/wetting cycles at 75%RH (repeatability), using vacuum-drying, for compacted earth... A9 Table A.18- Water content during the drying/wetting cycles at 97%RH, using vacuum-drying, for
compacted earth ... A10 Table A.19- Water content during the drying/wetting cycles at 23%RH, using oven-drying at 60°C, for
earth plaster ... A10 Table A.20- Water content during the drying/wetting cycles at 53%RH, using oven-drying at 60°C, for
earth plaster ... A11 Table A.21- Water content during the drying/wetting cycles at 75%RH, using oven-drying at 60°C, for
earth plaster ... A11 Table A.22- Water content during the drying/wetting cycles at 75%RH (repeatability), using
oven-drying at 60°C, for earth plaster ... A12 Table A.23- Water content during the drying/wetting cycles at 97%RH, using oven-drying at 60°C, for
earth plaster ... A12 Table A.24- Water content during the drying/wetting cycles at 23%RH, using oven-drying at 105°C,
for earth plaster ... A13 Table A.25- Water content during the drying/wetting cycles at 53%RH, using oven-drying at 105°C,
for earth plaster ... A13 Table A.26- Water content during the drying/wetting cycles at 75%RH, using oven-drying at 105°C,
for earth plaster ... A14 Table A.27- Water content during the drying/wetting cycles at 75%RH (repeatability), using
oven-drying at 105°C, for earth plaster. ... A14 Table A.28- Water content during the drying/wetting cycles at 97%RH, using oven-drying at 105°C,
for earth plaster ... A15 Table A.29- Water content during the drying/wetting cycles at 23%RH, using vacuum-drying, for earth
plaster ... A15 Table A.30- Water content during the drying/wetting cycles at 53%RH, using vacuum-drying, for earth
plaster ... A16 Table A.31- Water content during the drying/wetting cycles at 75%RH, using vacuum-drying, for earth
plaster. ... A16 Table A.32- Water content during the drying/wetting cycles at 75%RH (repeatability), using
vacuum-drying, for earth plaster ... A17 Table A.33- Water content during the drying/wetting cycles at 97%RH, using vacuum-drying, for earth
plaster ... A17 Table A.34- Water content during the drying/wetting cycles at 23%RH, using oven-drying at 60°C, for
hemp concrete. ... A18 Table A.35- Water content during the drying/wetting cycles at 53%RH, using oven-drying at 60°C, for
hemp concrete ... A18 Table A.36- Water content during the drying/wetting cycles at 75%RH, using oven-drying at 60°C, for
hemp concrete ... A19 Table A.37- Water content during the drying/wetting cycles at 75%RH (repeatability), using
oven-drying at 60°C, for hemp concrete ... A19 Table A.38- Water content during the drying/wetting cycles at 97%RH, using oven-drying at 60°C, for
hemp concrete. ... A20 Table A.39- Water content during the drying/wetting cycles at 23%RH, using oven-drying at 105°C,
for hemp concrete. ... A20 Table A.40- Water content during the drying/wetting cycles at 53%RH, using oven-drying at 105°C,
for hemp concrete ... A21 Table A.41- Water content during the drying/wetting cycles at 75%RH, using oven-drying at 105°C,
for hemp concrete. ... A21 Table A.42- Water content during the drying/wetting cycles at 75%RH (repeatability), using
oven-drying at 105°C, for hemp concrete. ... A22 Table A.43- Water content during the drying/wetting cycles at 97%RH, using oven-drying at 105°C,
for hemp concrete ... A22 Table A.44- Water content during the drying/wetting cycles at 23%RH, using vacuum-drying, for hemp
XV Table A.45- Water content during the drying/wetting cycles at 53%RH, using vacuum-drying, for hemp
concrete ... A23 Table A.46- Water content during the drying/wetting cycles at 75%RH, using vacuum-drying, for hemp
concrete ... A24 Table A.47- Water content during the drying/wetting cycles at 75%RH (repeatability), using
vacuum-drying, for hemp concrete ... A24 Table A.48- Water content during the drying/wetting cycles at 97%RH, using vacuum-drying, for hemp
concrete ... A25 Table A.49- Difference in water content during the drying/wetting cycles, using oven-drying at 60°C,
for compacted earth ... A26 Table A.50- Difference in water content during the drying/wetting cycles, using oven-drying at 105°C,
for compacted earth ... A26 Table A.51- Difference in water content during the drying/wetting cycles, using vacuum-drying, for
compacted earth ... A27 Table A.52- Difference in water content during the drying/wetting cycles, using oven-drying at 60°C,
for earth plaster ... A27 Table A.53- Difference in water content during the drying/wetting cycles, using oven-drying at 105°C,
for earth plaster ... A28 Table A.54- Difference in water content during the drying/wetting cycles, using vacuum-drying, for
earth plaster ... A28 Table A.55- Difference in water content during the drying/wetting cycles, using oven-drying at 60°C,
for hemp concrete. ... A29 Table A.56- Difference in water content during the drying/wetting cycles, using oven-drying at 105°C,
for hemp concrete ... A29 Table A.57- Difference in water content during the drying/wetting cycles, using vacuum-drying, for
hemp concrete ... A30 Table A.58- Difference in moisture uptake per square meter, before and after the drying cycles, using
oven-drying at 60°C, for compacted earth. ... A32 Table A.59- Difference in moisture uptake per square meter, before and after the drying cycles, using
oven-drying at 105°C, for compacted earth. ... A32 Table A.60- Difference in moisture uptake per square meter, before and after the drying cycles, using
vacuum-drying, for compacted earth ... A32 Table A.61- Difference in moisture uptake per square meter, before and after the drying cycles, using
oven-drying at 60°C, for earth plaster. ... A33 Table A.62- Difference in moisture uptake per square meter, before and after the drying cycles, using
oven-drying at 105°C, for earth plaster. ... A33 .Table A.63- Difference in moisture uptake per square meter, before and after the drying cycles, using
vacuum-drying, for earth plaste... A33 Table A.64- Difference in moisture uptake per square meter, before and after the drying cycles, using
oven-drying at 60°C, for hemp concrete ... A34 Table A.65- Difference in moisture uptake per square meter, before and after the drying cycles, using
oven-drying at 105°C, for hemp concrete ... A34 Table A.66- Difference in moisture uptake per square meter, before and after the drying cycles, using
vacuum-drying, for hemp concrete. ... A34 Table A.67- Difference in Moisture Buffering Value resulting from drying cycles, for compacted
earth..A34
Table A.68- Difference in Moisture Buffering Value resulting from drying cycles, for earth plaster ... A35 Table A.69- Difference in Moisture Buffering Value resulting from drying cycles, for hemp concrete .. A35 Table A.70- Water content and water vapour partial pressure in sorption isotherms, at different
temperatures, for compacted earth ... A36 Table A.71- Water content and water vapour partial pressure in sorption isotherms, at different
temperatures, for earth plaster ... A36 Table A.72- Water content and water vapour partial pressure in sorption isotherms, at different
temperatures, for hemp concrete. ... A37 Table A.73- Water content in each temperature step, at different relative humidities, using estimated
XVI
Table A.74- Water content in each temperature step, at different relative humidities, using estimated water content from the samples dried in vacuum, for earth plaster ... A39 Table A.75- Water content in each temperature step, at different relative humidities, using estimated
1
1.
Introduction
1.1
Context
A variety of building materials, based on organic and natural materials have being studied in the last decades. Organic materials may consist of plant, such as hemp, cob, straw or corn pith, or animal wastes, such as hair or fur. Natural materials came directly from nature, such as clay, silt, sand or wood.
New materials, mainly synthetic materials, and new building methods were created in the industrial revolution. These changes, in the way that buildings were constructed, leads to a loss of concern about the transfer of heat between the exterior and interior, thermal properties of the materials and the architecture of the buildings. The passive methods, to control climatic conditions and improve indoor comfort, were discarded in much of modern architecture, and mechanized methods were adopted (Mahdavi & Kumar, 1996), although it leads to an increase of the energy consumption of the buildings. Besides the passive methods, the mechanic ones, such as the air conditioning, depend on human intervention and are not a sustainable option(Woloszyn et al., 2009).
The appearance of new building materials, such as cement and cement composites like concrete, has created a sociological impact on construction industry. With these new materials and techniques, old techniques such as the application coatings with fake works, decorative coatings based in lime and gypsum, were lost during the last century and mainly in the last decades. Therefore, construction masters of these old techniques stopped practicing it and passing it on to the younger generations. (Fabbri, 2017)
Materials with less impact on the environment and more efficient, from a thermal point of view, have been studied in order to reduce the environmental impact of buildings. In addition to these environmental concerns, indoor air quality and occupant comfort are also becoming essential parameters. The nature of the materials is therefore very important since they might control the temperature and the humidity through their properties. Nowadays, earth building materials are known for regulating humidity and therefore are widely prescribed (McGregor et al., 2016). Big advantages, such as the existence in large quantities of these materials, the low energy to extract, transform and produce them and the fact that these materials can be totally recyclable (when they are not stabilised), make them very interesting materials to be studied. These materials have other advantages, such as the high thermal inertia and the strong hygroscopic properties (Karlsson et al., 2013).
Indoor air quality is affected by the transfers of moisture between air and earthen walls in three different ways. Firstly, the relative humidity inside the building can be regulated by the earthen walls. Secondly, the transfers of moisture create damping of humidity and this variation in buildings helps to increase indoor comfort. Third, according to the people living in earthen buildings, evaporation of the water contained within the earthen walls has a cooling effect in hot weather, so earth walls become natural air conditioners (Cagnon et al., 2014).
The affinity to water in clay materials is usually known as detrimental, but this hygrothermal coupling phenomenon are still under investigation. The moisture buffering capacity is being studied in a variety of building materials sincethey represent a great potential to regulate indoor humidity.
2
In the indoor environment, the levels of RH fluctuate due to internal moisture loads. Earth materials adsorb the excess of moisture and release it during low moisture periods. Therefore, these materials are known as passive buffering materials (McGregor et al., 2016). Some researchers have shown that of all common building materials the earth is the one with the highest moisture buffering capacity. Its advantages can be improved by adding fibres. The addition of fibres increases the compressive strength, reduces shrinkage cracks and improves thermal insulation properties (Galán-Marín et al., 2010). Besides those advantages, the fibres influence the equilibrium moisture content and the dynamic moisture buffering properties. However, the influence of fibre types and the relevance of this influence have not yet been fully studied. Some studies are being conducted to determine how the composite properties of earth materialscan be affected by the addition of vegetable materials, the nature of soil composition and the manufacturing process (Palumbo et al., 2016).
The RH inside the buildings is linked with the indoor air quality and therefore, moisture buffering could be beneficial for the health and the comfort of the occupants. Moisture buffering capacity of a material is the ability to moderate variations in the relative humidity of its surrounding environment. High indoor air relative humidity causes discomfort and leads to propagation of biotic hazards, such as moulds and dust mites, which indicate low indoor air quality. Low air relative humidity causes dryness of the mucous in the respiratory tracts and discomfort (Ridley et al., 2006). The control of moisture has positive effects on indoor air quality and can reduce the ventilation rate and thus, the heat loss due to air renovation (Osanyintola & Simonson, 2006).
Some errors are committed when the mass flow inside the material is simplified. A new module (Humi-mur) was created and validated. This module has the ability to make a precise representation of the sorption isotherm and vapour permeability dependence on relative humidity. It has been proved by many researchers (Mukhopadhyaya, 2002; Salonvaara et al., 2001) that vapour permeability and sorption isotherm are the two most important hygric properties of materials, since they have significant influence on the hygrothermal behaviour of building materials (Kwiatkowski et al., 2009).
The Moisture Buffering Value (MBV) indicates the amount of water vapour that is transported in or out of a material, during a certain period of time, after a controlled variation of relative humidity on one face of a sample. Other properties that play a role in moist are the water vapour permeability, the thermal conductivity and the diffusivity. These properties have influence on the risk of interstitial condensations, which results in health problems and causes damages on the building structure (Ridley et al., 2006).
In conclusion, buildings with earth components are a good solution compared to modern building materials in sociological, economic and ecological terms. However, is difficult to understand and to predict their long-term performance, which represents an obstacle to increase its use. Important variations of indoor and outdoor relative humidity occur inside the buildings. The earthen walls have to face these variations, which induce gradients in their water content. The water inside the wall is a rather important feature, since it confers a cohesion of the material (Champiré et al., 2016), it gave the ability to buffer temperature variations through liquid/vapour phase change phenomena and leads to variations of the apparent thermal inertia of the wall (Morel et al., 2001).
1.2
Objective and methodology
This dissertation focuses on two different objectives. In the first objective, the influence of three different drying methods in porous hygroscopic materials are analysed.
3 Sorption isotherms and Moisture Buffer Value test were determined, before and after the first drying process, to assess the impact of the different drying methods. To analyse the impact of the cycles, the same three drying methods were used to achieve the dry mass and to evaluate the evolutions of the dry and wet mass at each cycle.
The second objective is to study the influence of the temperature on the sorption isotherms in the same porous materials, taking them to different steps of temperatures. In this objective, the drying methods are not a subject of study, but since the materials were only dried after the temperature cycles, the dry mass for each material were estimated, using the dry mass reached through vacuum-drying. These estimations were made in order to analyse the results, given by different materials, without dependence on the drying method used.
1.3
Dissertation structure
A literature review on hygroscopic characteristics and hygrothermal behaviour of clay-based and biobased materials is presented in Chapter 2. Porous materials are known for their capacity to adsorb and release moisture, and therefore, to understand the moisture buffering behaviour, the porous materials properties are described in this chapter.
Biobased and raw-earth materials were studied in this dissertation. The biobased materials are earth plaster and hemp concrete and the raw-earth is compacted earth. Chapter 3 describes the composition of each material and samples dimensions. The experimental procedures to determine the dry mass, the sorption isotherms, the drying/wetting cycles and the moisture buffering value are also presented in this chapter.
5
2.
Hygrothermal behaviour of clay-based and biobased materials
2.1
Porous materials
2.1.1
Phases characteristics
The existence of voids in the materials make them porous materials. It is possible to obtain three different states. If there is no presence of water in the voids it is called the dry state, otherwise, if all the voids are filled with water it is named the saturated state. The last state, and the most common, it is known by unsaturated state, which means that water and air are present in the voids. This structure is represented in Figure 2.1.
Figure 2.1-Porous material as athree-phase system – based on Fredlund & Rahardjo (1993).
Following this description, earth can be viewed as a three-phase system, since it has solid particles (solid phase), water (liquid phase) and voids with air (air phase). It is possible to quantify the relative proportion of these phases in terms of volume and mass ratios.
2.1.1.1
Volumetric features
The total volume (𝛺) is composed by the volume of the solid (𝛺𝑆), the volume of the liquid (𝛺𝐿) and the volume of the gas (𝛺𝐺). The sum of the volume of the liquid with the volume of the gas, present in the voids, is known by pore volume (𝛺𝑣), since the both states fill the pores. Thus, pores are voids in the material which can be filled by liquid or gas. In saturated soils, since there is only solid and water, the pore volume is equal to the volume of water. Similar relation can be stablished to dry soils, since there is only gas in the pores.
Volumetric quantities, such voids index (е), porosity of the material (ϕ), and saturation degree (𝑆𝑟) can be related to each other. These three characteristics are given by eq.1 to 3.
𝑒 =𝛺𝛺𝑣
6
𝜙 =𝛺𝛺 =𝑣 1 + 𝑒𝑒 (2)
𝑆𝑟 =𝛺𝛺𝐿
𝑣 (3)
From the equations above, equations relating to the volume of the solid, liquid and gas are represented in eq. 4 to 7.
𝛺 = 𝛺𝑆+ 𝛺𝑣= 𝛺𝑆+ 𝑒𝛺𝑆= 𝛺𝑆∗ (1 + 𝑒) (4)
𝛺𝑆 = 𝛺(1 − 𝜙) (5)
𝛺𝐿= 𝛺𝑆𝑟𝜙 = 𝛺𝜙𝐿 (6)
𝛺𝐺 = 𝛺(1 − 𝑆𝑟)𝜙 = 𝛺𝜙𝐺 (7)
Where 𝜙𝐿 is the porosity filled by the liquid and 𝜙𝐺 is the porosity filled by gas.
2.1.1.2
Gavimetric features
The main gravimetric feature is the water content, represented by u (kg/kg) or w (%). This characteristic
is presented as the relation between the weight of the water (𝑊𝑤) and the weight of the solid particles (𝑊𝑠). As explained before, for the weight determination of the solid particles the solid must be dry, so there is no water in it. This characteristic is also known by dry mass (𝑚0), whereas the wet sample is known as m. Therefore, the weight of the water can be written as seen in eq. 8.
𝑢 =𝑊𝑊𝑤
𝑠 =
𝑚 − 𝑚0
𝑚0 (8)
2.1.2
Type of pores
Porous networks can be classified according to their availability to let fluids penetrate the pores. There are two categories of pores. The ones that are totally closed, which are known as closed pores (a), and for that reason, water or gas cannot invade the pore. On the other hand, there are open pores, which have channels of communication with the exterior. They can have channels only in one side, which are known as blind pores (b), or have connection between two sides (through pores) (c) or can link two or more pores, known as interconnected pores (d).
7
Figure 2.2- Schematic cross-section of a porous network - adapted from Rouquerol et al. (1994).
2.1.3
Clay based porous material
Clay mineral species have crystals in their composition. The crystal shape and size depend on the physico-chemical conditions prevailing during their growth (Meunier, 2005). Surface forces play an important role in the behaviour of clay materials. The crystalline structure of clays forms flattened particles, which have negative electrical charges on their surface. These charges attract the cations within the water.
Clay particles are composed by dozens of clay minerals that can be grouped in two big subgroups: Non-swelling clays (like Kaolinite and Ilite) and Non-swelling clays (like Montmorillonite). Non-Non-swelling clays are known for detach from the pore wall and migrate due to ionic changing conditions and, as result, the pore suffers a blockage. Swelling clays suffers a swelling of clays lining due to ionic changing conditions, which leads to the reduction of the cross-sectional area for flow (Mohan et al., 1993; Gomes et al., 2016). Figure 2.3 shows the mechanism of permeability reduction caused by clays porous media.
Figure 2.3- mechanism of permeability reduction caused by clays porous media. (a) Migration (non-swelling effect): changing ionic conditions cause the detachment of clays from pore walls and result in pore blockage. (b) Swelling: changing ionic conditions cause swelling of clays, lining the pore walls and
reduce the cross-sectional area for flow (Mohan et al., 1993)
Both swelling and non-swelling clays reduce the effective area for flow and cause reduction in permeability. Non-montmorillonite, when placed in contact with water, increases its volume by about 20 times comparing with swelling clay (Norrish, 1954). In general, permeability decreases with increasing clay content. The effect of swelling clays on permeability reduction depends on the matrix grain size. In high porosity samples, the reduction in porosity due to clay swelling is insufficient to cause a meaningful reduction of permeability (Aksu et al., 2015).
a)
a)
a)
b) b)
c)
c)
d)
a) Closed pores
b) Blind pores
c) Through pores
8
1:1
2:1
Montmorillonite looks like flakes whose rims are wound around themselves (a), kaolinite crystals exhibit very often the shape of hexagonal prisms, which are flattened (b) and illite exhibit hairy crystals, which are very alongated (c) – see Figure 2.4.
Figure 2.4- Examples of morphology of crystals of clay species: a) montmorillonite, b) kaolinite and c) illite (Meunier, 2005).
These minerals have two basic crystalline units and they differ in the way that they are combined. One of the basic crystalline units is the silicon-oxygen tetrahedron (T) and the other is the aluminum octahedron (O). The tetrahedron layers are combined with silicon sheets and the octahedron with gibbsite sheets. Kaolinite is composed of two layers: silicon and gibbsite. This combination is known as T-O structure or 1:1 structure, and the link between the layers is relatively strong in several layers. Montmorillonite is composed of three layers: silicon-gibbsite-silicon. This combination is known as T-O-T structure or 2:1 structure, and the link between the layers is weak and the water can enter between the layers, causing expansion (McGregor et al., 2014; Meunier, 2005). The clay minerals structure is represented in Figure 2.5.
Figure 2.5- Clay minerals structures: kaolinite layers (1:1 structure) and Montmorillonite layers (2:1 structure), (Meunier, 2005).
Since the surface of the clay particles is negatively charged, they can attract the cations that exist in the water. The immediately adjacent water molecules are oriented and equally attracted to the surface of the clay particle. Thus, the cations form a positively charged zone, adjacent to the clay particle, which cause the existence of another negatively charged zone, but more diffuse. These two layers constitute the double ionic layer, see Figure 2.6. These characteristics condition the behaviour of clayey materials and their properties, that are influenced by ionic changes (Douillard & Salles, 2004).
In the 2:1 structure, the interlayer cation compensates the negative surface charges and when hydrated, its volume increases during the adsorption, or it can decrease during the desorption. This phenomenon is known as swelling affect, as explained above in this chapter. In the 1:1 structure, Kaolinite minerals have a very low surface charge and no interlayer cations, so the main adsorption sites are on the edges, where the Oxygen and Hydrogen molecules are present. The size of clay minerals ranges between 10 nm and 10
μm, with different shapes depending on the crystallization conditions (Meunier, 2005). Figure 2.7 shows a microtomography of clay particle.
9 Figure 2.6- Ionic layer: arrangement between the clay particle and water molecules – adapted from Antão
(2010).
Figure 2.7- Microtomography of clay particle (open source).
2.1.4
Biobased porous material
Hemp shives characteristics
The term hemp is used for the strain of the plant Cannabis sativa. This plant was one of the first crops
cultivated in the world and is one of the first plants to be spun into usable fiber. Hemp is also one of the fastest growing plants (4 m in 3.5 months), with low fertilization and irrigation, making it very efficient in use and material resources. Hemp crops are well adapted to most regions of the world (in a wide range of climatic zones). China, Europe and Canada are the three most important hemp planting regions in the world, producing in 2011 globally 61.318 ha. Hemp used to be cultivated to manufacture paper, rope and tissue. Nowadays, the different parts of the plant are used for several uses, such as agriculture, animal feeding, fabrication of alimentary oil, wool, textiles, paper, cosmetics, pharmaceutical industry, produce energy from biomass, combustible oils and building materials. Hemp does not contain proteins, so it is
10
unlikely attacked by insects and moths. As this does not contain either harmful substances nor it is dangerous for health both in production and laying phases (Salentijn et al., 2015; Benfratello et al., 2013).
The stems are cut and transformed to obtain fibers and shiv. The fibres are used to produce high quality paper and insulation wool, since the fibres are the most valuable part of the plant, while shiv particles, which are highly porous, are used in panels for interspaces in wooden structures, internal walls coating, ventilated coverings, ceilings and floors, or as aggregates in hemp concrete. These panels have very low specific weight and a high tensile, compressive and flexural strength. Hemp can also be used as plaster for outside walls (Glé et al., 2011; Benfratello et al., 2013).
Hemp has to be processed before its utilization. In summer, the plants are cut and dried in the sun for two weeks; then they are swingled for separating the fibres, located in the stalk, from the shives, that is the wooden inner part (Benfratello et al., 2013). The size of the particles is different depending on the growth climate, which means that their microstructure will be different due to their origin. In this study, since the particles have the same origin, only the effect of their size distribution was observed (Glé et al., 2011). Figure 2.8 shows hemp shives (a) and the micro porosity of hemp shives (b).
Figure 2.8- hemp shives (a) and microtomography of hemp shives (b). Figure (b) from open source.
Since hemp shives are a highly porous material it leads to an impact in the strength/density ratio, in the strength of link with the binder and in the mechanical properties. The porosity also influences the thermal conductivity. The open porosity in the surface, as is possible to see in the Figure 2.7, gives the material a good sound absorption and the possibility to water vapour diffusion. Its highly porosity gives it the potential to be a good hygroscopic material.
Hemp concrete
Hemp shives have been used to produce building materials, such as lime-hemp concrete, known as hemp concrete. This material is generally used for filling wood frames, bricks, blocks or mortar for coating masonry wall. Hemp concrete consists of shives mixed with lime-based binder. The proportions of the shives-binder determines the mechanical acoustic and hygrothermal properties (Dubois et al., 2014; Salentijn et al., 2015).
Hemp concrete is a very porous material, which has a huge influence on its acoustical properties. Other kinds of porous concrete have already been studied, such as autoclaved concrete, concrete with grains of irregular shape and dimension or concrete using recycled waste concrete aggregate. These porous concretes are also acoustically efficient. However, the particularity of hemp concrete is its multi-scale porosity, since it has different sizes (ranging between 1 lm and 1 cm), into the binder and into and between the particles. In hemp concrete, three or four different physical scales of porosity can be distinguished.
11 The microscopic pores of the shives and the binder, and the macropores between the particles make hemp concrete a high porosity material (Glé et al., 2011). Figure 2.9 shows the microporosity of hemp concrete. This characteristic makes hemp concrete a serious candidate in the search of sustainable and energy-efficient building material. The porous structure determines the sorption and capillary behaviour, since the moisture storage and moisture exchange capacity is directly related to their porous structure.
Figure 2.9- Microtomography of hemp concrete (Dubois et al., 2014)
2.2
Moisture transport
The dry state is reached by drying the material to constant weight, according to standard DIN 52620. The notion of humidity has several concepts, known as absolute humidity (𝑥𝑎𝑖𝑟), water vapour concentration
(ν), relative humidity (RH) and dew point temperature (𝑡𝑠). The absolute humidity (𝑥𝑎𝑖𝑟) is the amount of water vapour in the air, translated in kg of water vapour per kg of dry air. The same definition can be applied to the water vapour concentration (ν) with the difference that the units are expressed in kg of water vapour per volume of air (𝑚3). Of all the concepts that translate air humidity, the relative humidity (RH) is probably the most well-known. The relative humidity translates a ratio between the current amount of water vapour in the air and the maximum amount of water vapour that the air could contain, at the same temperature (eq. 9). Therefore, RH is a function of a relation between two variables. One of which is a characteristic of the environment (partial pressure that exists, 𝑃𝑣) and the other always translates the same value for a given temperature (Saturation pressure, 𝑃𝑣,𝑠𝑎𝑡). The dew point (𝑡𝑠) translates the temperature for which the air reaches saturation, considering the temperature and the RH of the air (Henriques, 2007).
𝑅𝐻 =𝜈𝜈
𝑠∗ 100 =
𝑃𝑣
𝑃𝑣,𝑠𝑎𝑡∗ 100 (%) (9)
12
2.2.1
Water vapour diffusion
As the earth materials are porous materials, it means that they have open and connected voids through which the water vapour diffuses. The water vapour permeability can be obtained according to the standard EN ISO 12572:2001, for building materials.
Water vapour permeability (𝛿𝑝) is the amount ofwater vapour that flowsthrough the material per unit time through a unitary thickness, and judging that the vapour pressure between the two faces is unitary. To characterize the permeability of a material, it is most often used the concept of water vapour resistance factor (μ), which relates the ratio between 𝛿𝑎 and 𝛿𝑝 . This relation is presented in eq. 10:
𝜇 =𝛿𝑎
𝛿𝑝 (10)
where 𝛿𝑎 is the water vapour permeability of the air, and its average value (at 23ºC) can be assumed as 1,9𝑥10−10 kg/(m.s.Pa), while 𝛿
𝑝 is the water vapour permeability within the material [kg/(m.s.Pa)]. The water vapour permeability is defined as the mass of water vapour that trough the specimen thickness by time, divided by the water vapour pressure between the two faces of the specimen (Henriques, 2007; McGregor et al., 2014). The higher the value of μthe smaller the value of vapour permeability of the material will be.
In general, the potential difference in heat transfers is related with temperature, while in mass transfers the potential results of the differences of concentration. If the difference of temperature or concentration are zero, there is no flow (Henriques, 2007). Diffusion is a mechanism of vapour transport and it is expressed by Fick’s law, which can be written in the form of eq. 11:
𝒈𝒗= −𝛿𝑝∗ 𝒈𝒓𝒂𝒅(𝑝𝑣) (11)
Where 𝒈𝒗 is the water vapour flux density vector due to diffusion [kg/(𝑚2. 𝑠)], 𝛿𝑣 is the water vapour permeability, which depends on the vapour pressure, and grad(𝑝𝑣) is the water vapour pressure gradient.
The vapour pressure (𝑝𝑣) is depicted by Kelvin´s equation, which is expressed in eq. 12:
𝑝𝑣 = 𝑝𝑣𝑠𝑎𝑡∗ exp(𝜌 𝑝𝑐
𝑤∗ 𝑅𝑣∗ 𝑇) (12)
where 𝑝𝑣𝑠𝑎𝑡 is the saturated water vapour pressure, 𝜌𝑤 is the density of water, 𝑅𝑣 is the gas constant for water vapour, T is the temperature and 𝑝𝑐 is the capillary pressure, which is defined as the difference between the liquid and the gaseous phase inside the pore.
When the vapour diffusion within the porous network is considered, the Fick´s law can be represented as it shows in eq. 13:
𝒈𝒗 = −𝛿𝑝∗ 𝒈𝒓𝒂𝒅(𝑝𝑣) = −𝛿𝜇 ∗ 𝒈𝒓𝒂𝒅(𝑝𝑎 𝑣) (13)
13
2.2.2
Liquid water transport
The movement of water in porous materials can happen due to different ways: by the action of gravity, contrary to the action of gravity, which is known as capillarity, horizontal migration or due to differences in pressure.
Capillarity
The capillarity phenomenon happens due to suction forces that enable the water to move in the opposite direction of gravity. When a building material in contact with liquid water absorbs it by capillary suction, it is called capillary-active, if does not it is called hydrophobic. Capillary-active materials absorbs liquid water until it reaches a certain state of saturation called free water saturation or capillary saturation. To overcome the capillary saturation state, it is necessary to use additional methods, such as pressure or water vapour diffusion in a temperature gradient (Künzel, 1995).
This phenomenon depends on the characteristics of the liquid, such as its surface tension (σ) and its contact angle (θ). The water molecules attract each other, and one molecule integrally encased in others has its attraction forces annulled. At the surface, the water molecules are not equilibrated, therefore, there is a surface tension (σ), which can be determined as a function of temperature. Where the water touches the pore walls there is another force known as contact angle (θ), which is determined by the inclination of the tangent between a drop of water and the surface. In construction materials, without superficial treatment, the contact angle is normally close to zero.
The Young-Laplace equation shows that the difference of capillary pressure (Δp) between the liquid and the air depends on the surface tension and the mean curvature (C), as explained in eq. 14.
𝛥𝑝 = 2𝜎𝐶 (14)
where, the mean curvature is the inverse of the meniscus radius in two orthogonal directions.
If a circular tube with the same radius in both orthogonal directions and R=r/ cosθ is considered, the equation can be written as eq. 15:
𝛥𝑝 =2𝜎𝑐𝑜𝑠𝜃𝑟 (15)
where, r is the tube radius.
The capillary pressure is compensated by the height that the water reaches (h). The hydrostatic equilibrium is expressed in eq. 16:
ℎ =2𝜎𝑐𝑜𝑠𝜃𝑟𝜌𝑔 (16)
where 𝜌 is the density of the liquid (kg/𝑚3) and 𝑔 is the gravity acceleration.
The capillary ascending process begins when the pore contacts with water, mobilizing forces of gravity, capillary suction, air friction in the upper pore area and water friction. The sum of these forces must be in equilibrium, which means that height reached by water is related with the capillary pressure (Henriques, 2007).
14
Figure 2.10- Capillary suction within a pore – based on Henriques (2007)
The capillary ascending process begins when the pore contacts with water, mobilizing forces of gravity, capillary suction, air friction in the upper pore area and water friction. The sum of these forces must be in equilibrium, which means that height reached by water is related with the capillary pressure (Henriques, 2007).
Horizontal migration
In the case of horizontal water migration, the pore is considered to be exclusively horizontal, so the pore slope is given as α=90º. If the air friction is neglected, the distance to the humid front (x) can be calculated by eq. 17. It is possible to verify that the distance depends on the radius of the pore and the time. It can be verified by the expression that the narrower the pore the smaller the speed of absorption. This finding is important for facade cladding materials as they are subject to rainfall (Henriques, 2007).
where S is the sorptivity (m/√𝑠 ), which means the velocity of water transport within the porous material and 𝜇𝑤 is the viscosity of water (Pa.s).
Differences in pressure
The movements of water in porous materials are due to pressure differences, which create suction forces. These movements occur in laminar regime, since the Reynolds’s number is much lower than the limit value of the turbulent regime.
𝑥 = √𝑟𝜎𝑐𝑜𝑠𝜃
2 ∗ 𝜇𝑤 ∗ √𝑡 = 𝑆 ∗ √𝑡
15
2.3
Moisture storage
Porous materials always retain some water, in the liquid or vapour form from the air, whatever the temperature and the water vapour. Therefore, porous materials are known to have the ability to retain moisture. The phenomenon of adhesion of water molecules to the surface of the pores is called adsorption.
In buildings, the level of moisture inside increase with occupancy. When the level of moisture is high it means that the water vapour pressure in the air is high, which leads to the transport of water vapour through the building materials. Porous materials used for construction present a progressively higher adsorption when the relative humidity increase. If the material has hygroscopic salts inside it, such as chlorides or nitrates, this effect is more drastic because the salts have the ability to adsorb large amounts of water vapour, thus altering the typical behaviour of the material. Since it is often difficult to determine separately the different physical state of water inside of the materials, the sum of the different states is examined together and presented in water content.
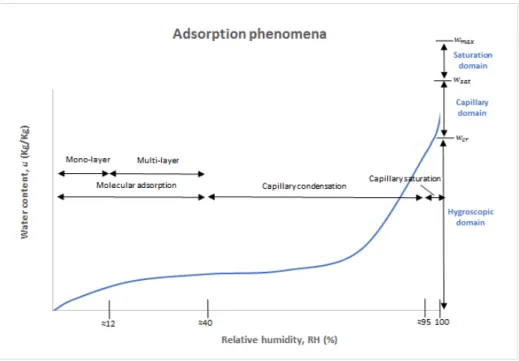
Earth building materials normally present a “S” shaped isotherm. Depending on the relative amount of liquid and gas within the porous network, several states of adsorption can be defined. The graph shown in Figure 2.11 shows three adsorption domains consonant with the water content within the material and three pore saturation states consonant with the relative humidity.
Figure 2.11- Adsorption domains and molecular saturation states - adapted from Hall & Allison (2009) and Henriques (2007)
16
Figure 2.12- Types of sorption isotherms (Sing et al., 1985)
The capillary domain, also known as unsaturated domain, contains both liquid and gas phases. Despite the air pressure and in-pore liquid pressure being higher than the entry air suction, most of the molecules of the liquid do not move freely within the porous network since they are sufficiently distant from the pore walls. The saturated domain is also known as quasi-saturated, since the gaseous phase is discontinuous taking into account that there is only trapped air in porous network. It takes the forms of air bubbles or pockets that are embedded within the liquid phase (Fabbri, 2017; Künzel, 1995).
The molecular saturation states contain two phases: molecular adsorption, which is the deposition of a single layer of water molecules on the surface of the pores, which usually corresponds to 0% to 20% of relative humidity, and the second phase is the multi-layer adsorption, approximately between 20% and 40% of relative humidity. The capillary condensation phase begins when the various layers of adsorbed water touch each other, which first happens in the smaller pores. Due to the effect of the forces of attraction, the water molecules are arranged in a more stable form. The surface tensions cause the formation of meniscus on the extremities. According to the Young-Laplace equation, the shape of the meniscus determines the pressure (eq. 14 shown above). Kelvin's law, shown in eq. 18, relates the pressure with the saturation pressure on the porous radius with the value of the relative humidity for saturation.
𝜑 =𝑃𝑃𝑣
𝑣,𝑠𝑎𝑡 = ℯ
[−2𝜎𝑀𝑤𝑐𝑜𝑠𝜃
𝑟𝜌𝑤𝑅𝑇 ] (18)
Where 𝑀𝑤 is the molar mass of water (kg/mol), R is the gas constant (J/kg.mol) and T is the temperature (K).
In the capillarysaturation, about 98% relative humidity, the capillary condensation does not occur in the entire pore space due to the existence of air pockets in the pores, which prevent the normal progression of the humid front. To reach the state of total saturation it is necessary to subject the materials to the vacuum, before the adsorption process, in order to remove the air in the pores. However, if the water remains for a long period of time in contact with the air pockets can dissolve them and reach the saturation level, without necessity to use the vacuum mechanism.
17
𝜉 =𝜕 𝑢𝜕𝜑𝐻 (19)
The relationships between water vapour concentration, relative humidity and air temperature can be expressed through the psychometric diagram. A simplified version of the diagram is shown in Figure 2.13. The diagram presents in abscissas the values of the air temperature (ºC), in ordinates the values of partial vapour pressure (kPa) and relative humidity (%).
Figure 2.13- Psychometric diagram (open source).
18
Figure 2.14- Examples of hysteresis of two different materials: Materials with mineral binders (a) and materials like rocks (b) – adapted from Henriques (2007).
Hysteresis influences the dynamic behaviour of materials. The water vapour permeability describes the moisture transport property of the material. Permeability is not a constant value, but it is a function of the saturation ratio. For each relative humidity level, there will be equilibrium in water content in the material. The differences in the sorption curves for different materials are due to micro-structural properties, such as specific surface area, pore-size distribution and total porosity. Therefore, when results of the RH are needed, the hysteresis effect should be taken in account (Kwiatkowski et al., 2009). Hysteresis is common in soil-water phenomena. The water retention in earth materials is not a simple relationship between the effective degree of saturation (𝑆𝑟) and the matric suction s (or soil-water potential ψ). The soil-water characteristic curve (SWCC) is defined as the relationship between these two properties. This curve is also called the soil moisture characteristics curve or the soil-water retention curve. The SWCC is widely used to predict, soil-water storage, permeability and stress–strain relationships of unsaturated soils (Zhou, 2013).
During the adsorption/desorption process, the contact angle in drying process (𝜃𝑅) and the contact angle in wetting process (𝜃𝐴) are not constant, as shown in Figure 2.15.
Figure 2.15- Contact angles in adding/removing volume method (Zhou, 2013).
A predicted SWCC, when k is set to constant value, is represented in Figure 2.16.
In Figure 2.16,𝑆𝑒represents the effective degree of saturation, k represents the ratio of suction increment (eq. 20) and is value is equal to zero in the main branches, since the contact angle stays constant in the main drying and wetting branches. k varies from 0 to 1 during the process, from reversing the
drying-wetting processes. n is a parameter related to the pore size distribution and 𝑎𝑑is a parameter related to the air entry value. As k is constant, the SWCC is almost linear, as shown in Figure 2.15 (Zhou, 2013).
W
a
ter
co
n
ten
t (
%
)
Relative humidity (%)
W
a
ter
co
n
ten
t (
%
)
Relative humidity (%)
adsorption desorption