HESSD
9, 8455–8492, 2012Linking soil moisture balance and source-responsive
models
M. O. Cuthbert et al.
Title Page
Abstract Introduction
Conclusions References
Tables Figures
◭ ◮
◭ ◮
Back Close
Full Screen / Esc
Printer-friendly Version Interactive Discussion
Discussion
P
a
per
|
Dis
cussion
P
a
per
|
Discussion
P
a
per
|
Discussio
n
P
a
per
Hydrol. Earth Syst. Sci. Discuss., 9, 8455–8492, 2012 www.hydrol-earth-syst-sci-discuss.net/9/8455/2012/ doi:10.5194/hessd-9-8455-2012
© Author(s) 2012. CC Attribution 3.0 License.
Hydrology and Earth System Sciences Discussions
This discussion paper is/has been under review for the journal Hydrology and Earth System Sciences (HESS). Please refer to the corresponding final paper in HESS if available.
Linking soil moisture balance and
source-responsive models to estimate
di
ff
use and preferential components of
groundwater recharge
M. O. Cuthbert1, R. Mackay2, and J. R. Nimmo3 1
Water Sciences Research Group, School of Geography, Earth and Environmental Sciences, University of Birmingham, Birmingham B15 2TT, UK
2
Geotechnical and Hydrogeological Engineering Research Group, Monash University, Churchill, Victoria, Australia
3
US Geological Survey, Menlo Park, California, USA
Received: 1 June 2012 – Accepted: 20 June 2012 – Published: 11 July 2012
Correspondence to: M. O. Cuthbert ([email protected])
HESSD
9, 8455–8492, 2012Linking soil moisture balance and source-responsive
models
M. O. Cuthbert et al.
Title Page
Abstract Introduction
Conclusions References
Tables Figures
◭ ◮
◭ ◮
Back Close
Full Screen / Esc
Printer-friendly Version Interactive Discussion
Discussion
P
a
per
|
Dis
cussion
P
a
per
|
Discussion
P
a
per
|
Discussio
n
P
a
per
|
Abstract
Results are presented of a detailed study into the vadose zone and shallow water table hydrodynamics of a field site in Shropshire, UK. A conceptual model is devel-oped and tested using a range of numerical models, including a modified soil moisture balance model (SMBM) for estimating groundwater recharge in the presence of both
5
diffuse and preferential flow components. Tensiometry reveals that the loamy sand top-soil wets up via macropore flow and subsequent redistribution of moisture into the top-soil matrix. Recharge does not occur until near-positive pressures are achieved at the top of the sandy glaciofluvial outwash material that underlies the topsoil, about 1 m above the water table. Once this occurs, very rapid water table rises follow. This threshold
10
behaviour is attributed to the vertical discontinuity in the macropore system due to seasonal ploughing of the topsoil, and a lower permeability plough/iron pan restricting matrix flow between the topsoil and the lower outwash deposits. Although the wetting process in the topsoil is complex, a SMBM is shown to be effective in predicting the initiation of preferential flow from the base of the topsoil into the lower outwash
hori-15
zon. The rapidity of the response at the water table and a water table rise during the summer period while flow gradients in the unsaturated profile were upward suggest that preferential flow is also occurring within the outwash deposits below the topsoil. A variation of the source-responsive model proposed by Nimmo (2010) is shown to reproduce the observed water table dynamics well in the lower outwash horizon when
20
HESSD
9, 8455–8492, 2012Linking soil moisture balance and source-responsive
models
M. O. Cuthbert et al.
Title Page
Abstract Introduction
Conclusions References
Tables Figures
◭ ◮
◭ ◮
Back Close
Full Screen / Esc
Printer-friendly Version Interactive Discussion
Discussion
P
a
per
|
Dis
cussion
P
a
per
|
Discussion
P
a
per
|
Discussio
n
P
a
per
1 Introduction
Many aquifer recharge estimation methods have been developed for application to water-supply, water-quality, agricultural, and ecohydrologic problems (Scanlon et al., 2002; Nimmo et al., 2005). Of these there is no single technique that can serve as a standard; each has apparent deficiencies as well as particular advantages. It is widely
5
recommended practice to apply multiple methods to any problem requiring recharge estimation (Lerner et al., 1990; Scanlon et al., 2002; Healy, 2010). Method comparison can be useful to increase confidence in the estimates and also to highlight different features of the recharge. For example the steady state Darcian method (Nimmo et al., 1994) indicates the steady-flow component of recharge, whereas the water table
fluc-10
tuation method (Healy and Cook, 2002; Cuthbert, 2010) is sensitive to episodic and sometimes seasonally varying recharge. The augmentation of a traditional method with one that is specific to alternative flow modes could have great value. In this work we apply the multiple-method guideline for recharge estimation by combining two largely complementary methods in order to obtain an estimate that more fully represents the
15
diverse processes contributing to aquifer recharge.
A soil-moisture balance model (SMBM) is a valuable approach to recharge esti-mation relying on such hydrologic inputs as infiltration and evapotranspiration (Alley, 1984). Given that water is conserved in the land-atmosphere system, recharge equals the difference between the amount of water input and the amount that goes to fates
20
other than recharge. Significant components of the water balance typically include pre-cipitation, evapotranspiration, soil-moisture storage, and recharge. Water transfer be-tween SMBM components is governed by traditional principles of diffuse flow. Because recharge is computed as a residual and is frequently smaller in magnitude than the components that are differenced to compute it, all of those components must be well
25
estimated to keep the computed recharge uncertainty from being very large.
HESSD
9, 8455–8492, 2012Linking soil moisture balance and source-responsive
models
M. O. Cuthbert et al.
Title Page
Abstract Introduction
Conclusions References
Tables Figures
◭ ◮
◭ ◮
Back Close
Full Screen / Esc
Printer-friendly Version Interactive Discussion
Discussion
P
a
per
|
Dis
cussion
P
a
per
|
Discussion
P
a
per
|
Discussio
n
P
a
per
|
health and ecosystem function, preferential flow bypasses much of the unsaturated medium along paths such as wormholes, fractures, and fingers of enhanced wetness, especially when water is copiously supplied. Because it typically generates high-speed, high-volume flow with minimal exposure to solid earth materials, preferential flow is a dominant influence in many problems of recharge, as well as infiltration, contaminant
5
transport, and ecohydrology. It can produce recharge in the absence of a recognizable wetting front. It can be difficult to account for as it does not fit readily into traditional un-saturated zone flow theory, which emphasizes diffuse and equilibrium modes of flow. The key problem for a SMBM is that preferential flow can move substantial amounts of water through the subsurface in ways not amenable to a strict component-based
ac-10
counting for volume of water (Ireson and Butler, 2011). For example, preferential flow may transfer newly infiltrated water directly to recharge within a time span so short that it does not allow water to first reduce soil-moisture deficits or become evapotranspi-ration (ET) (Cuthbert and Tindimugaya, 2010). Because a traditional SMBM does not allow for such a process, it would put the resulting model estimates in error for recharge
15
affected by preferential flow
Preferential flow is associated strongly with certain features of the subsurface. Its ini-tiation can depend on threshold effects, perhaps related to input fluxes or antecedent soil moisture (Shipitalo and Edwards, 1996; Hardie et al., 2011). It can depend on highly heterogeneous small-scale features of the soil, such as macropores whose
con-20
ductance and connectivity are unknown. For example Rosenbom et al. (2008) observed markedly different behaviour in continuous vs. dead-end macropores: during rainfall, wormholes that ran continuously down to a subsurface absorptive layer allowed free-flowing water whereas those that terminated at shallower depths remained plugged without significant flow. The position and effectiveness of subsurface impeding layers
25
HESSD
9, 8455–8492, 2012Linking soil moisture balance and source-responsive
models
M. O. Cuthbert et al.
Title Page
Abstract Introduction
Conclusions References
Tables Figures
◭ ◮
◭ ◮
Back Close
Full Screen / Esc
Printer-friendly Version Interactive Discussion
Discussion
P
a
per
|
Dis
cussion
P
a
per
|
Discussion
P
a
per
|
Discussio
n
P
a
per
such flow occurred only below the plough pan. Direct experimental evidence (Allaire-Leung et al., 2000; Su et al., 2003) shows how it is possible for preferential flow to commence at a depth within the subsurface where a layer containing macropores un-derlies a layer which has none. A modified SMBM that can account for processes like these would have expanded versatility and reliability.
5
The preferential flow model of Nimmo (2010) is called source-responsive because it allows for water at depth to respond sensitively to changing conditions at the source of water input. To avoid the need for the large numbers of parameters in most existing preferential flow models, which are often impossible to estimate a priori, the source-responsive model employs empirical relationships with a basis in laminar flow theory
10
and properties of typical earth materials. This model employs a two-domain configura-tion, equivalent to a medium that has relatively finely-pored matrix material (domain D) with interpenetrated macropores (domain S). In the D domain flow is by diffusive pro-cesses, quantifiable by the Darcy-Buckingham law and Richards’ equation, although alternatives such as a SMBM could be used instead. In the S, or source-responsive,
15
domain water moves by preferential flow and free-surface films and the input of water typically dominates the flow. The S domain flow formulation is mathematically simpler than Richards’ equation, being described by linear equations and not depending on the Richards’ equation-required unsaturated hydraulic properties that are hysteretic and extremely sensitive to water content. To predict unsaturated flow the source-responsive
20
model requires quantitative characterization of (1) internal macropore facial area as a function of depth M(z), representing the capacity for preferential flow, and (2) an active-area fractionf(z,t), indicating how much of the preferential flow capacity is active at given depth and time. The values ofM andf do not in general depend on moisture state but rather on profile-scale properties of the medium and water-input conditions
25
(e.g. rainfall rate). Independence from local moisture state allows these functions to quantify processes that proceed without immediate interdomain equilibration.
HESSD
9, 8455–8492, 2012Linking soil moisture balance and source-responsive
models
M. O. Cuthbert et al.
Title Page
Abstract Introduction
Conclusions References
Tables Figures
◭ ◮
◭ ◮
Back Close
Full Screen / Esc
Printer-friendly Version Interactive Discussion
Discussion
P
a
per
|
Dis
cussion
P
a
per
|
Discussion
P
a
per
|
Discussio
n
P
a
per
|
source-responsive preferential flow (SRPF) model. We use this combination to explain the data collected from a field site in Shropshire, UK, and address further problems and complexities, such as threshold and antecedent water effects, whose effect on recharge is handled directly in a SMBM but not yet in the SRPF model of Nimmo (2010) The combination of SMB and SRPF models can lead to general improvements in the
5
modelling of preferential flow subject to threshold and antecedent water effects, in ad-dition to improving groundwater recharge estimation by more realistically accounting for the diverse modes of unsaturated flow.
2 Fieldsite
2.1 Locality
10
The experimental site is located in a lowland area of gently undulating terrain in Shrop-shire, UK (Fig. 1) within the catchment of the Potford Brook (catchment area 22.5 km2), a tributary of the River Tern (catchment area 880 km2), itself a tributary of the River Severn. It is underlain predominantly by a Permo-Triassic sandstone aquifer of re-gional significance with a covering of variable superficial deposits comprising glacial
15
till, glaciofluvial deposits and valley alluvium and soils which generally reflect the na-ture of the underlying superficial geology.
Long term (1970–1999) annual average rainfall and potential evapotranspiration for the Potford Brook catchment are around 670 mm and 597 mm, respectively (Cuthbert et al., 2010). The areally averaged recharge to the aquifer in the catchment is thought
20
to lie in the range 110–127 mm a−1 (Cuthbert, 2010) and a previous study suggests values as high as 240 mm a−1 in outcrop/outwash sand covered areas (Streetly and Shepley, 2005). There is significant uncertainty in recharge distribution and hydraulic processes at the field scale which forms the context for the research presented here (Cuthbert et al., 2009; Thatcher, 2009).
HESSD
9, 8455–8492, 2012Linking soil moisture balance and source-responsive
models
M. O. Cuthbert et al.
Title Page
Abstract Introduction
Conclusions References
Tables Figures
◭ ◮
◭ ◮
Back Close
Full Screen / Esc
Printer-friendly Version Interactive Discussion
Discussion
P
a
per
|
Dis
cussion
P
a
per
|
Discussion
P
a
per
|
Discussio
n
P
a
per
The site is located adjacent to Hollycroft Farm (NGR SJ 6408 2321) and was under winter wheat at the time of developing the site (June 2004) but was cleared by hand at harvest time (August 2004) to let grass (and other wild vegetation) become established.
2.2 Site hydrogeology
The geology of the wider catchment is described in detail elsewhere (Cuthbert, 2006;
5
Cuthbert et al., 2009). The geology of the site is known from 4 cored boreholes, from shallow augering undertaken for the installation of the tensiometers and TDR access tubes, and indirectly from electrical resistivity tomography (ERT) surveys.
A dark reddishbrown fine to medium grained sandy topsoil (loamy sand) of 0.3 to 0.5 m thickness (ca. 0.4 m at the location of the tensiometers) covers the site.
Macro-10
pores are evident in the topsoil as indicated in Fig. 2. Double ring infiltration tests indicate that the saturated hydraulic conductivity of the topsoil is in the range 0.01 to 0.1 cm min−1 (Cuthbert, 2006). No overland flow or significant ponding has been ob-served on the site after rainfall.
The topsoil overlies glaciofluvial outwash material persisting to between 2.45 and
15
2.7 m b.g.l. An ERT survey oriented approximately east-west suggests that the site is located on the west side of a roughly north-south oriented channellike structure with the outwash thickening to the east. The outwash predominantly comprises well sorted medium sand with variable gravel content. Below around 1 m b.g.l. it is grey brown in colour but above this level and below the topsoil there is a slightly cemented
20
orange brown horizon of variable thickness. This is a zone of illuviation where iron, and most likely aluminium, oxides have accumulated into an “iron pan” above the level of permanent saturation. Thin (<0.1 m) clay-rich beds are also present in some locations above 1.5 m b.g.l. Falling head tests in the piezometers at the site indicate the saturated horizontal hydraulic conductivity of the lower 0.4 m of the outwash deposits is in the
25
range 0.1 (at piezometer BH6) to 3.8 m d−1(Cuthbert, 2006).
HESSD
9, 8455–8492, 2012Linking soil moisture balance and source-responsive
models
M. O. Cuthbert et al.
Title Page
Abstract Introduction
Conclusions References
Tables Figures
◭ ◮
◭ ◮
Back Close
Full Screen / Esc
Printer-friendly Version Interactive Discussion
Discussion
P
a
per
|
Dis
cussion
P
a
per
|
Discussion
P
a
per
|
Discussio
n
P
a
per
|
underlying this clay varies across the site comprising layered till and glaciolacus-trine sand in different combinations. Weathered slightly clayey fine to medium grained Permo-Triassic sandstone underlies the superficial deposits at between 7 and 8 m b.g.l. This paper is concerned with the groundwater hydrology of the permeable uppermost soil and outwash deposits in which a perched water table is present. A small amount
5
of vertical leakage is estimated to occur (a few mm a−1) through the underlying low permeability glaciolacustrine clay deposits (Cuthbert, 2006) to the sandstone aquifer below which is unconfined in this location.
2.3 Instrumentation and monitoring
The site was highly instrumented (Cuthbert, 2006) with the following of relevance to
10
this paper.
2.3.1 Tensiometers
A nest of 5 tensiometers (T1 to T5) with specification and installation techniques de-scribed by Greswell et al. (2009) and Cuthbert et al. (2009), respectively. Thermocou-ples were attached to each tensiometer just above the level of the ceramic cup. The
15
bases of the ceramic cups were placed at 33, 73, 88, 132 and 159 cm b.g.l. for T1 to T5, respectively. The tensiometers were measured manually from August 2004 to October 2004 and logged thereafter at a 5 min frequency until July 2005. Tensiometer T2 malfunctioned within 1 month of installation due to electronic failure. The other ten-siometers generally performed well although pressure effects, presumed to be due to
20
freezing of the water column occurred at times correlated with sub-zero ground temper-atures measured by on-site thermocouples. These data have been removed and not used for analysis. During the summer period a daily cycle of pressure variations due to heating/cooling of the tensiometer water column also caused artefacts in the data although the general pattern of pressure changes due to moisture content variations is
25
HESSD
9, 8455–8492, 2012Linking soil moisture balance and source-responsive
models
M. O. Cuthbert et al.
Title Page
Abstract Introduction
Conclusions References
Tables Figures
◭ ◮
◭ ◮
Back Close
Full Screen / Esc
Printer-friendly Version Interactive Discussion
Discussion
P
a
per
|
Dis
cussion
P
a
per
|
Discussion
P
a
per
|
Discussio
n
P
a
per
2.3.2 TDR access tube
A 157 cm deep access tube (M2) was installed for use with a TRIME TDR probe (IMKO, Germany). Readings were taken at an average frequency of 2 weeks at 1 to 3 week intervals for 12 months beginning in August 2004. For each monitoring period, 3 TDR moisture content values were taken at 10 cm depth intervals, at orientations separated
5
by 120◦ to enable an average reading to be calculated.
2.3.3 Piezometer
A shallow piezometer (BH6) was installed within a cored borehole situated approxi-mately 4 m from the tensiometers and TDR access tube. The monitored section (2.2 to 2.6 m b.g.l.) comprised a pre-fabricated filter pack around 25 mm ID plastic casing with
10
0.3 mm slots and the installation was sealed above the filter pack with bentonite, the top 30 cm being filled with a cement grout, and then fitted with a cover at ground level. It was fitted with custom-made electronics including a differential pressure transducer (vented to atmosphere) to enable data to be logged automatically at regular intervals (Greswell et al., 2009). Water levels were recorded manually every few days from June
15
to October 2004 and were then automatically logged from November 2004 to Septem-ber 2005 at 5 min intervals. The piezometer transducer/data logger equipment gave results in excellent agreement with manual dip readings taken sporadically through the monitored period.
2.3.4 Climate data
20
HESSD
9, 8455–8492, 2012Linking soil moisture balance and source-responsive
models
M. O. Cuthbert et al.
Title Page
Abstract Introduction
Conclusions References
Tables Figures
◭ ◮
◭ ◮
Back Close
Full Screen / Esc
Printer-friendly Version Interactive Discussion
Discussion
P
a
per
|
Dis
cussion
P
a
per
|
Discussion
P
a
per
|
Discussio
n
P
a
per
|
(UK Meteorological Office data: Hough and Jones, 1997) potential evapotranspiration (PE) values were also available for the locality.
3 Results and observations
3.1 General observations
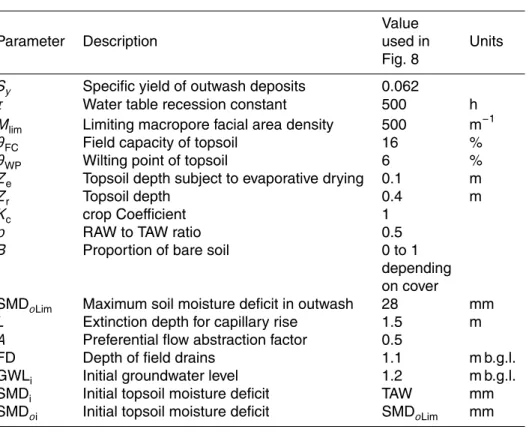
Daily averages of hydraulic head across the whole monitoring period are shown in
5
Fig. 3 and indicate that heads recorded by deeper tensiometers when saturated are indistinguishable from each other (accepting a small error in the measurements) with an almost identical pattern to the piezometer. T5 always recorded positive pressure heads. A component of lateral hydraulic gradient exists within the shallow groundwa-ter system between the tensiomegroundwa-ter/TDR location and the piezomegroundwa-ter location. This
10
suggests that there is a component of lateral drainage through the outwash deposits consistent with the presence of field drains as indicated by the landowner.
An annual seasonal cycle can be seen in the water table with superimposed recharge events separated by recessions. The levelling off observed in the water table in the summer is suggestive of minimal drainage into the underlying glaciolacustrine clay
15
as would be expected from the measured low permeability (Cuthbert, 2006). “Winter” recessions reach a floor of around 1 m b.g.l. at the location of the tensiometers, for example during mid March when all tensiometers imply hydrostatic equilibrium in the whole profile. Steeper and deeper recessions occur in the summer period levelling off at around 1.4 m b.g.l. T1 is much more responsive than the deeper tensiometers and
20
HESSD
9, 8455–8492, 2012Linking soil moisture balance and source-responsive
models
M. O. Cuthbert et al.
Title Page
Abstract Introduction
Conclusions References
Tables Figures
◭ ◮
◭ ◮
Back Close
Full Screen / Esc
Printer-friendly Version Interactive Discussion
Discussion
P
a
per
|
Dis
cussion
P
a
per
|
Discussion
P
a
per
|
Discussio
n
P
a
per
3.2 Detailed hydrodynamic observations
3.2.1 Summer responses
PE reaches a maximum in June averaging approximately 3 mm d−1 (Fig. 3), greatly increasing evapotranspirative demand for soil moisture during these summer periods. As a result, pressures in T1 and T3 are frequently negative reaching tensions of a few
5
hundred cm of water although during prolonged/intense summer rainfall events ten-sions in the topsoil are severely reduced. Water table rises are seen under low water table conditions for example during late August 2004 (5 cm rise) and late June 2005 (8 cm rise). During the former event it is notable that the water table responds while an upward flow gradient is present in the profile as shown by a lower head recorded in T3
10
than in the lower tensiometers (T4 and T5).
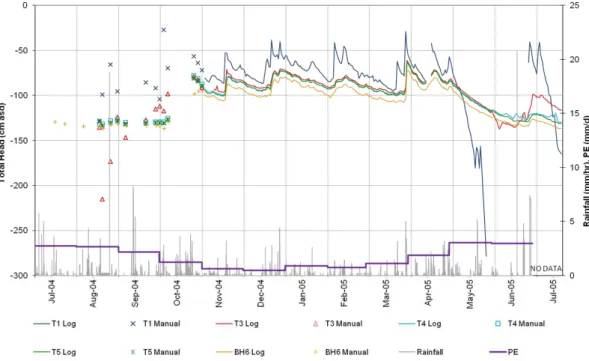
3.2.2 Autumn to spring responses
A subset of high temporal resolution (5 min) data for March 2005 is shown in Fig. 4 and is illustrative of the behaviour of the system outside of the summer periods. T1 (33 cm b.g.l.) shows complex threshold behaviour responding almost immediately to certain
15
rainfall events but showing no response to others e.g. the first two rainfall events on 22 March produce no response but then the third, of smaller magnitude, produces an effect within minutes in T1 with the tension almost reducing to zero. After rainfall ceases a “background” tension is quickly re-established but of lower magnitude than that pre-ceding the event. Between such events, T1 shows some recession (e.g. between 25
20
and 30 March). The deeper tensiometers do not show responses to all events in which T1 responds unless tensions in T1 are reduced for long enough so that the “back-ground” tension is reduced to close to zero (<10 cm or so). Once this threshold is reached, a water table rise occurs within minutes (e.g. water table rise starting from around 1 m b.g.l. on 31 March) followed by a recession seen in all tensiometers. These
HESSD
9, 8455–8492, 2012Linking soil moisture balance and source-responsive
models
M. O. Cuthbert et al.
Title Page
Abstract Introduction
Conclusions References
Tables Figures
◭ ◮
◭ ◮
Back Close
Full Screen / Esc
Printer-friendly Version Interactive Discussion
Discussion
P
a
per
|
Dis
cussion
P
a
per
|
Discussion
P
a
per
|
Discussio
n
P
a
per
|
types of responses are shown consistently by the data for all the main recharge events throughout the monitored period.
3.3 Soil moisture data
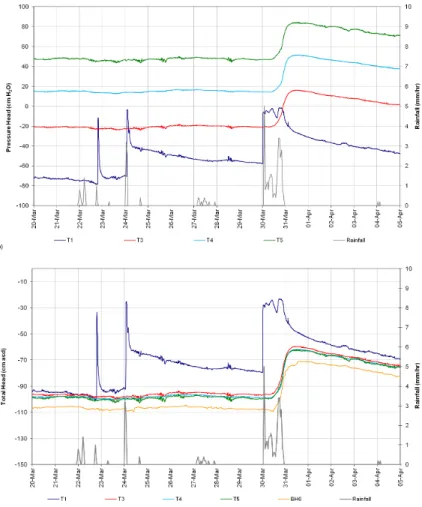
The general pattern of moisture content changes evident from the TDR data is con-sistent with the hydrodynamics inferred from the tensiometer data (Fig. 5). In
partic-5
ular a zone of low moisture contents between 40–60 cm b.g.l. is consistent with the compacted base of plough/topsoil seen in the geological logs. However, there is large uncertainty in the absolute values in moisture content due to the lack of site specific calibration for the instrument (Cuthbert, 2006). Given the low temporal resolution of the data, the TDR data cannot be used to infer much more information about the
hydrody-10
namics than the pressure data in this instance.
4 Discussion and modelling
4.1 Conceptual model
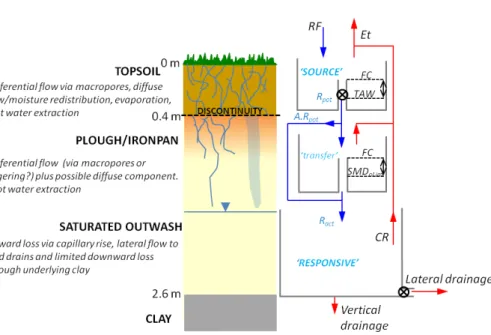
The key observations so far described lead us to form the following conceptual model of the hydraulic processes operating at the field site. Figure 6 summarises this visually
15
as well as incorporating the main features included in the numerical model described later.
The profile above the low permeability glaciolacustrine deposits (at 2.6 m b.g.l.) can be subdivided into three main horizons comprising (1) “topsoil” – loose organic rich sandy material which is disturbed by ploughing, (2) a partially cemented and
com-20
HESSD
9, 8455–8492, 2012Linking soil moisture balance and source-responsive
models
M. O. Cuthbert et al.
Title Page
Abstract Introduction
Conclusions References
Tables Figures
◭ ◮
◭ ◮
Back Close
Full Screen / Esc
Printer-friendly Version Interactive Discussion
Discussion
P
a
per
|
Dis
cussion
P
a
per
|
Discussion
P
a
per
|
Discussio
n
P
a
per
It is apparent that preferential flow processes are in operation in the topsoil from the extremely quick responses observed in the tensiometer T1. T1 is most likely associ-ated with macropore(s) which become active only if rainfall intensity and antecedent conditions are favourable. Once the macropores are active, flow occurs rapidly to the level of T1 while “abstraction” (sensu Hincapie and Germann, 2009) of water is also
oc-5
curring from the macropores to the soil matrix. The pan horizon is likely to have a much lower vertical matrix hydraulic conductivity than the overlying topsoil. Thus persistent hydraulic gradients between the topsoil-pan layer and pan-outwash layer may not nec-essarily be evidence of significant matrix flow. The lack of water table rise during the last 10 days of March is evidence of this – on 22 March hydrostatic conditions are
10
evident throughout the whole profile with a levelling offof the water table presumably having reached the level of the field drains. Despite the topsoil responding to rainfall events during the rest of the month with positive pressures building up, no response in any of the deeper tensiometers is seen until the large rainfall event on 31 March which initiates a recharge event as described below.
15
The ploughing activity is likely to truncate macropores developed in the topsoil from any established at deeper depths in the profile (Beven and Germann, 1982). This verti-cal discontinuity enables the macropores eventually to fill at the level of T1 but once the supply of water to the macropore reduces sufficiently or ceases entirely the redistribu-tion of moisture from the macropores to the matrix causes a quick recession of tension
20
back to the background level of the matrix. This background level of tension may be lower than that preceding the event due to the transfer of water from the macropore to the matrix during the event.
Furthermore, if the matrix tension of the upper soil profile above the level of the macropore truncation is reduced sufficiently (i.e. saturated conditions at the base of
25
HESSD
9, 8455–8492, 2012Linking soil moisture balance and source-responsive
models
M. O. Cuthbert et al.
Title Page
Abstract Introduction
Conclusions References
Tables Figures
◭ ◮
◭ ◮
Back Close
Full Screen / Esc
Printer-friendly Version Interactive Discussion
Discussion
P
a
per
|
Dis
cussion
P
a
per
|
Discussion
P
a
per
|
Discussio
n
P
a
per
|
while an upward flow gradient was present between T3 (85 cm b.g.l.) and T4 (129 cm b.g.l.). Second, water table rises are very rapid and occur without obvious departure from hydrostatic conditions in the unsaturated part of the outwash horizon. This may be indicative of preferential flow and near-instant re-equilibration of pressures through the moderate permeability near-saturated zone above the water table. Once the upper
5
layer is drained sufficiently, preferential flow in the lower layer ceases and the whole profile exhibits recession, presumably due to lateral drainage to field drains (the under-lying glaciolacustrine clay is of very low permeability). During much of the year apart from the warmest summer period, the water table is very shallow and the whole pro-file close to saturation and water transfer to the matrix during macropore flows within
10
the outwash deposits is minimal. During very dry periods when the evapotranspirative demand is higher and rooting depths greater moisture may be removed directly from both the topsoil and the upper part of the outwash deposits, and an upward flow gradi-ent may develop within the outwash horizon, contributing to the water table recession during this period. Summer storms may quickly activate macropores in the topsoil and
15
macropores in the lower profile may also become active under prolonged rainfall en-abling groundwater recharge to occur. In this case water transfer to the matrix of the outwash horizon may be higher depending on the deficit that has accumulated in this zone and actual recharge may be less than the potential recharge leaving the topsoil.
4.2 Hypothesis testing: what type of flow process dominates the
20
recharge response?
The conceptual model described above uses several strong lines of evidence for pref-erential flow through both the topsoil and the outwash deposits beneath. We consider that the tensiometer responses in combination with the direct observations of macro-pores within the topsoil are conclusive in this respect for this layer. The significance
25
HESSD
9, 8455–8492, 2012Linking soil moisture balance and source-responsive
models
M. O. Cuthbert et al.
Title Page
Abstract Introduction
Conclusions References
Tables Figures
◭ ◮
◭ ◮
Back Close
Full Screen / Esc
Printer-friendly Version Interactive Discussion
Discussion
P
a
per
|
Dis
cussion
P
a
per
|
Discussion
P
a
per
|
Discussio
n
P
a
per
evidenced by the tensiometers seems to be incontrovertible evidence that preferential flow does occur at certain times. Under higher moisture content conditions however, it is not obvious whether the observed quick water table responses can be accounted for using conventional unsaturated zone theory. In this section we explore the hypothesis that water table responses can be explained using 1-D Darcy-Buckingham type flow
5
through the outwash deposits.
We have achieved this through the use of the variably saturated flow modelling code FAT3D-UNSAT to model 1-D water flow through the profile with Richards’ equation us-ing hourly forcus-ing climate data described in Sect. 2.3. FAT3D-UNSAT solves Richards’ equation for heterogeneous single porosity media using a block centred finite diff
er-10
ence formulation with backward differences in time and central differences in space. Soil properties are described by the van Genuchten (1980)–Mualem (1976) soil mois-ture characteristic equations. Boundary conditions are assumed to be piece-wise con-stant over timesteps. A Newton-Raphson scheme with damping is employed to solve the resulting non-linear equations. Time stepping is automatic to ensure stability and
15
convergence of the solution. The code has been extensively verified against HYDRUS (Simunek et al., 2011) and analytical models for a range of problems and is found to provide excellent agreement with the comparison solutions. In addition to piecewise general head and flux boundary conditions, FAT3D-UNSAT can model seepage bound-ary conditions, and variable evapotranspiration controlled by soil moisture content.
Au-20
tomatic calibration is not possible with the tool and a process of manual calibration for the modelling was undertaken. A model grid was employed with uniform one centime-tre vertical cell resolution to model the top 2.6 m of the profile to the depth of the base of the outwash deposits The initial and boundary conditions used for the analysis of the field site are as follows.
25
HESSD
9, 8455–8492, 2012Linking soil moisture balance and source-responsive
models
M. O. Cuthbert et al.
Title Page
Abstract Introduction
Conclusions References
Tables Figures
◭ ◮
◭ ◮
Back Close
Full Screen / Esc
Printer-friendly Version Interactive Discussion
Discussion
P
a
per
|
Dis
cussion
P
a
per
|
Discussion
P
a
per
|
Discussio
n
P
a
per
|
head with depth was used with the water table at−0.96 m b.g.l. for the initial condition with a gradient of−0.9 representing a gentle downward flux condition. The calibration period was insensitive to alteration of the initial condition.
Boundary conditions were applied as follows: the hourly precipitation from the near-est rain gauge was added to the top boundary node uniformly over each hour. Potential
5
evapotranspiration was applied uniformly over each calendar month based on the avail-able MORECS data. Actual evapotranspiration was calculated for each node of the top 10 cm of the soil profile based on the moisture content using the following formula:
AE=fPE; θ≥0.2
AE=fPE/10; 0.2≥θ≥0.1
10
AE=0; θ≤0.1 (1)
whereθ=moisture content,f =fraction of the top 10 cm of soil occupied by the node. The top node was set to remove excess pressure head by lateral drainage when the pore pressure exceeds zero. In the saturated zone lateral flows were implemented
15
using a general head boundary condition for all nodes from 1.2 m b.g.l. to the base of the outwash. Physical properties are defined for a range of soil types and these can be assigned to the cells of the model to create a layered model.
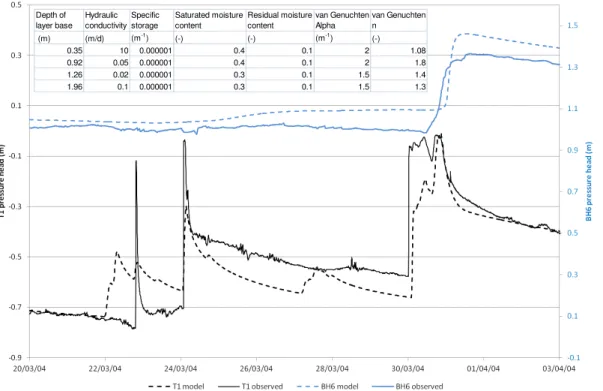
A variety of layer thicknesses and parameter combinations were used to attempt to simulate the observed response in the tensiometers and piezometer. Based on a
care-20
ful sequence of calibrations it could be shown that there are many layering and pa-rameter combinations that give similar responses, but none were found that simulated well the responses seen in T1. A typical “best fit” is shown in Fig. 7. The inability for a relatively complex single domain 1-D Richards’ equation model to simulate the ob-served hydraulic response supports our qualitative interpretation that preferential flow
25
processes are operating in the topsoil.
HESSD
9, 8455–8492, 2012Linking soil moisture balance and source-responsive
models
M. O. Cuthbert et al.
Title Page
Abstract Introduction
Conclusions References
Tables Figures
◭ ◮
◭ ◮
Back Close
Full Screen / Esc
Printer-friendly Version Interactive Discussion
Discussion
P
a
per
|
Dis
cussion
P
a
per
|
Discussion
P
a
per
|
Discussio
n
P
a
per
sufficiently high (a high value for the van Genuchtennparameter). However, for mod-els that achieve this feature of the observed data, “unwanted” water table responses are simulated during other periods, for example the significant early rise of the water table beginning on 24 March 2004 in Fig. 7. We were unable to achieve the threshold behaviour seen in the field data (whereby large variations in pressure within the topsoil
5
do not cause water table perturbations until near-positive pressures are reached at the base of the topsoil) with this type of model using plausible parameters for a porous ma-trix of outwash materials. Thus we can reject the hypothesis that water table responses can be explained by solely invoking 1-D Darcy-Buckingham type flow through the out-wash deposits and that preferential flow may also contribute to the recharge response
10
during the winter period. It is not possible to quantify the relative contribution from ma-trix and preferential modes or which type of preferential flow process is occurring, e.g. whether fingering or macropore flow. In addition to testing our hypothesis, this mod-elling exercise also proved useful in demonstrating the significance of the pan layer discontinuity in restricting/moderating flow from the overlying more permeable topsoil,
15
consistent with the conceptual model described above.
4.3 A parsimonious modelling approach
4.3.1 The need for simple preferential flow models
Based on the discussion so far, it is clear that a complex set of hydraulic processes con-trol recharge to the shallow water table at the field site. It is likely that both
capillary-20
dominated matrix flow and preferential flow processes interact to give the observed response. Modelling these processes using state-of-the-art dual permeability models requires many input flow parameters for each medium type. For example, as outlined by Simunek et al. (2003), the Gerke and van Genuchten (1993) approach requires 16 parameters (or possibly 11 if various other assumptions are made) or if a kinematic
25
HESSD
9, 8455–8492, 2012Linking soil moisture balance and source-responsive
models
M. O. Cuthbert et al.
Title Page
Abstract Introduction
Conclusions References
Tables Figures
◭ ◮
◭ ◮
Back Close
Full Screen / Esc
Printer-friendly Version Interactive Discussion
Discussion
P
a
per
|
Dis
cussion
P
a
per
|
Discussion
P
a
per
|
Discussio
n
P
a
per
|
11 parameters are needed for each soil type. Thus, to model the profile described in this paper would require between 18 and 32 parameters for a two layer model (e.g. topsoil and outwash) or 27 to 48 parameters for a 3-layer case (e.g. topsoil, plough pan, outwash), just to characterise the water flow (additional parameters are needed for other aspects such as root water uptake). Such models and their inherent
compu-5
tational demands are of little use for estimating groundwater recharge at the field and catchment scale and more parsimonious approaches are very desirable. We propose the following approach.
4.3.2 Model structure
The model couples a modification of an established soil moisture balance model of the
10
topsoil with a simplified preferential flow model of the outwash deposits. A schematic outline is shown in Fig. 6.
The SMBM for the topsoil is modified from that developed for use in regional ground-water models in the UK as described by Hulme et al. (2001) and Rushton et al. (2006) which makes use of a combined crop co-efficient approach (Kc) and other concepts
15
taken from Allen et al. (1998). The total available water (TAW) in the soil is defined as:
TAW=(θFCθWP)Zr(1−B)+(θFC−0.5θWP)ZeB (2)
where θFC and θWP are fractional soil moisture contents at field capacity (FC) and wilting point (WP),Zr is the rooting depth of crop,Ze is the thickness of the soil layer
20
subject to drying by evaporation,B=fractional area of bare soil (i.e. crop absent). The readily available water (RAW) is defined as:
RAW=pTAW (3)
where p is a factor normally between 0.2 and 0.7 (Allen et al., 1998, Table 22). If
25
HESSD
9, 8455–8492, 2012Linking soil moisture balance and source-responsive
models
M. O. Cuthbert et al.
Title Page
Abstract Introduction
Conclusions References
Tables Figures
◭ ◮
◭ ◮
Back Close
Full Screen / Esc
Printer-friendly Version Interactive Discussion
Discussion
P
a
per
|
Dis
cussion
P
a
per
|
Discussion
P
a
per
|
Discussio
n
P
a
per
AE=KsPE (4)
Ks=(TAW-SMDs)/(TAW-RAW) (5)
where potential evapotranspiration, PE=KcPE and PE is the reference crop (grass) potential evapotranspiration rate.
5
Using an input time series for rainfall (RF) and PE, the model algorithms calculate time series of AE and the rate of potential groundwater recharge (Rpot). Overland flow has been assumed to be zero with all rainfall becoming infiltration. On days where the soil is under stress and rainfall occurs that is less than PE the rainfall is transpired plus a further amount from the soil equal to the remaining evaporative demand modified by
10
the stress co-efficient. If rainfall exceeds the PE then the excess reduces the SMD. If the SMD becomes positive, this water is accumulated in a store (of amountD) and released as potential recharge (Rpot) to the outwash deposits according to a limiting flux based on Nimmo’s (2010) source-responsive model:
Rpot=VuLuMlim∆t forD > VuLuMlim∆t elseRpot=D (6)
15
whereVuLuis the product of the film flow velocity and film thickness,Mlimis the
macro-pore facial area density and ∆t is the model timestep. A constant default value of VuLu=5.5×10⁻¹⁰m2/s−1
was assumed, withMlimtreated as the controlling variable. If, after satisfying the demands of the topsoil, there is a remaining evapotranspirative
20
demand (PEr), this is taken as capillary rise (CR) from the water table (at depth b.g.l.= GWL) within the outwash deposits using the following algorithm based on an extinction depth (L) concept:
CR=PEr(L−GWL)/L (7)
25
HESSD
9, 8455–8492, 2012Linking soil moisture balance and source-responsive
models
M. O. Cuthbert et al.
Title Page
Abstract Introduction
Conclusions References
Tables Figures
◭ ◮
◭ ◮
Back Close
Full Screen / Esc
Printer-friendly Version Interactive Discussion
Discussion
P
a
per
|
Dis
cussion
P
a
per
|
Discussion
P
a
per
|
Discussio
n
P
a
per
|
Ract=ARpot (8)
where A is a constant factor between 0 and 1, or else, Ract is simply equal to Rpot This can be thought of as a “bypass” mechanism whereby a constant proportion of the potential recharge available from the topsoil bypasses the plough pan layer becoming
5
actual recharge. Alternatively this could be considered as a very simple dual porosity formulation for governing preferential flow whereby an amount equal to (1−A)Rpot is transferred from macropores to matrix contingent on the presence of a moisture deficit in the matrix.
It is assumed that the vertical loss to the underlying clay is insignificant and thus the
10
elevation of the water table (WT) above the elevation of the field drains (at depth=FD) is controlled by the balance of lateral drainage, capillary rise and groundwater recharge as follows:
dW T dt =
Ract−CR Sy
−W T
τ (9)
wheret is time,τ is a recession constant andSy is the specific yield, and WT=FD−
15
GWL.
The resulting number of hydraulic parameters controlling the recharge behaviour (i.e. ignoring the crop aspects) is just six (θFC,θWP,Mlim,L,A, SMDoLim) with an additional
3 parameters for controlling the resulting water table fluctuation (τ,Sy, FD).
4.3.3 Model results and discussion
20
HESSD
9, 8455–8492, 2012Linking soil moisture balance and source-responsive
models
M. O. Cuthbert et al.
Title Page
Abstract Introduction
Conclusions References
Tables Figures
◭ ◮
◭ ◮
Back Close
Full Screen / Esc
Printer-friendly Version Interactive Discussion
Discussion
P
a
per
|
Dis
cussion
P
a
per
|
Discussion
P
a
per
|
Discussio
n
P
a
per
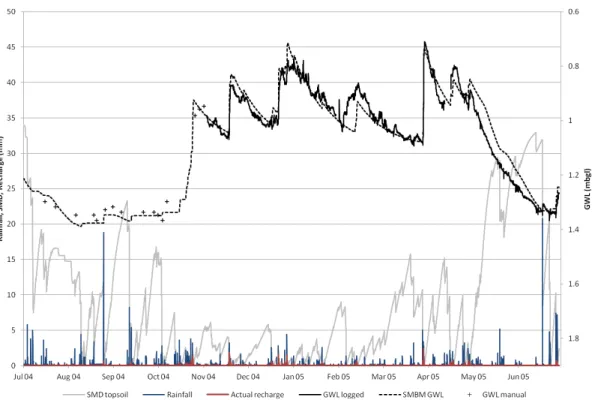
1. During the winter period (November 2004 to April 2005) AE was always equal to PE and the water table responses were effectively governed by the forcing data and just three parameters –Sy,τandMlim. The model was run for this period with an initial water level equal to the observed water table elevation and as a starting point, optimised to maximise the Nash-Sutcliffe efficiency. As is often the case
5
with this type of optimisation, multiple parameter sets can yield similarly good fits by this criteria but it was found that the model fit was always poor during February 2005. Assuming that the specific yield of the outwash materials does not change with time, it is physically impossible for rainfall as measured at Bowling Green to generate the observed water table rises at the site even in the absence of
10
any evapotranspiration during this period. Thus, we can only assume that the site rainfall at this time was significantly higher than that at Bowling Green. Removing this period from the optimisation enabled a fit to be made with a higher Nash-Sutcliffe efficiency of 0.9 for a physically realistic value ofSy as given in Table 1.
2. Having fixed these parameters, the whole period was then modelled. Soil/crop
15
parameters (θFC, θWP,Ze, Kc,p, SMDoLim,B) were estimated using mid-range values directly from Allen et al. (1998) and the remaining unconstrained parame-ters (L,A) varied manually to achieve a best fit.
The best fit is shown in Fig. 8 with corresponding model parameters given in Table 1 having a good Nash-Sutcliffe efficiency of 0.89. Despite the complex processes
occur-20
ring in the topsoil, the SMBM approach is very effective at predicting the timing of the main recharge events. The magnitude of the recharge events is as uncertain as the forcing meteorological data but the fitted value of around 6 % forSy is certainly phys-ically plausible given the nature of the outwash materials. Over the year modelled the 676 mm of rainfall is distributed by the model into 559 mm of AE and 123 mm of actual
25
HESSD
9, 8455–8492, 2012Linking soil moisture balance and source-responsive
models
M. O. Cuthbert et al.
Title Page
Abstract Introduction
Conclusions References
Tables Figures
◭ ◮
◭ ◮
Back Close
Full Screen / Esc
Printer-friendly Version Interactive Discussion
Discussion
P
a
per
|
Dis
cussion
P
a
per
|
Discussion
P
a
per
|
Discussio
n
P
a
per
|
in the soil and outwash deposits. The general shape of the groundwater recessions are also simulated well using the combination of a recession constant for lateral flows and extinction-depth-controlled capillary rise for vertical losses. Furthermore, given the extremely simple representation of exchange between the preferential and matrix do-mains used, the model is able to simulate reasonably well the summer recharge events
5
which occur in both years using a value of 0.5 for the bypass factorA.
During the winter, the shape of the water table rise is most sensitive to the parameter Mlim which controls the rate of drainage of potential recharge from the topsoil into the outwash deposits. Figure 9 shows the detailed response for two large recharge events simulated by the model, and sensitivity to this parameter. The model works well forMlim
10
between 250 and 750 m−1. There is a suggestion from the data that larger recharge events lead to steeper water table responses. With a longer data series to work from it may be possible to re-structure the model to accommodate a variableM value and also introduce a time varying active area fraction as suggested by Nimmo (2010). As in the water-table fluctuation case study presented by Nimmo (2010), our model’s
assump-15
tion of immediate water table response to water arriving at land surface neglects the time lag inherent from the finite speed of transit through the unsaturated zone. For a re-sponse dominated by preferential flow, however, the assumed zero transit time may be an adequate approximation for a response time that is orders of magnitude faster than the other, nonpreferential, flow processes occurring through the medium. For greater
20
realism, a finite time lag could be incorporated to correct for this, though at the cost of increased model complexity. We consider that the model as presented here performs acceptably given the simple parameterisation implemented.
Other approaches to modify SMBMs to account for preferential flow have been sug-gested in the literature. In particular, the use of a one layer SMBM with an additional
25
HESSD
9, 8455–8492, 2012Linking soil moisture balance and source-responsive
models
M. O. Cuthbert et al.
Title Page
Abstract Introduction
Conclusions References
Tables Figures
◭ ◮
◭ ◮
Back Close
Full Screen / Esc
Printer-friendly Version Interactive Discussion
Discussion
P
a
per
|
Dis
cussion
P
a
per
|
Discussion
P
a
per
|
Discussio
n
P
a
per
rainfall to bypass the soil zone to account for groundwater level fluctuations in the sum-mer months. Typically, a rainfall threshold is used above which a constant proportion of rainfall may become recharge. Such an approach was tested for this site and found to be rather unsuccessful. Although summer water table responses could be simu-lated to some extent using a rainfall threshold for bypass flow, the end of summer rise
5
and the beginning of summer recession could not simultaneously be modelled well. A greater sensitivity to antecedent moisture conditions is required than this type of simple bypass model accounts for. The new model developed in this paper represents a significant step forward by putting the modelled bypass concept on a more physical basis informed by the observed field data.
10
5 Conclusions
Examination of recharge-related processes using previously unpublished data at a field site in Shropshire, UK reveals significant influence of both diffuse and preferential flow. Much of the time, hydraulic gradients and water fluxes at this site follow expected pat-terns based on traditional unsaturated flow theory. Sometimes, however, the data show
15
behaviour not explainable by this theory alone. For example, a rising water table that in-dicates positive recharge sometimes occurs while measured hydraulic gradients in the unsaturated zone suggest flow should be upward. A relatively complex single-domain 1-D Richards’ equation model is incapable of consistently simulating the observed hy-draulic response over a period that includes evidence of preferential and diffuse flow,
20
thus supporting our qualitative interpretation that preferential flow processes are op-erating in the topsoil. Reasonable fits with the Richard’s equation-based model were obtained for certain tensiometer and piezometer data, and for sharp water table rises as long as the retention capacity of the medium is sufficiently high. However, the Richards equation-based model generated unwanted water table responses during other
pe-25
HESSD
9, 8455–8492, 2012Linking soil moisture balance and source-responsive
models
M. O. Cuthbert et al.
Title Page
Abstract Introduction
Conclusions References
Tables Figures
◭ ◮
◭ ◮
Back Close
Full Screen / Esc
Printer-friendly Version Interactive Discussion
Discussion
P
a
per
|
Dis
cussion
P
a
per
|
Discussion
P
a
per
|
Discussio
n
P
a
per
|
seen when large variations in pressure within the topsoil do not cause water table per-turbations until the pressure at the base of the topsoil becomes nearly positive.
Soil moisture balance models are attractive for estimation of recharge, being straight-forward to apply and having a sound basis in the conservation of water within the land/atmosphere system. But neglecting certain important processes, such as
pref-5
erential flow, a SMBM may often require some augmentation or refinement to pro-duce reliable recharge estimates. We developed a practical and parsimonious mod-elling approach for aquifer-recharge estimation based on well-known SMBMs coupled with the recently developed responsive model for preferential flow. The source-responsive preferential flow model is in several ways an advantageous choice for
aug-10
menting the SMBM approach. Like the SMBM, the SRPF model is easy to implement, parameterize, and compute. It attends directly to factors that play a strong role in prefer-ential flow, like the temporal character of water input. It is conceptually compatible with SMBMs in recognizing that the presence or absence of a source of water in various positions within the soil profile dictates the hydrologically important flow phenomena,
15
often much more than do the traditional Darcian driving forces and hydraulic charac-terizations of the medium. The combined SMB-SRPF model accounts for aspects of both soil architecture and preferential flow. Furthermore it is parsimonious, having just six parameters controlling water flow (θFC,θWP,Mlim,L,A, and SMDoLim; excluding the crop parameters).
20
Despite the complexity of active hydraulic processes at locations such as the Shrop-shire site, the SMB-SRPF model is very effective at predicting the timing of the main recharge events. The general shape of the groundwater recessions are also simulated well using the combination of a recession constant for lateral flows and extinction-depth-controlled capillary rise for vertical losses. With an extremely simple
represen-25
HESSD
9, 8455–8492, 2012Linking soil moisture balance and source-responsive
models
M. O. Cuthbert et al.
Title Page
Abstract Introduction
Conclusions References
Tables Figures
◭ ◮
◭ ◮
Back Close
Full Screen / Esc
Printer-friendly Version Interactive Discussion
Discussion
P
a
per
|
Dis
cussion
P
a
per
|
Discussion
P
a
per
|
Discussio
n
P
a
per
deposits created due to ploughing. The existence of many similar physical systems suggests that the model may have wide applicability.
This combination of models also holds promise for improvements in the SRPFM of Nimmo (2010). In particular it should help to explain the effects of thresholds and antecedent water on preferential flow, which are handled directly in SMBM but not in
5
the SRPFM. The successful combination demonstrated here also shows how layers within the subsurface can serve as sources for water supplying preferential flow, much like the surface-applied water sources considered by Nimmo (2007).
Further work will refine and extend the approach to other field applications and allow for upscaling to improve estimates of recharge timing and magnitude at the
catch-10
ment scale. Thus insights and concepts from this combined modelling can also lead to progress in the treatment of general preferential flow and water-resource issues, in addition to more realistic accounting for the diverse modes of unsaturated flow affecting recharge
Acknowledgement. The fieldwork was funded under the UK Natural Environment Research
15
Council’s Lowland Catchment Research (LOCAR) thematic programme. The authors would like to express thanks to the local farmer who gave permission for field access and to staffand students at The University of Birmingham for help with fieldwork. Thank you to all those, and Andrew Ireson in particular, who gave helpful suggestions regarding a poster version of this paper at EGU 2012.
20
References
Allaire-Leung, S. E., Gupta, S. C., and Moncrief, J. F.: Water and solute movement in soil as influenced by macropore characteristics – 1. Macropore continuity, J. Contam. Hydrol., 41, 283–301, 2000.
Allen, R. G., Pereira, L. S., Raes, D., and Smith, M.: Crop evapotranspiration – Guidelines for
25
HESSD
9, 8455–8492, 2012Linking soil moisture balance and source-responsive
models
M. O. Cuthbert et al.
Title Page
Abstract Introduction
Conclusions References
Tables Figures
◭ ◮
◭ ◮
Back Close
Full Screen / Esc
Printer-friendly Version Interactive Discussion
Discussion
P
a
per
|
Dis
cussion
P
a
per
|
Discussion
P
a
per
|
Discussio
n
P
a
per
|
Alley, W. M.: On the treatment of evapotranspiration, soil moisture accounting, and aquifer recharge in monthly water balance models, Water Resour. Res., 20, 1137–1149, 1984. Andreini, M. S. and Steenhuis, T. S.: Preferential paths of flow under conventional and
conser-vation tillage, Geoderma, 46, 85–102, 1990.
Beven, K. and Germann, P.: Macropores and water flow in soils, Water Resour. Res., 18, 1311–
5
1325, 1982.
Butler, A. P., Hughes, A. G., Jackson, C. R., Ireson, A. M., Parker, S. J., Wheater, H. S., and Peach, D. W.: Advances in modelling groundwater behaviour in chalk catchments (in ground-water resources modelling; a case study from the UK), Geol. Soc. Spec. Publ., 364, 113–127, 2012.
10
Cuthbert, M. O.: Hydraulic processes controlling recharge through glacial drift, PhD thesis, University of Birmingham, UK, 2006.
Cuthbert, M. O.: An improved time series approach for estimating groundwater recharge from groundwater level fluctuations, Water Resour. Res., 46, W09515, doi:10.1029/2009WR008572, 2010.
15
Cuthbert, M. O. and Tindimugaya, C.: The importance of preferential flow in controlling ground-water recharge in tropical Africa and implications for modelling the impact of climate change on groundwater resources, J. Water Clim. Change, 1, 234–245, 2010.
Cuthbert, M. O., Mackay, R., Tellam, J. H., and Barker, R. D.: The use of electrical resistivity tomography in deriving local scale models of recharge through superficial deposits, Q. J.
20
Eng. Geol. Hydroge., 42, 199–209, 2009.
Cuthbert, M. O., Mackay, R., Tellam, J. H., and Thatcher, K. E.: Combining unsaturated and sat-urated zone hydraulic observations for understanding and estimating groundwater recharge through glacial till, J. Hydrol., 391, 263–276, 2010.
Gerke, H. H. and van Genuchten, M. T.: A dual porosity model for simulating the preferential
25
movement of water and solutes in structured porous media, Water Resour. Res., 29, 305– 319, 1993.
Greswell, R., Ellis, P., Cuthbert, M., White, R., and Durand, V.: The design and application of an inexpensive pressure monitoring system for shallow water level measurement, tensiometry and piezometry, J. Hydrol., 373, 416–425, doi:10.1016/j.jhydrol.2009.05.001, 2009.
30
HESSD
9, 8455–8492, 2012Linking soil moisture balance and source-responsive
models
M. O. Cuthbert et al.
Title Page
Abstract Introduction
Conclusions References
Tables Figures
◭ ◮
◭ ◮
Back Close
Full Screen / Esc
Printer-friendly Version Interactive Discussion
Discussion
P
a
per
|
Dis
cussion
P
a
per
|
Discussion
P
a
per
|
Discussio
n
P
a
per
Healy, R. W.: Estimating Groundwater Recharge, Cambridge University Press, Cambridge, 256 pp., 2010.
Healy, R. W. and Cook, P. G.: Using groundwater levels to estimate recharge, Hydrogeol. J., 10, 91–109, 2002.
Heathcote, J. A., Lewis, R. T., and Soley, R. W. N.: Rainfall routing to runoffand recharge for
5
regional groundwater resource models, Q. J. Eng. Geol. Hydroge., 37, 113–130, 2003. Hincapi ´e, I. and Germann, P.: Abstraction from infiltrating water content waves during weak
viscous flow, Vadose Z. J., 8, 996–1003, doi:10.2136/vzj2009.0012, 2009.
Hough, M. N. and Jones, R. J. A.: The United Kingdom Meteorological Office rainfall and evap-oration calculation system: MORECS version 2.0-an overview, Hydrol. Earth Syst. Sci., 1,
10
227–239, doi:10.5194/hess-1-227-1997, 1997.
Ireson, A. M. and Butler, A. P.: Controls on preferential recharge to Chalk aquifers, J. Hydrol., 398, 109–123, 2011.
Lerner, D. N., Issar, A. S., and Simmers, I.: Groundwater Recharge, a Guide to Understanding and Estimating Natural Recharge, Report 8, International Association of Hydrogeologists,
15
Kenilworth, 345 pp., 1990.
Hulme, P., Rushton, K. R., and Fletcher, S.: Estimating recharge in UK catchments. Impact of Human Activity on Groundwater Dynamics (Proceedings of a symposium held during the Sixth IAHS Scientific Assembly at Maastricht, The Netherlands, July 2001), Maastricht, The Netherlands, IAHS, 33–42, 2001.
20
Mander, R. G. and Greenfield, B. J.: Hydrograph generation and augmented flow analysis, Thames Groundwater Scheme, Institution of Civil Engineers, 47–59, 1978.
Mualem, Y.: A new model for predicting the hydraulic conductivity of unsaturated porous media, Water Resour. Res., 12, 513–522, 1976.
Nimmo, J. R.: Theory for source-responsive and free-surface film modeling of unsaturated flow,
25
Vadose Z. J., 9, 295–306, doi:10.2136/vzj2009.0085, 2010.
Nimmo, J. R., Stonestrom, D. A., and Akstin, K. C.: The feasibility of recharge rate determina-tions using the steady-state centrifuge method, Soil Sci. Soc. Am. J., 58, 49–56, 1994. Nimmo, J. R., Healy, R. W., and Stonestrom, D. A.: Aquifer recharge, in: Encyclopedia of
Hy-drological Science, edited by: M. G. Anderson and J. Bear, Vol. 4, Wiley, Chichester, UK,
30
HESSD
9, 8455–8492, 2012Linking soil moisture balance and source-responsive
models
M. O. Cuthbert et al.
Title Page
Abstract Introduction
Conclusions References
Tables Figures
◭ ◮
◭ ◮
Back Close
Full Screen / Esc
Printer-friendly Version Interactive Discussion
Discussion
P
a
per
|
Dis
cussion
P
a
per
|
Discussion
P
a
per
|
Discussio
n
P
a
per
|
Rosenbom, A. E., Ernstsen, V., Fl ¨uhler, H., Jensen, K. H., Refsgaard, J. C., and Wydler, H.: Fluorescence imaging applied to tracer distributions in variably saturated fractured clayey till, J. Environ. Qual., 37, 448–458, doi:10.2134/jeq2007.0145, 2008.
Rushton, K. R., Eilers, V. H. M., and Carter, R. C.: Improved soil moisture balance methodology for recharge estimation, J. Hydrol., 318, 379–399, 2006.
5
Scanlon, B. R., Healy, R. W., and Cook, P. G.: Choosing appropriate techniques for quantifying groundwater recharge, Hydrogeol. J., 10, 18–39, 2002.
Shipitalo, M. J. and Edwards, W. M.: Effects of initial water content on macropore/matrix flow and transport of surface-applied chemicals, J. Environ. Qual., 25, 662–670, 1996.
ˇ
Sim ˚unek, J., Jarvis, N. J., van Genuchten, M. T., and Gardenas, A.: Review and comparison
10
of models for describing non-equilibrium and preferential flow and transport in the vadose zone, J. Hydrol., 272, 14–35, 2003.
ˇ
Sim ˚unek, J., van Genuchten, M. T., and ˇSejna, M.: The HYDRUS Software Package for Simulat-ing Two- and Three-Dimensional Movement of Water, Heat, and Multiple Solutes in Variably-Saturated Media, Technical Manual, Version 2.0, PC Progress, Prague, Czech Republic,
15
258 pp., 2011.
Streetly, M. and Shepley, M. G.: Final Report, East Shropshire Permo-Triassic Sandstone Groundwater Modelling Project – Task 8, Report of the Environment Agency of England and Wales, UK, 2005.
Su, G. W., Nimmo, J. R., and Dragila, M. I.: Effect of isolated fractures on
20
accelerated flow in unsaturated porous rock, Water Resour. Res., 39, 1326, doi:http://dx.doi.org/10.1029/2002WR00169110.1029/2002WR001691, 2003.
Thatcher, K. E.: Spatial characterisation and stochastic analysis of unsaturated flows and groundwater recharge through glacial drift, PhD thesis, University of Birmingham, UK, 2009. van Genuchten, M. T.: A closed-form equation for predicting the hydraulic conductivity of
unsat-25