F
ACULDADE DE
C
IÊNCIAS
D
EPARTAMENTO DE
B
IOLOGIA
V
EGETAL
Identification and
fingerprinting of cork fungi:
a phenetic approach
Beatriz Reis Oliveira
M
ESTRADO EM
M
ICROBIOLOGIA
A
PLICADA
F
ACULDADE DE
C
IÊNCIAS
D
EPARTAMENTO DE
B
IOLOGIA
V
EGETAL
Identification and
fingerprinting of cork fungi:
a phenetic approach
Dissertação orientada por Dra. Maria Vitória San Romão (IBET/ITQB)
e Prof. Dr. Rogério Tenreiro (FCUL-BioFIG)
Beatriz Reis Oliveira
M
ESTRADO EM
M
ICROBIOLOGIA
A
PLICADA
Identification and
fingerprinting of cork fungi:
a phenetic approach
Beatriz Reis Oliveira
M
ASTER
T
HESIS
2011
This thesis was fully performed at the Instituto de Biologia Experimental e
Tecnológica e Instituto de Tecnologia Química e Biológica (IBET/ITQB
–
UNL) under the direct supervision of Dra. Maria Vitória San Romão.
Prof. Dr. Rogério Tenreiro was the internal designated supervisor in the
scope of the Master in Applied Microbiology of the Faculty of Sciences of the
University of Lisbon and also participated as direct co-supervisor.
I was only able to reach this point because I have never been alone while preparing and writing my thesis. Throughout this year I had many people who encouraged me and gave me strength to see the positive side of the work even when it was not going so well.
I would like to thank the Instituto de Biologia Experimental e Tecnológica e Instituto de Tecnologia Química Biológica for the opportunity to conduct this experiment at their laboratories.
I would like to thank my supervisor Dra. Maria Vitória San Romão for all her support and dedication during this year. For being so demanding of me and for all the relaxing moments we had. This made me work harder and get more involved in the project. Let me add how pleased I was in finding someone who likes molds as much as I do! It was a pleasure to work with such an amazing teacher.
I would also like to thank my co-supervisor Prof. Dr. Rogério Tenreiro for his willingness and promptness in meeting with me and clearing all my doubts. For forcing me to think rationally and showing me a wider vision of the subject. Also to Prof. Lélia Chambel for all the times that I bothered her with doubts about BioNumerics. Thanks for all the support.
To my laboratory colleagues who helped me integrate into the group when I arrived and for being so kind to me. Thanks for answering all my questions, even the most basic ones, and for sharing their experienced opinion. Thank you all for being there! Also to Carmo Barreto that has explained me all the previous work done and has given me all the information I needed to complete this project.
Also, to my friends who were always patient enough to hear me talk about my work, even without understanding anything (I know that sometimes I can be a bit boring)! For respecting my choice to stay home when they wanted to have fun but also for showing me that work is not everything.
Finally, to the most important people in my life for their unconditional support to help me always follow my dreams. To my family a huge thank you!
The industry of cork stoppers is extremely important for Portuguese economy so there has been always a huge investment in this market row. The manufacture process of cork stoppers includes a series of stages that can favor molds development on cork planks. As a result, some compounds can be produced being a source of unpleasant flavors (such as cork taint of wine).
At IBET exists a collection of fungi isolated along the years from different stages of cork stoppers manufacture process. A sample composed by 198 fungi was randomly chosen from that culture collection and was analyzed phenotypic and molecularly.
Macroscopically, features like diameter, texture and color have been observed. For color coding an optimization was made in order to minimize the subjectivity associated to this parameter. Microscopic slides were prepared trying to describe the different reproductive structures of each isolate. For molecular techniques, the core sequence of phage M13 and [HVH(GACA)4] were used as primers for fungal DNA fingerprinting.
157 isolates from the genus Penicillium were identified and 26 fungi from the genus Aspergillus. Moreover, in a fewer proportion, it were also identified 2 fungi from the genus Chrysonilia, 3 fungi from Cladosporium genus, 5 from genus Mucor and 4 from genus Trichoderma.
Although DNA fingerprinting did not reveal full diagnostic power to separate the isolates at species level, the utilization of other primers in association with M13 and [HVH(GACA)4] may improve this analysis. Moreover, it was observed that phenotypic characterization allowed the identification of fungi up to genus level.
This characterization of the studied fungi complemented the information of each isolate of the culture collection. So, now the culture collection has more useful information and its access is facilitated.
Key-words: cork stoppers industry; fungi; phenotypic identification; DNA
inúmeras aplicações e pode ser reciclável. Por estes motivos, a cortiça é um produto muito rentável e para Portugal, sendo um dos maiores produtores de cortiça, tem sido muito importante para o desenvolvimento da economia. Em Portugal encontra-se cerca de 32% da distribuição mundial do sobreiro e em 2005 era o líder da exportação de cortiça num valor de 839 milhões de euros, dos quais 457 milhões devem-se à exportação de rolhas de cortiça.
O sobreiro é uma árvore de folha persistente, de crescimento lento mas de elevada longevidade, podendo atingir 250 a 350 anos de vida. É apenas aos 43 anos da árvore que a recolha de cortiça é própria para a produção de rolhas pois é mais macia e regular. A cortiça é um tecido vegetal composto por células mortas, dispostas regularmente sem espaços intercelulares livres. É muito porosa devido à existência de canais lenticulares mas é impermeável aos líquidos. É constituída por soberina, linhina, polissacáridos como a celulose e a hemicelulose, taninos e ceras.
As etapas de produção de rolhas de cortiça são numerosas. Inicia-se com o retirar das pranchas de cortiça da árvore e as que tiverem mancha amarela ou estiverem queimadas são postas de parte. Ocorre um período de maturação no exterior da fábrica, num piso inclinado para permitir a circulação de ar e drenagem das águas da chuva. Esta fase é importante para o aplanamento das pranchas e a eliminação de alguns compostos fenólicos, poeiras e insectos pela chuva. A próxima etapa é a cozedura das pranchas que leva ao aumento da humidade, da elasticidade e da espessura das mesmas, sendo assim mais fáceis de manusear. Segue-se um período de estabilização pós-cozedura de cerca de duas semanas para que a humidade não desça para níveis baixos. Ocorre num local bem ventilado e controlado para que não ocorra o crescimento descontrolado de microrganismos. Se este periodo de estabilização for muito longo, a humidade já baixou bastante então é necessário recorrer a uma segunda cozedura (menos demorada que a primeira) à qual se dá o nome de escalda. A etapa seguinte, rabaneação, consiste em cortar as pranchas em tiras e é seguida da brocagem que consiste em retirar porções redondas que vão constituir as rolhas. Por fim, ocorre uma separação das rolhas por classes (tamanho e aparência) e posterior lavagem e aclareamento das mesmas com água, peróxido de hidrogénio, ácido sulfâmico e metabissulfito de sódio. Em alguns casos, as rolhas podem ainda passar por um processo de colmatação para selar os poros da rolha.
através de estudos, sabe-se que esse manto corresponde ao micélio do fungo
Chrysonilia. Sabe-se também que este fungo é o único visível enquanto a
actividade de água se encontrar acima dos 0,9. No entanto, se o período de estabilização pós cozedura for longo, esta actividade de água diminui. Desta forma, outros fungos (por exemplo o género Penicillium), cujos esporos já existiam nas lenticelulas da cortiça, começam a germinar. Através de mais alguns estudos realizados sabe-se que Chrysonilia tem uma função importante na cortiça porque consegue degradar alguns compostos da parede celular da cortiça aumentando assim a maleabilidade desta e não produz 2,4,6-tricloroanisol (TCA) que é uma das principais causas do aparecimento do gosto a rolha nos vinhos. Por outro lado, os fungos que germinam depois de Chrysonilia desaparecer, têm a capacidade de produzir tricloroanisóis através da metilação de clorofenóis por isso, são considerados os principais responsáveis pelo gosto a rolha no vinho.
Neste trabalho foi feita a análise de fungos isolados de diferentes etapas de produção de rolhas de cortiça. Esta análise foi primeiramente fenotípica através da observação das características macroscópicas e microscópicas dos fungos e posteriormente através da análise de perfis de „DNA fingerprinting‟ usando o „primer‟ M13 que corresponde à sequência core do fago M13 e o „primer‟ degenerado [HVH(GACA)4]. Também foi feita a preservação dos isolados em tubos com meio de cultura inclinado, em discos de micélio em água estéril e em suspensões de esporos. Toda esta informação obtida é importante para a constituição de uma colecção de culturas.
Durante a caracterização macroscópica levantou-se o problema da subjectividade de alguns caracteres que iriam ser descritos de forma diferente de indivíduo para indivíduo. Numa tentativa de reduzir esta subjectividade, para a descrição da cor das colónias de fungos foi construída uma escala de cores às quais foram atribuídos códigos. Estes códigos correspondem às diferentes proporções de vermelho, verde e azul (RGB) da escala de cores que existe nos computadores formando assim uma enorme gama de cores. Através do programa NTSYS foi verificado que estes códigos poderiam ser utilizados para a descrição da cor uma vez que as diferentes cores ficaram separadas no dendrograma construído.
foi possível formar grupos de espécies para os géneros Aspergillus e Penicillium. Uma vez que poucos isolados de Mucor (5), Chrysonilia (2), Cladosporium (3) e
Trichoderma (4) foram encontrados na amostra em estudo (o estudo destes
géneros foi abandonado nesta fase), apenas os géneros Aspergillus (26) e
Penicillium (157) prosseguiram para a análise molecular.
Para a análise dos dendrogramas obtidos associaram-se os dados moleculares com os dados fenotípicos, pois estes têm um elevado poder discriminante e como tal, é feita uma melhor separação dos isolados. Para o género
Aspergillus a análise feita não foi suficiente para a separação dos isolados
taxonomicamente. Para o género Penicillium os três clusters analisados tiveram resultados diferentes. No primeiro cluster, que era constituído por isolados de antes de cozedura, a raiz do dendrograma tinha um coeficiente de similaridade de 89,2% mostrando que estes são todos muito semelhantes. No segundo cluster com uma linha de corte a 75% houve formação de um cluster composto por 4 isolados da espécie Penicillium glabrum e todos eles isolados da fase de cozedura do processo de fabrico das rolhas de cortiça. Por fim, no terceiro cluster mais diversificado em termos de etapas e origem dos isolados, não foi possível a separação destes em grupos de espécies; no entanto, todos os isolados de discos de cortiça encontravam-se no mesmo cluster.
Apesar de não terem sido identificados todos os isolados de fungos da cortiça, tentou-se fazer uma associação destes com as etapas de fabrico das rolhas a partir das quais foram isolados. Assim, verificou-se que o género Cladosporium aparece nas etapas antes de cozedura e escalda, o género Chrysonilia aparece nas etapas antes de cozedura e discos, Mucor aparece apenas na fase de estabilização pós cozedura e Trichoderma aparece antes de cozedura, cozedura e escalda. O género Penicillium foi encontrado em todas as etapas e o género Aspergillus foi encontrado apenas nas etapas antes de cozedura, cozedura e estabilização pós-cozedura.
Com este trabalho concluiu-se que uma padronização deve ser feita para a descrição das características fenotípicas dos fungos. A escala de cores feita neste trabalho foi uma grande ajuda já que reduziu substancialmente a subjectividade de apreciação deste parâmetro. Apesar da análise molecular não ter sido discriminante taxonomicamente pode-se verificar que há alguma relação entre a existência de
da importância destes fungos para a manufactura de rolhas de cortiça.
Palavras-chave: indústria de rolhas de cortiça; fungos; identificação fenotipica; „DNA
1 Introduction 1
1.1 Bibliographic review 1
1.1.1 Cork‟s importance 1
1.1.2 Cork oak – Quercus suber L. 1
1.1.3 Cork 2
1.1.4 Cork stoppers manufacturing 3
1.2 Moulds and Cork 5
1.3 Fungi study 6
1.3.1 Fungi identification 6 1.3.1.1 Fungi morphology 6 1.3.1.2 Molecular analysis 7
1.3.1.2.1 Techniques most applied to fungi identification 8 1.3.1.3 Secondary metabolites 10 1.4 Fungi preservation 10 1.5 Culture collection 11 1.6 Aims 12
2 Materials and methods 13
2.1 Biological material 13 2.1.1 Studied fungi 13 2.1.2 Reference strains 13 2.2 Identification 15 2.2.1 Growth media 15 2.2.2 Fungal growth 15
2.2.3 Observation of macroscopic characters of each strain 15 2.2.3.1 Optimization of color description 16 2.2.4 Observation of microscopic characters of each strain 18
2.2.5 Data coding 18
2.2.6 Molecular analysis 18
2.3 Preservation of fungi 20
2.3.1 Slants 20
2.3.2 Discs in sterile water 20
2.3.3 Spore suspension 20
2.4 Data analysis 20
3 Results and Discussion 22
3.1 Phenotypic features 22 3.2 Dendrogram analysis 24 3.3 Molecular identification 31 3.4 Moulds and Cork analysis 35
4 General conclusions and Future Prospects 37
5 Bibliography 39
Introduction
1.1 Bibliographic review
1.1.1 Cork’s importance
Because of its huge applicability, cork is one of the most valuable, natural and renewable products, being also one of the most profitable [1]. Cork is the bark of the cork oak, Quercus suber L., a tree that grows in Mediterranean regions such as Portugal, Spain, Italy, France, Morocco and Algeria (Fig 1) [2].
Figure 1: Distribution of cork forests in the Mediterranean [3].
It is estimated that the worldwide distribution of cork oak is around 2.277.700 hectares, of which about 54% is located in the Iberian Peninsula (Portugal 32% and Spain 22%). According to previous studies, in 2005, Portugal led cork exportation with 60% worth 839.4 million euros, of which 457 million euros are due to cork stoppers exportation, making it the largest cork producer in the world. This has turned out to be of great importance to the Portuguese economy [4, 5].
1.1.2 Cork oak – Quercus suber L.
The cork oak (Quercus suber L.) is an evergreen tree member of the family
Fagaceae. It is a tree of slow growth and high longevity, which can reach 250-350
years, though the age limit for the production of cork is until 150-200 years [6]. The first harvest, called “desbóia”, only occurs once the tree has reached 25 years of age, and during the months when the cork oak is actively producing cork, which is from May/June through August. At this stage, the cork obtained, virgin cork, is irregular and its toughness makes it difficult to work with. This virgin cork is used for
applications other than stoppers since it does not have the required quality. Nine years later, the second stripping occurs where we obtain the secondary cork which is not proper for cork stoppers‟ production either. It is only after nine more years that the extracted cork is suitable to produce cork stoppers. It is called the “amadia” cork and has a regular structure with smooth back and tummy. From this point, the cork oak will produce cork of good quality every 9 years, adding up to approximately 15 crops during the life of a cork oak tree [7].
1.1.3 Cork
Cork is composed of empty dead cells, without cellular material and can be described as a homogeneous vegetal tissue with thin-walled cells, regularly arranged without intercellular space. Although it is highly porous, due to the prevalence of lenticular channels (the main indicator of cork quality) allowing the diffusion of gases, it is impermeable to liquids [6, 8].
The cellular structure of cork wall consists of a thin, lignin rich middle lamella (internal primary wall), a thick secondary wall made up of alternating suberin and wax lamella and a thin tertiary wall of polysaccharides [8].
The main component of cork cells is suberin (45%) which is responsible for cork elasticity and tightness followed by lignin (27%) which is an insulating compound that provides the mechanical support and rigidity to the cell wall. Polysaccharides such as cellulose and hemicellulose (12%) are important because they offer higher tensile strength, flexibility and malleability. In a lower proportion (11%) are tannins (polyphenolic) and waxes (hydrophobic compounds), which are responsible for color and the impermeability of cork, respectively (Fig 2) [9, 10].
1.1.4 Cork stoppers manufacturing process
A) Harvest
Cork is harvested from the trunk of the cork oak tree manually, by cutting and tearing. This process occurs in late spring or during the summer when the tree is physiologically active in cork production because, at this moment, it is easier to separate the cork from the trunk [6].
B) 1st Selection
After the extraction process has been completed, the cork stays for a few weeks in the forest and then is taken to the factory where the first selection is made. Cork planks with yellow stain and burnt cork bark should be separated and placed apart because they are not suitable for cork stoppers‟ production as it could cause future sensory deviations [12].
C) Seasoning
After selection of the planks, they undergo a maturation period where important reactions occur in the bark. Until recently this stage occurred in the forest but, to avoid contamination from soil or animals, it now takes place in factories outdoors. There, the planks are stored on an inclined floor which allows air circulation and drainage [13], so that cork does not rot. During this period the planning of the planks occurs and, with the rain, insects, dust and phenolic compounds are eliminated. Planks should be stacked for no less than 6 months and, apparently, there is degradation of lignin and moisture content reduction from 15 to 30% (according to the dry weight of cork plank) [11].
D) 1st Boiling
The next step is boiling which will allow the cork to be worked with since it is extremely tough and therefore machines will not be able to slice it. With boiling, the planks will flatten and increase humidity which will make the cork more flexible, elastic and thick. This consists of immersing the slabs in clean boiling water for at least 1 hour [7].
E) Post Boiling Stabilization
According to the Systecode 2006 [12], cork planks should stabilize for a minimum of 2 weeks and a maximum of 4 weeks, so that cork planks‟ moisture content reaches 16% to 20%, in a well ventilated room with specifically controlled environment conditions, in order to prevent the growth disorder of microorganisms [14]. However, if the boiling process used is innovative the post boiling stabilization stage can be less than one week [12].
F) 2nd Selection
According to the International Code of Cork Stopper Manufacturing Practices, there is a second selection of cork suitable for cork stoppers production, taking into account the thickness of the bark and its quality (visual appearance) [12].
G) 2nd Boiling
When the period between the 1st boiling and the cork‟s processing is too long, planks have dried to equilibrium moisture contents of 5% to 6% modifying the cork‟s strength, plasticity and elasticity. In this case, planks are put through a second boiling but only for 30 minutes [10].
H) Slicing and Punching
Slicing is the operation of cutting the cork planks into parallel strips wider than the intended length of cork stoppers to be punched. Cork stoppers are then punched out of these strips through the drill pipe whose diameter is slightly bigger than the intended diameter of corks [10, 15].
I) Dimensional rectification and Storage
Corks are grouped into classes according to their size and appearance, but the defective are eliminated. This process can be automated or manual [16]. Then, they are stored in a clean and ventilated place, free from odors [12].
J) Washing and Drying
This step requires several types of washing: washing with water, with hydrogen peroxide, with sulfamic acid and then with sodium metabisulfite. The first wash is just to remove dust from the stoppers, while the others are used to blanch and disinfect the corks. Then the moisture content is reduced by thermal treatment applied to the cork stopper [12].
K) Colmation
In some cases, the cork may undergo colmation, with the intention of sealing the pores (lenticels) from the surface of the cork with a mixture of cork dust. Natural rubber and resin glue is used to set the powder in the pores. Today water-based glue is also used. As a result, the performance and visual appearance of the cork is improved [16].
L) Machinery and Handmade selection
In this final selection of cork stoppers, those ready to be used are separated into various classifications based on their visual appearance, and the defective are rejected. First, the selection is made by machines and then by experienced people [12].
1.2 Molds and Cork
Although the process of boiling the cork and downstream treatment can partially destroy cork‟s microorganisms, the cork is quickly colonized by microorganisms, especially moulds when the temperature and humidity conditions favor their growth [17]. The origin of those fungi is mainly from spores that already exist in the lenticels but it can also be environmental contamination.
Among the many ways of contributing to cork taint in wine, molds are the most responsible because some of them have the ability to methylate chlorophenols eventually present in cork producing chloroanisoles [18-20]. On the other hand, some fungi are extremely important for cork because they help obtain the physical properties needed in cork stoppers [21].
Traditionally, cork slabs were considered good quality for stopper manufacturing when they were covered with some white or salmon molds during
post-boiling stabilization, which corresponds to the macroscopic growth of
Chrysonilia sitophila in cork [18]. However, according to Pires et al [22] it is known
that this fungus is only visible when water activity (aw) is above 0.9. The presence of
C. sitophila in cork slabs is then important because at those aw values it grows fast and occupies a huge area of the cork sample which results in less space for the growth of other fungi. Therefore, C. sitophila has the ability to restrict the growth of other mold species [18] and can perforate the cell wall of the cork completely, resulting in higher compression strength [21].
If this stabilization period is too long, the aw decreases from 0.9, so other molds that already exist in the cork and that are tolerant to lower values of aw germinate [22], e.g. Penicillium spp., Aspergilus spp., Mucor spp. and Cladosporium spp., which according to Silva Pereira et al [21] may be the most responsible for the production of compounds that can modify the flavor of the wine.
1.3 Fungi study
1.3.1 Fungi identification
Classification systems of organisms are historically based on observable characteristics. This is the phenotypic approach. Fungal classification and identification has traditionally been based on macroscopic features, micromorphology and few physiological characters, even though several molecular and chemical features have been introduced in recent decades [23, 24].
1.3.1.1 Fungi morphology
There are many characters that can describe a fungus, however there are only a few that can differentiate and identify a fungus among others. Fungi morphology can be subdivided into macroscopic and microscopic features and it is the latter that weighs more when it comes to identification. Nevertheless, there are some macroscopic details that are more characteristic to some groups of fungi. For example Zygomycota fungi usually have rapid growth covering all the Petri dish, fungus of the genus Eurotium usually have yellow colonies, the genus Chrysonilia has fast growth and pinkish to orange colonies and the reverse of a plate from
Cladosporium fungi is dark.
Fungi within Zygomycota possess three distinctive properties: rapid growth (referred above), non-septate mycelium and reproduction by sporangiospores which
are produced by the asexual reproductive structure sporangium. On the other hand, in the most developed groups, Ascomycota and Basidiomycota, the most common features are septate mycelium and sexual reproduction through ascospores (produced in asci) and basidiospores (produced in basidia). Besides their sexual spores, they can commonly produce asexual spores, conidia (fewer cases in Basidiomycota). So, if only the sexual state is present, it is called the teleomorph, if only the asexual state is present it is called the anamorph but if both exist, it is called holomorph [23, 25, 26]. Fungi where only the anamorph is known and the correspondent teleomorph is unknown were placed in a group without taxonomic classification named mitosporic fungi (previously known as deuteromycetes). Within the mitosporic fungi the type of conidia, conidiogenesis (the process involved in conidia formation) and the structure that bears one or more conidiogenous cells, called conidiophore, are considered the most important characteristics to be observed. To do so, growing isolates in appropriate culture media is required, enabling their most characteristic features to be recognized [24]. Having this approach based on phenotypic character it is possible to indentify fungi to their genus or, sometimes even to its species, though it is time consuming.
1.3.2.2 Molecular analysis
Phenotypic features are often difficult to observe and/or analyze which limits the correct identification of molds. In recent years, there has been substantial progress in the development of innovative methods to analyze fungi (and other microorganisms) at the molecular level [27]. So, although the application of molecular methods to mycology has become widespread and almost a routine process, it can not be forgotten that these are, scientifically, recent applications [28].
The development of molecular techniques has been greatly accelerated by the use of the polymerase chain reaction (PCR). PCR is a process that allows to obtain many copies of a conserved DNA region and is a highly conditioned process as its efficiency depends on temperature, reagents‟ concentration and enzyme activity [28]. The use of universal (non-discriminative) primers in PCR enables the amplification of a particular target in organisms differing in the internal target sequence. As the resulting PCR products amenable for profiling are often of similar size, differentiation must be achieved on the basis of nucleotide sequence differences [29]. Therefore, a crucial step is the selection of a gene or genetic marker that can be used to differentiate a wide variety of organisms.
1.3.2.2.1 Techniques most applied to fungi identification
Probably the most widely used region of DNA in mycology is the ribosomal RNA (rRNA) gene cluster. The region consists of three major genes that code for the 25S, 18S and 5.8S ribosomal RNAs. These genes are separated by internal spacer regions, and the whole gene cluster is repeated many times along the chromosome, individual clusters being separated by intergenic spacer sequences [28] (Fig 3).
Figure 3: Schematic diagram of the ribosomal RNA gene cluster [28].
The large subunit 25S (LSU) and the small subunit 18S (SSU) gene contain both conserved and variable regions, and the conserved regions have allowed to design probes and primers derived from one fungus to be used for subsequent analysis of many others [28]. As the whole gene cluster is repeated, the internal transcribed spacer regions (ITS) are, as well, highly repeated and also have sequences of high conservation and sequences of high variability that allow identification up to species level [30]. Combined with LSU gene, the β-tubulin gene can also be used in phylogenetic studies because it is a single copy gene highly conserved in fungi, although as single target it has low resolution to infer phylogenetic relationships [31] and public databases are still very poor [32].
Microsatellite loci, short tandemly repeated motifs of 1-6 bases, also known as simple sequence repeats (SSR), are widely used as genetic markers because of their ubiquity, ease to score, co-dominance, reproducibility, assumed neutrality and high level of polymorphism. The number of repeats obtained allows inference of kin relationships among alleles, and they can thus be developed as powerful tools for inferring evolutionary and demographic patterns. The major drawback of microsatellite loci is that they often need to be isolated de novo from each species,
which can be time-consuming and expensive. Adding this to the low number of geneticists interested in fungi, explains why there is a preference for anonymous markers such as amplified fragment length polymorphisms (AFLP) and random amplified polymorphic DNA markers (RAPD) [33].
In RAPD analysis, genomic or template DNA is primed at low annealing temperature with a single short oligonucleotide (ca. 10 bases) and the PCR products are fragments with different size and consequently electrophoretic mobility. RAPD analysis detects two types of genetic variations: (i) in the length of DNA between the two primer binding sites, and (ii) in sequence at the priming regions [26]. So, if there is a sequence variation at the priming regions, or primers annealed too far or either 3‟ ends of the primers are not facing each other no fragment is produced. There are some disadvantages in this procedure but the greatest is reproducibility because of its low stringency.
Contrary to this, there is PCR fingerprinting, which is similar to RAPD, except that primers are longer (>15 bases), annealing temperatures are higher and PCR conditions more stringent. Most PCR fingerprinting primers are designed from repetitive DNA sequences and the most commonly used in fungi include cs M13, which is derived from the core sequence of phage M13 (5‟- GAG GGT GGC GGT TCT -3‟) [27], and [HVH(GACA)4] which is formed by simple repetitive oligonucleotides and a degenerate anchor at 5‟ end [34]. Because of more stringent reaction conditions, PCR fingerprinting is generally more reproducible than RAPDs and has proven to be quite reliable for discrimination and identification of species and strains [27].
With these molecular techniques it is possible to analyze the results through the construction of a dendrogram where clusters are formed. Frequently one or two representatives of each cluster are chosen to proceed to sequencing. Automated DNA sequencing is available through systems based either on electrophoretic separation in gels, or on microcappilary electrophoresis. The maximum length of sequence will depend on a number of factors, including the type of sequencer, but in many applications automated sequencers can provide around 1000bp of sequence from overnight operations. After getting the sequence, public data bases such as European Molecular Biology Laboratory (EMBL) or GenBank, which provide numerous on-line services for identifying, aligning and comparing sequences, can be consulted [28].
1.3.2.3 Secondary metabolites
In recent years, secondary metabolites produced by fungi have gained considerable attention, due to their high species specificity. In other words practically all species produce a unique combination of different types of small organic compounds such as polyketides, nonribosomal peptides, terpenoids as well as many other compounds of mixed biosynthetic origin. Some of these compounds are even unique to a single species. Therefore it is possible to use such chemical features as a taxonomic tool. Given the chemical nature of such small organic molecules they can be detected by different spectroscopic techniques such as infrared (IR), ultraviolet (UV), mass spectrometry (MS) and nuclear magnetic resonance (NMR), each giving complementary structural information, which is why these are often used in combined setup in connection with either gas or liquid chromatography [35].
Mycotoxins are a group of secondary metabolites produced by filamentous fungi which may exert toxic effects either in animals or plants if they contaminate food, feeds or the raw materials used to produce them. The genera of mycotoxigenic fungi are mainly represented by Aspergillus, Penicillium and
Fusarium, but Trichoderma, Trichothecium and Alternaria are also important as food
contaminants or pathogens for plants, among others [36].
1.4 Fungi preservation
To proceed to the analysis above, fungi must first be cultured in order to control its viability and purity before preservation. Preservation is really important and should occur throughout all the work because this is when we guarantee that a fungi sample was saved and that whenever we want to analyze it we can put it in culture to grow.
Fungi can be preserved in agar slopes at deep-freeze temperatures though taking inoculums from a slant and returning it to the freezer may cause loss of viability [37]. Moreover this technique cannot be applied to long periods of conservation since microbes present low viability. Fungi can also be preserved in a spore suspension kept at -80ºC with a cryoprotectant solution. Although time consuming, this procedure preserves around 90% of the fungi for long periods of time [25]. There are some fungi that do not survive at such lower temperatures [26]
so, this is not a good method for preservation of all fungi. Keeping fungi discs in sterile distilled water is a simple, inexpensive and reliable way of preserving molds too. In sterile distilled water fungi can remain viable for at least 12 years having a survival rate of 89.7% [38]. Tubes with sterile distilled water are stored only at 4ºC so low temperature issues are resolved.
At the Microbiology Laboratory from IBET/ITQB there is a fungal culture collection, where fungi were isolated over several years of work [39-41] from different cork lots (from Portugal and Spain) and along the manufacturing process of cork stoppers: before boiling (AC), boiling (C), post-boiling stabilization (T), second boiling (e) and cork discs (D). The isolation was performed by several methods, depending on the authors:
i) Dilution plating: through a vacuum infiltration technique according to Davis et al [42] where pressure was used to infuse a solution (peptone-Tween 80)
into the pores of the cork and extract the resident microorganisms which were isolated using serial dilutions and inoculated onto selective media [39]; also through the regulation NP 3725 [43] which isolated fungi by putting cork stoppers into jars with a washing solution and then using this solution to inoculate plates by serial dilutions; another used method was turning the cork into powder and placing it in suspension where, by serial dilutions, it is inoculated onto isolation media [41].
ii) Direct plating: fungi that were visible to the naked eye were inoculated
directly onto the isolation media [41].
1.5 Culture collection
Culture collections of microorganisms are embedded in a scientific environment, which guarantees state of the art quality checks and allows the development of scientific programs to improve the quality of the material. The Centraalbureau voor Schimmelcultures (CBS; Utrecht, Netherlands) is a good example to be followed. CBS is a centre of biodiversity where many culture collections from fungi, yeasts and bacteria are maintained. CBS was actively involved in setting the standards for modern long-term preservation, data storage and data exchangeability, therefore, from a culture collection a Biological Resource Centre (BRC) was developed. Moreover, CBS provides services and is a repository
of living cells, genomes of organism, information relating to heredity and the functions of biological systems. BRCs contain collections of culturable organisms, replicable parts of these organisms, cells and tissues, as well as databases containing molecular, physiological and structural information relevant to these collections. Furthermore, all data are computerized and networked to various databases around the world. To guarantee this service, regular monitoring should be done to verify if samples are still viable and maintain the same characteristics.
The general purpose and mission of the biodiversity preservation in culture collections is to maintain the biology diversity, verify and guarantee the good quality of the samples, develop preservation and database programs for quick research, produce catalogs of the available products and supply the scientific community with good quality products [44].
1.6 Aims
The main purpose of this work is to identify the genus of some isolated fungi from cork through morphological characters and microscopic observations. Then, by fingerprinting techniques an attempt is made to establish associations between the molds that were collected from the different stages of cork production or even compare the diversity of phenotypes against the diversity of fingerprinting profiles. In parallel, fungi will be preserved in a culture collection so that they would still be viable in the future.
2 Materials and Methods
2.1 Biological material2.1.1 Studied Fungi
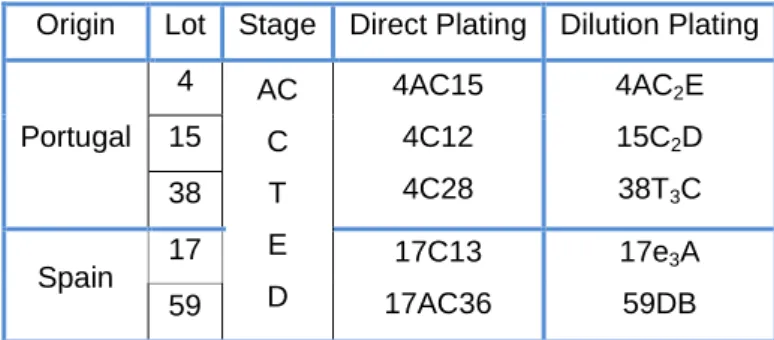
The strains used in this work belong to the fungal culture collection of the Microbiology Laboratory from IBET/ITQB and were mainly isolated by Barreto et al [41]. All strains were preserved at -80ºC as spore suspensions. From ca 350 isolated fungi from 4 different cork lots, only 198 strains (78 from lot 4, 72 from lot 15, 17 from lot 17, and 31 from lot 59) constituted the sample studied along this work.
The fungi that were isolated by direct plating were coded using ordinal numbers. The fungi that were isolated by dilution plating were collected from strata of piles (1, 2 or 3) and coded by the alphabet. Moreover, the coding used to represent the stages of cork stoppers manufacture process are: before boiling – AC; 1st boiling – C; post-boiling stabilization – T; 2nd boiling – e; and discs - D (Table 1).
Table 1- Origin of the lots, stage of cork production and coding examples of fungi.
Origin Lot Stage Direct Plating Dilution Plating
Portugal 4 AC C T E D 4AC15 4C12 4C28 4AC2E 15C2D 38T3C 15 38 Spain 17 17C13 17AC36 17e3A 59DB 59 2.1.2 Type strains
The type strains used in this study are stored in a culture collection from Microbiology Laboratory IBET/ITQB and were obtained from the American Type Culture Collection (ATCC; USA), the Centraalbureau voor Schimmelcultures (CBS; Netherlands), the Coleccion Española de Cultivos Tipo, (CECT; Spain), from Deutsche Sammlung von Mikroorganismen und Zellkulturen (DSMZ; Germany), from Food Research Laboratory (FRR; Australia) and from the Micoteca da
Universidade do Minho (MUM; Portugal) [45, 46]. These strains were preserved at -80ºC in spore suspension.
(i) ATCC:
Penicillium corylophilum - ATCC 9784 Penicillium chrysogenum - ATCC 10106 Penicillium janczewskii - ATCC 10115 Penicillium aurantiogriseum - ATCC 10116 Penicillium granulatum - ATCC 10450 Penicillium spinulosum - ATCC 10498 Penicillium herquei - ATCC 18237 Penicillium fennelliae - ATCC 22050 Mucor racemosus - ATCC 22365 Penicillium crustosum - ATCC 24721 Penicillium glabrum - ATCC 48440
(ii) CBS:
Eupenicillium ochrosalmoneum - CBS 489.66
(iii) CECT:
Neurospora crassa - CECT 2729
(iv) DSMZ: Penicillium decumbens - DSMZ 845 Penicillium adametzii - DSMZ 1178 Penicillium spinulosum - DSMZ 1180 Phanerochaete chrysosporium - DSMZ 1556 Penicillium variabile - DSMZ 1996 Penicillium glabrum - DSMZ 2017 Penicillium diversum - DSMZ 2212 Penicillium spinulosum - DSMZ 62870 (v) FRR: Penicillium hirayamae - FRR 143 Penicillium olsoni - FRR 2377
(vi) MUM:
Penicillium glabrum - MUM 9837 Penicillium spinulosum - MUM 9912.
2.2 Identification
The 198 strains were characterized using phenotypic and molecular methods through macro and microscopic descriptions and fingerprinting analyses, respectively.
2.2.1 Growth media
To determine the phenotypic characters fungi were inoculated in solid media normally used for fungal growth: Malt Extract Agar (MEA; OXOID, Cambridge, UK), Czapack Yeast Extract Agar (CYA; OXOID, Cambridge, UK), Potato Dextrose Agar (PDA; Scharlau, Barcelona, Spain) and Dichloran 18% glycerol Agar base (DG18; Conda Pronadisa, Madrid, Spain). The preparation of these media and culture conditions are described by Samson et al [45]. To avoid atypical colony growth and color, in MEA and CYA media, a trace metal solution (TMS) was joined (1mL per 1L of solution). This solution is composed by 1 g ZnSO4.7H2O (Sigma, St. Louis, USA) and 0.5 g CuSO4.5H2O (Sigma, St. Louis, USA) in 100 mL distilled water [44, 47].
2.2.2 Fungal Growth
The samples that were preserved in spore suspension were inoculated in Petri dishes. The plates were incubated at 25ºC with 95% relative humidity and light cycles of 12 hours, for 5 days.
2.2.3 Observation of macroscopic characters of each strain
After 5 days of growth, the macroscopic characteristics were taken (photographs taken with a camera Cybershot 12.1 Megapixels, Sony, Tokyo, Japan). Characteristics like elevation and zonation were analyzed according to their presence vs absence and the diameters of colonies were measured in millimeters. The texture and color of the colonies proved to be a very subjective characters as they depend on the perspective of each person. Therefore, the description of texture was analyzed according to a recent book by Samson et al [47], and the color description underwent an optimization process.
2.2.3.1 Optimization of color description
The biggest problem with color description is the recognition that the perception of color is different for each individual so, what is dark green for one person, may be grey to another. For this reason and to avoid expressions like greenish or grayish, a color scale was built. To be useful for all, the scale was not constructed by giving names to colors, but giving codes using the RGB color scale from computers.
Procedure
On each computer there is a wide range of colors that are characterized by codes and each code consists of three numbers that correspond to different proportions of red, green and blue, respectively. The minimum value for these colors is 0 (zero) and the maximum is 255 so, in order to reduce the scale to be used, intervals of thirty were made. The complete scale has 1000 colors though there are many that are very similar so they were not considered here. Taking into account the goals of the work and the most representative colors that appear in fungal colonies, the final scale has only 157 colors.
In order to evaluate if these codes can be used as a method for color coding we used the sequential agglomerative hierarchic nonoverlapping clustering (SAHN) from the Numerical Taxonomy System (NTSYS) program (F. James Rohlf, version 2.2 2009) with an unweighted pair group method with arithmetic mean (UPGMA) as an algorithm for clustering, to construct a dendrogram. This dendrogram (Fig 4) represents the distribution of the codes by clusters of colors, which shows that it is possible to use the scale for color coding as most colors appear to be well separated.
Figure 4: Dendrogram showing the UPGMA analysis of color distribution in separated clusters. The section line was established at 75% of similarity.
2.2.4 Observation of microscopic characters of each strain
A complement to the macroscopic character is the observation of fungal features under the microscope. The most important characteristics observed were: mycelium septation, type of conidia, conidiogenesis (process involved in conidia formation) and the structure that bears one or more conidiogenous cells, called conidiophores.
There are different ways of preparing a microscopic slide, which depend on the type of fungal colony. Generally, if it has powder spores then the best way is to carefully take a sample from the border of the colony and put it in a drop of the stain of cotton blue, between the microscopic slide and the cover slip. Otherwise, if they are not powdery, it is better to use the adhesive tape technique. To disperse the spores in the microscopic preparation a drop of ethanol can be used [25].
The microscope used was a ZEISS, Oberkochen, Germany, Axio Imager A2 Upright microscope equipped with a Axio cam MRm using the Axio Vision Rel 4.8.2 software.
2.2.5 Data coding
The information collected from all the observations made for each fungus had to undergo an encoding process because they refer to different characteristics and it is necessary to standardize all the data. The features that were identified by presence vs absence went through a binary coding and the quantitative data such as diameter, texture and form of conidia were subjected to an additive binary coding. Colors were coded according to RGB values and were treated as quantitative data being registered in a matrix separated from the binary data.
2.2.6 Molecular Analyses
DNA Extraction and analysis –the Ultra Clean Microbial DNA isolation kit,
(MoBIO, San Diego, USA) was used according to the manufacturer‟s instructions. The extracted DNA was quantified by NanoDrop Spectrophotometer ND-1000 (Wilmington, DE USA).
PCR Fingerprinting – the primers used were cs M13 (5‟- GAG GGT GGC
GGT TCT -3‟) and [HVH(GACA)4] (Invitrogen; Life Technologies, California, USA) and the thermocycler was from Biometra thermocycler T3000 (Goettingen, Germany).
The reagents used are listed in Table 2.
Table 2- List of reagents used in PCR fingerprinting and their concentrations.
Concentration Stock solution Final Concentration
PCR buffer 10x 1x
MgCl2 50mM 3mM
dNTPs 10mM 0.2mM
Primer 50pmol/µL 2pmol
Taq polymerase 50U/µL 0.04U
Sterile Milli-Q DNA
The PCR conditions used are listed in Table 3. Primers cs M13 and [HVH(GACA)4] were subjected to the same PCR conditions.
Table 3- Description of PCR fingerprinting conditions.
PCR stage PCR temperature (ºC) PCR time (min) Nº of cycles
Initial Denaturation 94 3 - Denaturation 94 1 35 Annealing 55 2 Extension 72 2 Final extension 72 5 -
Gel electrophoresis and revelation – For electrophoresis, the DNA samples
were run in a 1.2% (w/v) agarose gel with 1X TAE buffer (242g Tris base, 57.1 mL glacial acetic acid and 100mL EDTA 0,5M pH8 in one liter of water) for three hours at 90V in a tank from Horizon 20x25 (Life Technologies, California, USA). 1kb plus DNA ladder was used (Invitrogen; Life Technologies, California, USA). For revelation of the gel, GelRed Nucleic Acid Stain, 3x in Water, (Biotium, Hayward,
USA) was used. The image was acquired with Kodak 1D 3.6 software (Kodak digital science, Rochester, NY, USA).
2.3 Preservation of fungi
2.3.1 Slants
Once sterilized and while still liquid, the MEA medium is distributed in tubes (about 6mL per tube) remaining inclined to solidify. Then, fungi were inoculated into tubes and are incubated for 5 days at 25ºC with 95% relative humidity and light cycles of 12 hours. After growth, the tubes were stored at 4ºC [26].
2.3.2 Discs in sterile water
Distilled water is distributed into tubes (about 10mL per tube) and is sterilized at 121ºC for 15min. Then, small discs of mycelium of the fungus were cut from MEA plates and transferred to the tubes (around 8 discs per tube) that were stored at 4ºC [26, 48, 49].
2.3.3 Spore suspension
The spore suspension was done according to the European Norm (EN) 12353 [50]. The technique involved the growth of fungi in plates, scraping the mycelium and its filtration. Then after washing and spin cycles, the resulting pellet is preserved in a cryoprotectant solution consisting of beef extract (3.0 g/L), tryptone pancreatic digest of casein (5.0g/L), glycerol (150g/L) in water.
2.4 Data analysis
After identifying all the phenotypic characteristics of each strain, a dendrogram was constructed using the BioNumerics software (version 5.00 Applied Maths, Sint-Martens-Latem, Belgium). Two data matrices were constructed, one composed by qualitative data (binary coding) and the other with quantitative data (color coding). The similarity coefficients used were simple matching (qualitative data) and Pearson correlation coeficient (quantitative data). For dendrogram‟s construction the UPGMA method was used. When making the composite, the matrices should have the same weight when analyzing OTUs, so when additive coding was used in the qualitative matrix it counted only as one character. For example in texture instead of counting all the different types of textures as one
character, the characteristic texture in general counts as one because only discriminates one character. The final dendrogram was constructed with a ratio of 3 (qualitative data) : 1 (quantitative data), using average from experiments as coefficient of similarity and the UPGMA method for clustering.
On the other hand, to analyze the molecular data, gel pictures from PCR fingerprinting products were normalized also using BioNumerics. Similarity was calculated using Dice coefficient (with 2% of optimization and 1% of tolerance) and the correspondent dendrogram was constructed using UPGMA for clustering.
3 Results and Discussion
In the present work a sample of 198 fungal isolates was subjected to several tests in order to study the possible mycoflora that occurs during cork stoppers manufacture. To do so, these fungi underwent a macroscopic and microscopic evaluation, aiming to unveil the relation between them and define some clusters. Subsequently, molecular tests were performed on a smaller sample (66 fungi) and comparisons were made between fungi isolated from different lots and/or from cork slabs of different stages of cork stoppers manufacture process.
3.1 Phenotypic features
Throughout this first analysis some difficulties were encountered, since phenotypic characters are very subjective. Therefore, depending on who performs it, the test results may be significantly different. Texture of the colony, for example, is difficult to determine because there are fungi that, grown in different media, may have different textures or even in the same colony they can present mix of textures. Therefore, using literature as support is extremely helpful.
Color is another example of subjectivity when analyzing fungal characteristics. An experiment was performed triyng to introduce some objectivity to this character. So a color scale of the most common colors presented by fungi cultures was constructed using the RGB codes (see Fig 4 for color scale). It can not be forgotten that despite reducing subjectivity, this form of analysis is still subjective when choosing a color from the scale. This is not a recent problem. In fact, Pitt et al [51] also felt the need to use a color scale to describe fungi macroscopically showing that it is absolutely necessary to standardize the description of fungi to make it as objective as possible.
Despite all these difficulties, through macroscopic observations it was possible to separate some fungi according to their color, texture and growth size. However, it is well known that it is only through microscopic observations that it is possible to confirm the groups formed. The genera found in these observations were
Mucor, Aspergillus, Chrysonilia, Cladosporium, Penicillium and Trichoderma.
Fungi from the genus Mucor have fast growth in MEA and microscopically it is possible to verify that they have non-septate mycelium and produce sporangia as reproduction structures (Fig 5a). In contrast, all the other observed genera have
septate mycelium which makes the mycelium septation an important character when differentiating fungi.
Aspergillus spp. and Penicillium spp. are macroscopically different since the
former have mostly yellow to black colonies and the latter presents normally greenish colors. They both have septate mycelium and assexual reproduction through conidia. They differ in the structure of the conidiophore where Aspergillus spp. have a non-septate-enlarged conidiophore at the tip forming a vesicle with phialides and Penicillium spp. have a septate-straight conidiophore with phialides (Fig 5 b and c).
Fungi from Chrysonilia spp., Cladosporium spp. and Trichoderma spp. genera have roughly similar microscopic structures since they have septate mycelium and production of conidia: chain of conidia, conidia in a tubular shape and bunches of conidia, respectively. As can be seen in the images d), e) and f) of Figure 5, macroscopically these fungi are very different which makes it a great help to separate the genus.
Figure 5: Macroscopic and microscopic pictures of different fungal genera. a) Mucor sp. with a two-day growth and a total magnification of 400x, respectivelly; b) Aspergillus sp. with a five-day growth and a total magnification of 1000x respectivelly; c) Penicillium sp. with a five-day growth and a total magnification of 400x, respectivelly; d) Chrysonilia sp. with a two-day growth and a total magnification of 400x, respectivelly; e) Cladosporium sp. with a five-day growth and a total
magnification of 1000x, respectivelly; and f) Trichoderma sp. with a two-day growth and a total magnification of 400x, respectivelly.
3.2 Dendrogram analysis
With all these phenotypic characteristics observed, it is possible to not only separate fungi through genera but sometimes through group of species within each genus. According to this, within the genus Aspergillus, only through colony color it was possible to form group of species (Table 4). However, within the genus
Penicillium more characteristics should be taken into account like color, texture and
exudate (Table 5). In a previous work the gene of β-tubulin of some isolates have been sequenced so, some species name are known (Table 6).
Aspergillus and Penicillium were the only genera that, in this work, went
through molecular analysis since they are more representative in the studied sample. On the other hand, the genera Mucor, Chrysonilia, Cladosporium and
Trichoderma, which are underrepresentative, were abandoned in the following
analysis.
With all the data collected in phenotypic observations, it is possible to construct a dendrogram representing the relations of similarity and dissimilarity between isolates according to these features. In Figure 6 it is represented a simplified dendrogram of all isolates analyzed in this study based on the characteristics referred above. As can be observed, in the dendrogram most of the fungi were separated by genera with a coefficient of similarity of 85% (Fig 6). Since the phenotypic characters are similar to different genera, there are some genera that are distributed along the simplified dendrogram, therefore, to improve the analysis, dendrograms were constructed separated by genera.
The total of fungi presented is 197 (one less than the initial sample) because the isolate 15AC3F, which was only identified by sequencing in a previous work, should be an external contamination probably from soil since Sporormiella is mainly found on the dung of herbivores [52].
Table 4– Separation of isolates from the genus Aspergillus through group of species according to color colony.
Group of Aspergillus species Isolates
sp1 (black) 17AC12.
sp2 (yellow)
4AC2D, 4AC12, 4AC16, 4AC32, 4C1C, 4C3A, 4C11, 4C16, 4C24A, 4C31, 4C33, 4T3B, 17AC1D, 17AC2B, 17AC3A, 17AC36, 59AC2Hb and 59T2B.
sp3 (greenish) 4AC22, 4AC2Jb, 4C22 and 4C32.
sp4 (greenish and white) 4C21.
sp5 (beige and white) 15AC2Ka and 15AC312a.
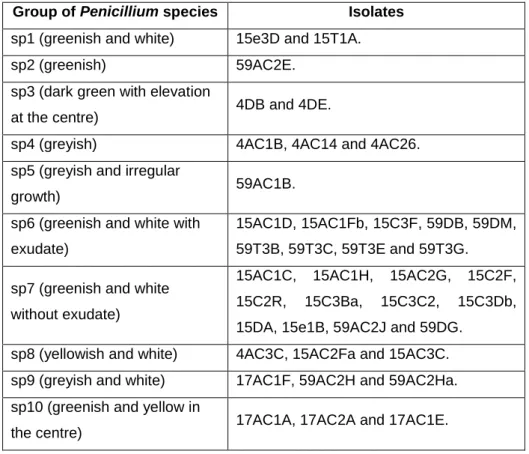
Table 5- Separation of isolates from the genus Penicillium through group of species according to colony characteristics.
Group of Penicillium species Isolates
sp1 (greenish and white) 15e3D and 15T1A.
sp2 (greenish) 59AC2E.
sp3 (dark green with elevation
at the centre) 4DB and 4DE.
sp4 (greyish) 4AC1B, 4AC14 and 4AC26.
sp5 (greyish and irregular
growth) 59AC1B.
sp6 (greenish and white with exudate)
15AC1D, 15AC1Fb, 15C3F, 59DB, 59DM, 59T3B, 59T3C, 59T3E and 59T3G. sp7 (greenish and white
without exudate)
15AC1C, 15AC1H, 15AC2G, 15C2F,
15C2R, 15C3Ba, 15C3C2, 15C3Db,
15DA, 15e1B, 59AC2J and 59DG.
sp8 (yellowish and white) 4AC3C, 15AC2Fa and 15AC3C.
sp9 (greyish and white) 17AC1F, 59AC2H and 59AC2Ha.
sp10 (greenish and yellow in
Table 6- Isolates identified until species level through sequencing of β-tubulin gene in previous work (see attachment ii)).
Isolates Species known
15AC1Fb Penicillium glandicula
15AC1H Penicillium glabrum
15C3Db Penicillium glabrum
15C3Ba Penicillium glabrum
Figure 6: Simplified dendrogram showing the separation of fungi by genera through phenotypic characters using simple matching coeficient for qualitative data and Pearson correlation coeficient for quantitative data and UPGMA for clustering method. Number of
isolates in each cluster is also represented. The section line was established at 85% of similarity.
Within the genus Aspergillus, all the isolates (26 fungi) proceeded to molecular analysis.
Figure 7: Composite dendrogram showing the clustering of Aspergillus spp. Isolates based on phenotipic characteres using simple matching coeficient for qualitative data and Pearson correlation coeficient for quantitative data and UPGMA for clustering method.
In the genus Penicillium, since it has many isolates (157 fungi), only some clusters were chosen to perform molecular analysis (Fig 8). Therefore, only three close groups were chosen trying to establish relations between fungi and stages of cork stoppers manufacture or regarding the localization (lot) of the isolates: cluster A isolates from before boiling stage; cluster B most of isolates from 15 lot (Portugal); and cluster C isolates from different stages of cork stoppers production and different lots. (Fig 8a and 8b).
a)
Cluster A
b)
Figure 8: Composite dendrograms showing the clustering of Penicillium spp. isolates based on phenotipic characteres using simple matching coeficient for qualitative data and Pearson correlation coeficient for quantitative data and UPGMA for clustering method. Three clusters were chosen to continue to molecular analysis, two shown in a) and one shown in b).
3.3 Molecular fingerprinting
To perform the analysis of PCR fingerprints, Dice coefficient was used to compare band profiles. It was not possible to use Pearson correlation coefficient because the photographs of the gels had high background and any darker stain could be considered, erroneously, as a band. When using Dice it is possible to modify settings related to position tolerance: optimization and position tolerance. The values used were 2% for optimization and 1% for position tolerance which means that the program will look for the best possible matching and the maximal shift allowed between two bands to consider them as matching, respectively [53].
To calculate the percentage of reproducibility of each fingerprinting method and therefore the cutting line in the dendrogram, 10% of the entire sample, chosen randomly, was also analyzed as duplicate. The reproducibility value is defined by the root where the isolate and its duplicate meet.
For the isolates of Aspergillus spp. the M13 fingerprinting presented a low percentage of reproducibility, 65%, while using [HVH(GACA)4] a 83% reproducibility was obtained. The dendrogram showed one main cluster with 17 isolates and 9 isolates as single-membered clusters. When doing the composite dendrogram of the phenotypic data with the molecular data, the coefficient of similarity increased from 74% to 80% because the former has high discriminative power when differentiating isolates (Fig 9). For example in the molecular dendrogram the isolates 4AC22 and 4AC2Jb (sp3) were placed together in the sp2 group but at the composite the 4AC2Jb formed a single-membered cluster.
It is possible to verify that in this group of isolates, the molecular method was not discriminative enough to separate groups of species from the genus Aspergillus for instance, the isolate 4AC22 is in the sp2 group and the isolates 4C24A and 4AC12 are out.
Figure 9: Composite dendrogram showing the clustering of Aspergillus spp. isolates based on phenotipic characteres and molecular profiles. Simple matching coeficient was used for qualitative data and Pearson correlation coeficient for quantitative data in the phenotypic analysis and, Dice coefficient (optimization 2% and position tolerance 1%) was used in molecular analysis. UPGMA was used as clustering method. The section line was traced at 80% of similarity.
For the isolates of Penicillium spp. the percentage of reproducibility is similar for the two methods, 64% to M13 and 62% to [HVH(GACA)4] profiles. The first cluster that has been chosen for molecular analysis (cluster A) presented only one group with 7 isolates since the root tree was above the established cutting line. In
cluster B there is one group with 3 isolates and four isolates as single-membered clusters. The third cluster showed 5 clusters with 2, 6, 13, 2 and 2 isolates respectively and one isolate as single-membered cluster. When doing the composite dendrogram of the phenotypic data with the molecular data, the coefficient of similarity increased from 63% to 75%. In the first dendrogram presented in Figure 10 a) the coefficient of similarity is higher than the section line so only one cluster has been formed. The major difference between the molecular dendrogram and the composite is that isolates such as 17AC1A and 59AC2Ha that were at 100% of similarity in the former are at 92.3% of similarity in the latter. This emphasizes the importance of phenotypic data when discriminating isolates. In Figure 10 b) there is separation of all groups of species from Penicillium genus with the formation of one cluster with 4 isolates from Penicillium glabrum species and 3 isolates single-membered clustered of other species (e.g. 17AC1F is Penicillium spinulosum). Analyzing the third dendrogram it is noticeable the distribution of different groups of species from the genus Penicillium along the different clusters. So, in this group of isolates the molecular fingerprint used was not able to separate the isolates into species level (e.g. 15AC1Fb is Penicillium glandicula and 15AC1H is Penicillium
glabrum and they are both in the same cluster).
a)
c)
Figure 10: Composite dendrograms showing the clustering of Penicillium spp. isolates based on phenotipic characteres and molecular profiles. Simple matching coeficient was used for qualitative data and Pearson correlation coeficient for quantitative data in the phenotypic analysis and, Dice coefficient (optimization 2% and position tolerance 1%) was used in molecular analysis. UPGMA was used as clustering method. The section line was traced at 74% of similarity.Dendrograms showing the results of the composite, phenotypic and molecular characteres of the genus Penicillium using UPGMA analysis and Dice coefficient (optimization 2% and position tolerance 1%). The section line was traced at 75% and a), b) and c) represents the three groups selected.
![Figure 1: Distribution of cork forests in the Mediterranean [3].](https://thumb-eu.123doks.com/thumbv2/123dok_br/19255003.977284/12.892.305.608.411.642/figure-distribution-cork-forests-mediterranean.webp)
![Figure 2: Amplification of a cork cell showing cell wall layers and their constituents [11]](https://thumb-eu.123doks.com/thumbv2/123dok_br/19255003.977284/13.892.154.749.841.957/figure-amplification-cork-cell-showing-cell-layers-constituents.webp)
![Figure 3: Schematic diagram of the ribosomal RNA gene cluster [28].](https://thumb-eu.123doks.com/thumbv2/123dok_br/19255003.977284/19.892.274.642.383.590/figure-schematic-diagram-ribosomal-rna-gene-cluster.webp)