Faculdade de Engenharia da Universidade do Porto
Automatic Classification of Ulcers Through Visual
Image
Rita Maria Almeida Frade
Master in Biomedical Engineering
Supervisor: Ricardo Vardasca, PhD
Co-supervisor: Joaquim Gabriel Mendes, PhD
Abstract
Globally, Chronic Wounds (CW) are health condition, which constitutes a threat to the public health and economy having a detrimental effect on patient’s quality of life and high costs in treat-ments. CW do not perform a well-ordered reparative process thus, the anatomic and functional integrities of the damaged tissue are not restored, being of extreme importance the establishment of an appropriate treatment based on an accurate characterisation of the state of the healing proc-ess.
Over the years, several ulcer risk assessment tools have been created, such as: scales, which depend on visual examination being highly subjective; invasive methods that use manual procedures for depicting the shape, area, depth and volume of wounds, are time consuming, susceptible to human errors and can lead to wound contamination; and non-invasive methods such as optical based techniques which provide three-dimensional information about the lesion, being expensive, time consuming and require user training.
There have been made several efforts to use image processing techniques for an objective and automatic analysis of CW images.
This research study aims to create a methodology based in a mobile application which incorpo-rates an algorithm that characterises chronic ulcers providing information about its area and tissue composition.
A MATLAB methodology and an Android mobile application were developed, tested and evalu-ated in 200 diabetic foot ulcers, allowing greater characterisation of 97% of the ulcers analysed with high correlation with the clinical assessment (R2=1), reducing subjectivity, avoiding wound
contami-nation probability and smaller costs when compared to conventional solutions.
Key words: Chronic wounds; characterisation; image processing; wound assessment; wound healing.
Resumo
Globalmente, as Feridas Crónicas (FC) são um problema de saúde que constitui uma ameaça para a saúde pública e economia, tendo um efeito prejudicial na qualidade de vida dos pacientes e elevados custos em tratamento. As FC não realizam um processo de reparação ordenado, por esse motivo, as integridades anatómica e funcional dos tecidos danificados não são reestabelecidas, ten-do uma importância elevada a determinação de um tratamento apropriaten-do baseaten-do numa caracteri-zação exata do estado do processo de cicatricaracteri-zação.
Ao longo dos anos, têm sido criadas várias ferramentas de avaliação de risco de úlcera, tais como: escalas, que dependem de inspeção visual sendo altamente subjetivas; métodos invasivos que incluem técnicas manuais para obter a forma, área, profundidade e volume de feridas, são demora-dos, suscetíveis a erros humanos e podem levar a contaminação da úlcera; e métodos não invasivos como técnicas baseadas em sistemas óticos que fornecem informação tridimensional sobre as lesões, tendo um custo elevado, obrigam a que os utilizadores sejam treinados para a sua utilização e a obtenção da caracterização é muito demorada.
Por estes motivos, tem sido verificado um interesse crescente em usar técnicas de processamen-to de imagem para obter uma análise objetiva e auprocessamen-tomática de imagens de úlceras.
Este projeto de investigação tem como finalidade a criação de uma metodologia baseada numa aplicação móvel que incorpora um algoritmo de caracterização de úlceras crónicas, fornecendo informação relativamente à sua área e composição tecidular.
Uma metodologia em MATLAB e uma aplicação Android foram desenvolvidas, testadas e avalia-das em 200 úlceras de pés diabéticos, permitindo uma ótima caracterização de 97% avalia-das úlceras ana-lisadas com alta correlação relativamente à caracterização realizada por clínicos (R2=1), reduzindo
a subjetividade, evitando a contaminação da lesão e com menor custos associados quando compara-da com as soluções mais convencionais.
Palavras-chave: Avaliação de feridas; caracterização; cicatrização de feridas; feridas crónicas; processamento de imagem.
Acknowledgments
First of all, I would like to thank Prof. Dr. Ricardo Vardasca, my mentor of dissertation, for the will, patience and the constant availability shown to assist me in certain aspects throughout this work.
Secondly, I want to thank Prof. Dr. Joaquim Gabriel Mendes, my co-supervisor for the encour-agement and kindness of allowing me to work in the L003 laboratory during this year.
Next, I would like to thank Dr. Rui Morais Carvalho and all of the physicians and nurses at the Diabetic Foot Clinic in Centro Hospitalar do Porto for the kindness, motivation and readiness to help and answer all of my questions since the start of this study. I want to leave here a special thanks to every single one of the patients who kindly agreed to participate in my study at Diabetic Foot Clinic in Centro Hospitalar do Porto.
I would like to acknowledge the Project NORTE-01-0145-FEDER-000022 - SciTech - Science and Technology for Competitive and Sustainable Industries, cofinanced by Programa Operacional Re-gional do Norte (NORTE2020), funded through the Fundo Europeu de Desenvolvimento ReRe-gional (FEDER) and the FCT - Foundation for Science and Technology under the project (PEst-OE/EME/LA0022/2013).
Last but not the least, I thank my family, specially my mother, for believing in me and showing her pride for every difficulty surpassed and goals achieved, and friends who supported and moti-vated me throughout this adventure.
Contents
1. Introduction ...1
1.1 - Background and objectives ... 1
1.2 - Objectives ... 2
1.3 - Dissertation outline ... 3
2. Literature review ...5
2.1 - Qualitative wound assessment ... 5
2.1.1 - Cutaneous wound ... 5
2.1.1.1 - Vancouver Scar Scale (VSS) ... 6
2.1.1.2 - The Seattle Scar Scale (SSS) ... 6
2.1.1.3 - The Hamilton Scar Scale ... 7
2.1.1.4 - Manchester Scar Scale (MSS) ... 7
2.1.1.5 - Patient and Observer Scar Assessment Scale (POSAS) ... 8
2.1.1.6 - Stony Brook Scar Evaluation Scale (SBSES) ... 9
2.1.2 - Pressure ulcer (PU) ... 10
2.1.2.1 - Norton scale ... 10
2.1.2.2 - Braden scale ... 11
2.1.2.3 - Waterlow scale ... 12
2.1.2.4 - Pressure ulcer scale for healing (PUSH) ... 13
2.1.2.5 - European Pressure Ulcer Advisory Panel scale (EPUAP) ... 14
2.1.3 - Diabetic ulcer ... 15
2.1.3.1 - Wagner scale ... 16
2.1.3.2 - University of Texas Diabetic Wound Classification scale (UT) ... 16
2.2 - Quantitative wound assessment ... 19
2.2.1 - Visual characterisation of wounds ... 19
2.2.2 - Physical characterisation of wounds ... 20
2.2.2.1 - Invasive methods ... 22
2.2.2.2 - Non-invasive methods ... 26
2.3 - Wound care ... 39
2.3.2 - Adjuncts to wound care ... 43
2.4 - Summary ... 44
3. Methodology ... 47
3.1 - Equipment and Software ... 47
3.2 - Data collection protocol ... 50
3.3 - Marker... 51
3.4 - Unsuccessful image processing techniques ... 51
3.5 - Image processing methodology in MATLAB ... 54
3.5.1 - Pre-processing ... 55
3.5.2 - Ulcer segmentation ... 55
3.5.3 - Shape recognition and ulcer area calculation ... 56
3.5.4 - Tissue classification ... 57
3.6 - Android mobile application ... 57
3.6.1 - External libraries incorporation ... 58
3.6.2 - Graphic interface ... 59
3.6.3 - Android mobile application overview ... 63
3.6.4 - Pre-processing ... 65
3.6.5 - Segmentation ... 65
3.6.6 - Ulcer area calculation ... 66
3.6.7 - Tissue classification ... 66
3.7 - Assessment evaluation ... 67
4. Results ... 69
4.1 - Marker segmentation ... 69
4.2 - Unsuccessful image processing techniques ... 71
4.3 - Image processing methodology in MATLAB ... 74
4.3.1 - Pre-processing ... 74
4.3.2 - Ulcer segmentation ... 75
4.3.3 - Tissue classification ... 77
4.4 - Android mobile application ... 79
4.4.1 - Pre-processing ... 79 4.4.2 - Ulcer segmentation ... 81 4.4.3 - Tissue classification ... 82 4.5 - Assessment evaluation ... 84 4.6 - Summary ... 88 5. Discussion ... 89 5.1 - Marker segmentation ... 89
5.2 - Unsuccessful image processing techniques ... 90
5.4 - Assessment evaluation ... 92
5.5 - Summary ... 92
6. Conclusion ... 95
6.1 - Future work ... 96
Appendix A – Ethical approval of the project by the Centro Hospitalar do Porto ... 97
Appendix B- Informed consent ... 100
Appendix C- Questionaire ... 101
Appendix D- Image collection protocol ... 102
Appendix E- Wound characterisation protocol ... 103
Appendix F- Mobile application clinical evaluation ... 104
List of figures
Figure 1.1 - Document Outline. ... 4
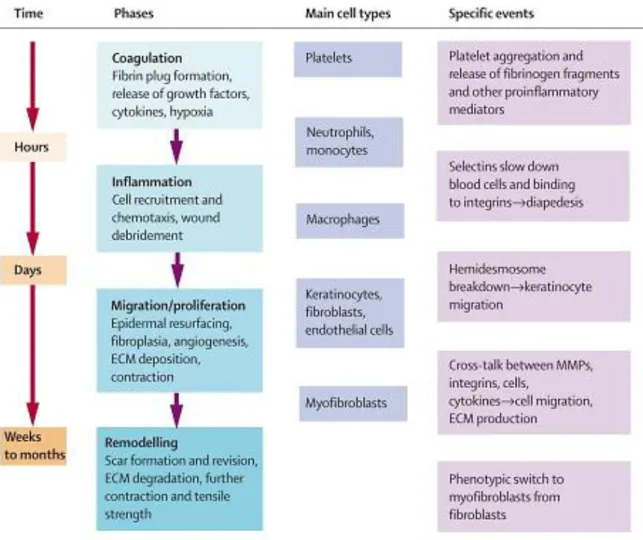
Figure 2.1 - Phases of wound healing (Falanga, 2005) ... 21
Figure 2.2 - Depth Gauge method (Shai and Maibach, 2005) ... 22
Figure 2.3 - The ruler method a) Image of the wound b) Measurement of the length (red line) and width (blue line) of the wound through the ruler method (Wendelken et al., 2011) ... 23
Figure 2.4 - Acetate method a) Manual tracing of the wound b) Image of the wound (Wendelken et al., 2011)23 Figure 2.5 - Digital planimetry of a wound (use of PictZar Digital Planimetry Software on a Windows 8 Tablet) (PictZar Digital Planimetry Software, 2007) ... 24
Figure 2.6 - Kundin gauge (Kundin, 1985; Kundin, 1989) ... 24
Figure 2.7 - Usage of the saline method to quantify the volume of an ulcer (MAVIS II, 2006) ... 25
Figure 2.8 - The alginate method to quantify the volume of an ulcer (MAVIS II, 2006) ... 26
Figure 2.9 - Diagram of the stereo camera in place over a leg where “a” are the cameras (Bulstrode et al., 1986) ... 27
Figure 2.10 - A) Camera A views the object in its right-hand FOV, while camera B views in its left. b) The blue object appears closer to the camera pair than the red object (Lau, 2012) ... 27
Figure 2.11 - Structured Light a) The MAVIS b) The Structured Light method c) 3-D representation of the area and volume of the ulcer (Krouskop et al., 2002; MAVIS II, 2006) ... 28
Figure 2.12 - Acquisition of the 3-D surface of objects using the Structured Light method (Buchón-Moragues et al., 2016) ... 29
Figure 2.13 - Results of the methodology created by (Barone et al., 2011) where (a) 3D geometrical wound model, (b) 3D colour texture map, (c) 3D thermal map, (d) 3D segmented data using wound detection on the chromatic image, (e) 3D segmented data using wound detection on the thermal image ... 30
Figure 2.14 - Methodology created by (Kecelj Leskovec et al., 2007) a) Visual images captured by the camera and b) Wound being illuminated by light stripes ... 30
Figure 2.15 - Methodology created by (Bowling et al., 2011) ... 31
Figure 2.16 - Block diagram of medical image processing and analysis ... 33
Figure 3.1 - Data collection protocol a) Wound exposure b) Washing of the wounded extremity c) Image cap-ture of the ulcer d) Upload of the images to a PC where its processing was performed using MATLAB. Based on (Rennert et al., 2009) ... 50
Figure 3.2 - Calibration markers a) 2D square marker (2.5 x 2.5 cm2) b) 3D square marker (1.0 x 1.0 x 0.5 cm2)51
Figure 3.3 - Methodology for image processing using MATLAB ... 55
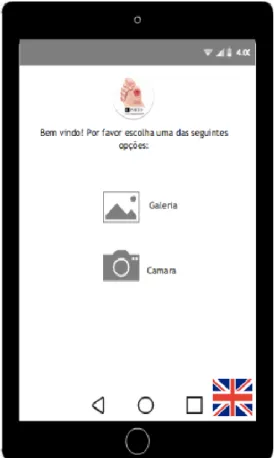
Figure 3.4 - Preview of the main activity of the mobile application ... 59
Figure 3.5 - Live feed activity ... 60
Figure 3.6 - Preview of the confirmation ... 60
Figure 3.7 - Touch interface of seed point selection a) ulcer b) marker ... 61
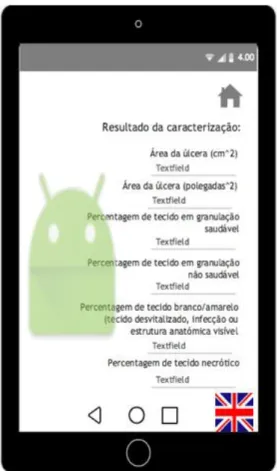
Figure 3.8 - Preview of the result of the wound characterisation ... 62
Figure 3.9 - Structure of the PDF report with the result of the wound characterisation ... 63
Figure 3.10 - Mobile application design using Android Studio ... 64
Figure 4.1 - Unsuccessful 2D marker segmentation a) Original image b) Result of the flood fill c) Erroneous marker segmentation ... 70
Figure 4.2 - Unsuccessful 3D marker segmentation a) Original image b) Result of the flood fill c) Four labels detected during shape recognition instead of two ... 70
Figure 4.3 - Marker a) Marker not totally adherent to the skin b) Marker appears bended c) Marker shape modi-fication due to the capture angle of the image ... 70
Figure 4.4 - Techniques tested for image pre-processing a) Original image b) Gaussian filtering c) Bottom-hat and Top-hat operations ... 71
Figure 4.5 - Techniques tested for wound and maker segmentation whose results were not satisfactory a) Canny edge detector b) Circle Hough transform c) Gabor filtering ... 72
Figure 4.6 - Techniques tested for wound and maker segmentation whose results were not satisfactory a) Wa-tershed algorithm b) Region Growing algorithm c) Active contour with snakes d) Active contour ('Chan-Vese' method) e) Fuzzy-c-means Clustering ... 73
Figure 4.7 - Pre-processing using MATLAB of the ulcer with white/yellow tissue a) Original image b) Histogram equalisation c) Median filtering ... 74
Figure 4.8 - Pre-processing using MATLAB of the ulcer with necrotic tissue a) Original image b) Histogram equalisation c) Median filtering ... 74
Figure 4.9 - Pre-processing using MATLAB of the ulcer with mostly granulating tissue a) Original image b) Histo-gram equalisation c) Median filtering ... 75
Figure 4.10 - Segmentation process of the ulcer with white/yellow tissue using MATLAB a) Result of the im-plementation of the flood fill algorithm with a tolerance of 30 b) Result of the imim-plementation of the flood fill algorithm with a tolerance of 35 c) Result of the implementation of the flood fill algorithm with a tolerance of 40 ... 75
Figure 4.11 - Segmentation process of the ulcer with white/yellow tissue using MATLAB a) Result of the im-plementation of the flood fill algorithm b) Binary image resultant of the filling holes and object labelling op-erations c) Final segmentation result ... 76
Figure 4.12 - Segmentation process of the ulcer with necrotic tissue using MATLAB a) Result of the implemen-tation of the flood fill algorithm b) Binary image resultant of the filling holes and object labelling operations c) Final segmentation result ... 76
Figure 4.13 - Segmentation process of the ulcer with mostly granulating tissue using MATLAB a) Result of the
implementation of the flood fill algorithm b) Binary image resultant of the filling holes and object labelling operations c) Final segmentation result ... 76
Figure 4.14 - Examples of ulcers that were not segmented by the flood fill ... 77 Figure 4.15 - Tissue classification of the ulcer with white/yellow tissue using MATLAB a) Representation of the
black pixels b) Representation of the white pixels c) Representation of the light red pixels d) Representation of the dark red pixels e) Tissue classification of wound ... 77
Figure 4.16 - Tissue classification of the ulcer with necrotic tissue using MATLAB a) Representation of the
black pixels b) Representation of the white pixels c) Representation of the light red pixels d) Representation of the dark red pixels e) Tissue classification of wound ... 78
Figure 4.17 - Tissue classification of the ulcer with mostly granulating tissue using MATLAB a) Representation
of the black pixels b) Representation of the white pixels c) Representation of the light red pixels d) Represen-tation of the dark red pixels e) Tissue classification of wound ... 78
Figure 4.18 - Pre-processing using the Android application of the ulcer with white/yellow tissue a) Original
image b) Histogram equalisation c) Median filtering ... 80
Figure 4.19 - Pre-processing using the Android application of the ulcer with necrotic tissue a) Original image b)
Histogram equalisation c) Median filtering ... 80
Figure 4.20 - Pre-processing using the Android application of the ulcer with mostly granulating tissue a)
Origi-nal image b) Histogram equalisation c) Median filtering ... 80
Figure 4.21 - Segmentation process of the ulcer with white/yellow tissue using the Android application a)
Binary ulcer image resultant of the implementation of the flood fill algorithm b) Binary image of the ulcer resultant of the closing operation c) Binary image of the marker resultant of the closing operation d) Final segmentation result ... 81
Figure 4.22 - Segmentation process of the ulcer with necrotic tissue using the Android application a) Binary
ulcer image resultant of the implementation of the flood fill algorithm b) Binary image of the ulcer resultant of the closing operation c) Binary image of the marker resultant of the closing operation d) Final segmentation result ... 81
Figure 4.23 - Segmentation process of ulcer with mostly granulating tissue using the Android application a)
Binary ulcer image resultant of the implementation of the flood fill algorithm b) Binary image of the ulcer resultant of the closing operation c) Binary image of the marker resultant of the closing operation d) Final segmentation result ... 82
Figure 4.24 - Tissue classification of the ulcer with white/yellow tissue using the Android application a)
Repre-sentation of the black pixels b) RepreRepre-sentation of the white pixels c) RepreRepre-sentation of the light red pixels d) Representation of the dark red pixels ... 82
Figure 4.25 - Tissue classification of the ulcer with necrotic tissue using the Android application a)
Representa-tion of the black pixels b) RepresentaRepresenta-tion of the white pixels c) RepresentaRepresenta-tion of the light red pixels d) Repre-sentation of the dark red pixels ... 83
Figure 4.26 - Tissue classification of the ulcer with mostly granulating tissue using the Android application a)
Representation of the black pixels b) Representation of the white pixels c) Representation of the light red
pixels d) Representation of the dark red pixels ... 83
Figure 4.27 - Healthcare professionals’ evaluation of the mobile application (n=7) ... 84
Figure 4.28 - Healthcare professionals’ opinion on the two methodologies (n=7) ... 85
Figure 4.29 - Correlation of the areas obtained with both methodologies ... 85
Figure 4.30 - Correlation of the real area of the lesions provided by healthcare professionals and the areas obtained with both methodologies ... 86
Figure 4.31 - Correlation of the dark red tissue’s percentages obtained with both methodologies ... 86
Figure 4.32 - Correlation of the light red tissue’s percentages obtained with both methodologies ... 87
Figure 4.33 - Correlation of the necrotic tissue’s percentages obtained with both methodologies ... 87
Figure 4.34 - Correlation of the white tissue’s percentages obtained with both methodologies. ... 88
List of tables
Table 2.1 — The Vancouver scar scale. Adapted from (Fearmontiet al., 2010). ... 6
Table 2.2 — Hamilton scar scale. Based on (Smith et al., 1988; Crowe et al., 1998; Brusselaers et al., 2010) ... 7
Table 2.3 — Manchester scar scale (Fearmonti et al.,2010). ... 8
Table 2.4 — Patient and observer scar assessment scale (Hyunjoo et al., 2015) ... 9
Table 2.5 — The Stony Brook Scar Evaluation Scale (Fearmonti et al., 2010) ... 9
Table 2.6 — Norton scale (Bell, 2005). ... 11
Table 2.7 — Braden scale (Bergstrom et al., 1987) ... 11
Table 2.8 — Waterlow Scale (Agrawal and Chauhan, 2012) ... 12
Table 2.9 — Pressure ulcer scale for healing 3.0 (Cuddigan, 1997; Thomas et al., 1997;Stotts et al., 2001) ... 13
Table 2.10 — EPUAP scale. Based on (Thomas et al., 1997; Stotts et al., 2001) ... 14
Table 2.11 — The Wagner scale (Wagner Jr., 1981; Wagner Jr., 1986) ... 16
Table 2.12 — The university of Texas diabetic wound classification system. Based on (Lavery et al., 1996) ... 17
Table 2.13 — Comparison of all the scales mentioned in this report. Based on (Fearmonti et al., 2010; Reichel, 1958; Mark and Warren, 2007; Jain, 2012; Beeckman et al., 2007) ... 18
Table 2.14 — Comparison of the advantages and disadvantages of the most used methods for quantita-tive wound characterisation (Plassmann et al., 1995). ... 32
Table 2.15 — Mobile applications for characterisation of diabetic foot ulcers (Healthpath, 2011; Vivanco et al., 2012; Friesen et al., 2013; Varma et al.,2016; Wang et al., 2015; +Wounddesk, 2011) ... 38
Table 2.16 — Comparison of the different types of dressings and their application (Daley, 2017; Kannon and Garrett, 1995; Piacquadio and Nelson, 1992; Edgepark Surgical, 2005) ... 42
Table 3.1 — Equipment ... 48
Table 3.2 — Software ... 48
Table 3.3 — Mobile application requirements ... 58
Table 4.1 — Results of the wound characterisation using MATLAB ... 79
Abbreviations and Symbols
2-D Two-dimensional
3-D Three-dimensional
BMI Body Mass Index
CHT Circle Hough Transform
CIE Commission Internationale de l'Éclairage
CW Chronic wound
dB Decibel
EPUAP European Pressure Ulcer Advisory Panel FC Feridas crónicas
FDA Food and Drug Administration FOV Field of view
HSI Hue, Saturation and Intensity colour space JavaCV Java Computer Vision Library
JPEG Joint Photographics Experts Group JPG Joint Photographics Group
LED Light-Emitting Diode
MAVIS Measurement of Area and Volume Instrument system MOWA Mobile Wound Analyzer
MSS Manchester Scar Scale
NPUAP National Pressure Ulcer Advisory Panel OpenCV Open Source Computer Vision Library PDF Portable Document Format
POSAS Patient and Observer Scar Assessment Scale
PU Pressure ulcer
PUSH Pressure ulcer scale for healing RGB Red, Green, Blue colour model ROI Region of interest
SBSES Stony Brook Scar Evaluation Scale SNR Signal to Noise Ratio
SPG Stereophotogrammetry SSS Seattle Scar Scale SVM Support vector machine TNP Topical negative pressure UT University of Texas VSS Vancouver Scar scale XML Extensible Markup Language
Chapter 1
Introduction
1.1 - Background and objectives
The skin is the largest organ in the human body acting as an efficient physical and chemical barrier in the organism, being crucial in the survival and maintenance of human life. When compro-mised, or destroyed, this barrier requires immediate intervention to ensure the return of its normal functions (Lanza et al., 2007; Fung, 2001; Langer and Vacanti, 1993; Benbow, 2006), since skin de-generation and loss associated with chronic wounds (CW) can result in significant morbidity and mortality, due to a disruption of the homeostatic function and susceptibility to infection (Langer and Vacanti 1993).
A wound is defined as a disruption of normal anatomic structure and function, resulting from pathologic processes that begin internally or externally to the involved organ(s). Factors as the pa-tient age, wound size, depth and location and the presence of local and/or systemic diseases lead to wound healing time variation. Homeostasis, inflammation, proliferation and angiogenesis, and remodelling are the main events of the complex highly orchestrated process defined as normal wound healing. Acute wounds experience this series of overlapping phases but CW do not (Benbow, 2006; Whittington and Briones, 2004; Zhan and Miller, 2003; Langemo, 2005; Dargaville et al., 2013).
Besides the financial impact caused by the high costs associated with the treatments and pre-vention, studies report that CW have a negative impact on patient’s psychological and social func-tioning (Fung, 2001; Langer and Vacanti, 1993; Benbow, 2006; Whittington and Briones, 2004) caus-ing pain and immobility, followed by privation of sleep which leads to lack of energy and of self-esteem, worries and frustrations and thus, leading to their isolation.
When compared to healthy people, individuals with CW have a significantly poorer quality of life due to the regularity of dressing changes, which clearly affects patient’s daily routine. On the other hand, due to lack of adequate sleep, these individuals experience a daily feeling of continued fa-tigue. However, the consequences of having a CW have a massive impact not only on the patient’s
social life but also in the lives of their caregivers. The loss of independence associated with func-tional debility can lead to variations in general health and wellbeing as altered eating habits, social isolation and as a result, depression and a continuing reduction in activity. These issues, plus the absence of mobility, influences the occurrence of further lesions, worsens their severity and limits their ability to heal (Langer and Vacanti, 1993; Benbow, 2006; Whittington and Briones, 2004); Zhan and Miller, 2003; Langemo, 2005).
Ulcers are one of the most common cases of CW. There are many different types of ulcers (ve-nous, arterial, neuropathic, lymphatic, and infectious) with different causes (Dargaville et al., 2013). Ulcers resultant of vascular disease are the most dominant type particularly the venous ones, which accounts for over two-thirds of all types of ulcers, being the most usual type (Benbow, 2006; Whittington and Briones, 2004; Zhan and Miller, 2003; Langemo, 2005).
Relatively to the three types of CW approached in this dissertation, during 2014, it is estimated that developed countries have spent approximately $USD88218 per patient in order to treat scars/burns.
According to the Portuguese society of Diabetology (Sociedade Portuguesa de Diabetologia, 1997), about 415 million (8.8%) of the worldwide population was diagnosed with Diabetes Mellitus in 2015. Being the Portuguese population incidence of 1 million people (13.3% of the total population), with a national annual total spending of 1.7 billion euros with this disease.
Furthermore, the Directorate-General of Health (DGS, 1899) estimated that in 2016, the preva-lence of pressure ulcers was of 11.5% in the Portuguese population.
The follow up of the wound healing process is typically performed through scoring scales com-pleted by clinical observation in order to provide comparable semi-quantitative information and thus stimulate better management of funds. However, this is highly dependent on the observer and thus, extremely subjective, jeopardising the quantification of the observations as well as the com-parison of results between healthcare centres (Torra, 1997), therefore, its use is restricted (Xu, 2004). After these scales were created, contact methods to evaluate wound depth, area and volume were designed and developed. However, these methods are extremely invasive to the patient and introduce errors. Efforts to automatically assess wounds have been made globally through image processing techniques and smartphones/tablets applications to reduce healthcare costs, patient suffering and improve the assessment of the lesions.
1.2 - Objectives
The aim of this research is to create a methodology that performs chronic wound characterisa-tion according to its area and tissue colour, without promoting wound contaminacharacterisa-tion, patient dis-comfort, time consumption and subjectivity. This purpose was satisfied by first creating a MATLAB image processing methodology and then incorporating it in an Android mobile application.
In order to fulfil the aim of this project, secondary goals were also established:
Perform the segmentation of the calibration marker in the image; Achieve the segmentation of the chronic ulcer in the image; Calculate ulcer area in cm2;
Dissertation outline
Characterise the tissue composition of the ulcer bed relatively to the percentage of un-healthy and un-healthy granulating tissues, necrotic tissue and white tissue.
1.3 - Dissertation outline
This document is organised in six sections.
The first section, this section, the theme and a characterisation of the problem and its context are introduced as well as the description of the aim and goals. It ends with the description of the report structure.
The Literature review addresses the scientific background of the research. This section is di-vided in three subsections: Qualitative assessment, Quantitative assessment and Wound care. The first part of the chapter addresses the scales used in medical environment to assess three types of CW: burn/scar, pressure ulcer and diabetic ulcer. These scales are a visual and intuitive starting point of the choice of the most adequate treatment for the patient. The Quantitative assessment, contemplates the necessity of a more accurate follow up of the healing process of a chronic wound. Two types of techniques used to quantify a wound are described: visual characterisation and physi-cal characterisation methods, being the physiphysi-cal methods divided in two sections, namely invasive methods and non-invasive methods. In the invasive methods are described several methods cur-rently used for predicting invasively the depth, area and volume of ulcers; in the non-invasive sub-section are described methods created to obtain more accurately the same measures as the invasive approaches such as imaging techniques and image processing methodologies. Further, a review of the existing mobile applications that perform wound assessment is presented by the end of the sub-chapter. In the Wound care section are described the most common dressings and treatments ap-plied to wounds based on their assessment relatively to appearance, tissue composition, probability of infection and amount of exudate.
The 3rd chapter presents the methodology comprising the sample, software and equipment used,
the techniques chosen to process the images and the parameters’ values and the mobile application design as well as the methods used to evaluate the obtained outcomes. The tested and low success-ful image processing techniques tried are also described.
The achieved results are outlined in the 4th chapter relatively to the image pre-processing, ulcer
and marker segmentation, ulcer area calculation and tissue characterisation phases of both the methodology created in MATLAB and the one included in the Android mobile application. The cases where the methodology did not succeed are presented for both the markers and the ulcers.
In the Discussion, the algorithms that were tested are assessed, comparisons are established be-tween the work limitations of both methodologies, being presented suggestions of solutions for the weaknesses of each method.
In the last section, Conclusion, the main conclusions are described along with a proposal of fur-ther work.
The structure of this dissertation and the links between different parts of this document can be seen in Figure 1.1.
Chapter 2
Literature review
2.
There are several approaches for wound assessment being globally classified as qualitative or quantitative and each has advantages and disadvantages. In this chapter, the most globally ac-cepted techniques of the two types of wound assessment are described as well as the treat-ments/wound care performed according to the wound characterisation.
2.1 - Qualitative wound assessment
2.1.1 - Cutaneous wound
Acute cutaneous wounds, including burn wounds are a health and economical concern in the global community, which may lead, in the most severe cases to death.
The efficacy of a treatment directly depends on the achieved adequate characterisation there-fore, regular assessment of the wound is of extreme importance in order to determine wound heal-ing based on the percentage reduction/increase in wound area over time (Flanagan, 2003; Margolis et al., 2003) and to adjust wound management. However, wound assessment is a very complex process including wound location, wound appearance and tissue type, wound size, odour, identifica-tion of aspects that contribute to wound healing delay (presence of serous fluid, pus or exudate, signals of infection or maceration, etc.), pain and the condition of the adjacent skin (Collier, 2003).
The treatment of the cutaneous lesion, particularly when a significant part of tissue is lost, has the goal of leading to the closure of the wound (Xu, 2004). In order to evaluate the response to treatments and to assess its outcomes, numerous techniques have been developed to measure scars (Berardesca and Wilhelm, 1995). Although, new treatments are increasingly becoming more avail-able, there is no international agreement on what is the best method to assess the effects of these treatments. The follow up of the wound healing process is achieved manly through clinical observa-tion (Berardesca and Wilhelm, 1995).
The following scales (2.1.1.1 to 2.1.1.6) were developed for the characterisation of cutaneous wounds.
2.1.1.1 -
Vancouver Scar Scale (VSS)
Initially described in 1990 by Sullivan et al. (Sullivan et al., 1990), the Vancouver Scar Scale (VSS) is possibly the most documented method to assess burns/scars (Nedelec et al., 2000; Sullivan et al., 1990).
This scale evaluates four variables: vascularity, pigmentation, pliability and height/thickness. Both vascularity and height are rated from 0 to 3, pigmentation has 3 possible scores (0, 1 and 2) and pliability is rated between 0 and 5, giving a possible total score that goes from 0 to 13 points, being 13 the score for the worst scenario.
One drawback of this scale is that patient perception of the wound is not taken into account in to the final score of his/her respective scars (Nguyen et al., 2015) (Table 2.1).
Table 2.1- The Vancouver scar scale. Adapted from (Fearmontiet al., 2010).
The VSS proved not to be adequate for large and irregular scars which are characterised by a not homogenous pliability, colour and hypertrophy (Roques and Teot, 2007; Bayat et al. 2003). There-fore, this scale is strongly investigator-dependent, using pure word descriptions, and it does not locate the test site within the scar, which is indispensable for a follow-up (Draaijers et al., 2004; Van de Kar et al., 2005).
The numeric scoring of each variable is also questionable, since not all parameters are consid-ered to be equally important for each patient or physician. Another problem, already documented by Sullivan et al. (Sullivan et al., 1990), was the nonexistence of records of pain and itching and the functional and psychological sequelae of scars.
Due to these limitations, several adjustments to the VSS have been proposed in the literature along the years (Nguyen et al., 2015).
2.1.1.2 -
The Seattle Scar Scale (SSS)
In 1997 the Seattle scar scale (SSS) was proposed by Yeong et al. (Yeong et al., 1997) as a nu-meric scale based on 24 standardised colour pictures. This scale assesses thickness, border height, scar surface and colour. The score of the parameters of the scale are the same (Surface irregularity (–1 to 4), thickness (–1 to 4), border height (–1 to 4) and colour (–1 to 4)), giving a total sum be-tween –4 and 16 points, increasing the severity with the increase of the given score, with zero indi-cating normal (Yeong et al., 1997).
The SSS allows negative values for certain parameters such as hypopigmentation or atrophy. The negative values help to differentiate diverse scar types but they also lead to “improved” total
Vascularity Score Pigmentation Score Pliability Score Height Score
Normal 0 Normal 0 Normal 0 Flat 0
Pink 1 Hypopigmentation 1 Supple 1 <2mm 1
Red 2 Hyperpigmentation 2 Yielding 2 2-5mm 2
Purple 3 Firm 3 >5mm 3
Ropes 4
scores and poor interpretation of scar severity (Van der Wal et al., 2012). This limitation and the absence of attention to symptoms have hindered the wide adoption of the SSS (Nguyen et al., 2015).
2.1.1.3 -
The Hamilton Scar Scale
The Hamilton Scale was developed in 1998 by Crowe et al. (Crowe et al., 1998), being a photo-graphic assessment tool for scars (Crowe et al., 1998). Based on photographs only, observers are requested to rate numerous parameters including thickness, surface irregularity, vascularity and colour. Relatively to attribution of scores, both surface irregularity, colour and vascularity are rated from 0 to 4 and thickness has 4 possible scores (0, 1, 2 or 3) giving a possible total score that goes from 0 to 15 points, being 15 the score for the worst scenario possible (Table 2.2).
The Hamilton Scale depends only on photographs rather than real scars to perform the assess-ment process, which can potentially distort the observer’s interpretation, thus leading to errors in the assessment (Van der Wal et al., 2012).
Table 2.2 - Hamilton scar scale. Based on (Smith et al., 1988; Crowe et al., 1998; Brusselaers et al., 2010).
One remarkable aspect is the fact that the controversial negative scores used in the SSS were not applied, but the parameter of scar irregularity was introduced, which is not scored in the most used assessment scar scale, the VSS (Crowe et al., 1998; Van der Wal et al., 2012). A big advantage of this scale is its good reliability, even when used by inexperienced observers, which proves that training is not a necessity for its use (Crowe et al., 1998; Van der Wal et al., 2012). However, likely other scales, the Hamilton Scale lacks an assessment of subjective symptoms (Nguyen et al., 2015).
2.1.1.4 -
Manchester Scar Scale (MSS)
The MSS was projected by Beausang et al. (Beausang et al., 1998), in 1998 with the goal of as-sessing five scar parameters: scar colour, radiance (matte or shiny), distortion, texture and scar contour (Table 2.3). All of the parameters were taken into account in this scale, which have a pos-sible score from 1 to 4, with the exception of the parameter Matte vs. shiny that is rated as 1 or 2. These parameters are combined with a visual analogue scale to determine an overall score propor-tional to scar severity (Nguyen et al., 2015).
Surface irregularity Score Thickness Score Colour Score Vascularity Score
Smooth 0 None 0 Normally pig-mented/mature 0 Normal or paler 0
1/4 irregular 1 Slight 1 Light to medium pink 1 Slightly darker 1
1/2 irregular 2 Moderate 2 Deep pink to light red 2 Darker 2
3/4 irregular 3 Severe 3 Medium to deep red 3 Much darker 3
Majority of the scar irregular
4 Purplish 4 Hyper
pig-mented
Table 2.3- Manchester scar scale (Fearmonti et al.,2010).
On contrary to the VSS, the MSS combines vascularity and pigmentation in the parameter “col-our mismatch” of the adjacent tissue, which leads to better interrater agreement when compared with the other (Sullivan et al., 1990).
However, the MSS has been criticised for being more suited to the assessment of linear scars and for a lack of accounting for symptoms (Van der Wal et al., 2012).
2.1.1.5 -
Patient and Observer Scar Assessment Scale (POSAS)
The VSS is mainly focused on scar severity from a healthcare professional's point of view, but there was acknowledgement that the inclusion of a patient-based assessment was also essential, this limitation served as base for the creation of the POSAS (Powers et al., 1999; Martin et al., 2003), whose introduction in 2004 was a turning point in the assessment of scars through the use of scales (Draaijers et al., 2004).
The POSAS is the first scale that comprises two numeric scales: The Observer Scar Assessment Scale (observer scale) and the Patient Scar Assessment Scale (patient scale). The Observer Scale includes thickness, pigmentation, vascularity, pliability and relief while the Patient Scale includes stiffness, itching, irregularity, thickness, pain, and colour. Each item is rated between 1 and 10, being a score of 10 the worst imaginable scar or sensation and the lowest scores (5 in the observer scale and 6 in the patient scale) are for normal skin (Draaijers et al., 2004). The patient scale is completed by the patient whereas the observer scale has to be marked by the observer (Table 2.4).
Colour Score Matte vs shiny Score Contour Score Distortion Score Texture Score
Perfect 1 Matte 1 Flush with sur-rounding skin 1 None 1 Normal 1
Slightly mis-match
2 Shiny 2 Slightly proud 2 Mild 2 Just
pal-pable
2 Obvious
mis-match
3 Hypertrophic 3 Moderate 3 Firm 3
Gross mis-match
Table 2.4- Patient and observer scar assessment scale (Hyunjoo et al., 2015).
The POSAS takes into account the subjective symptoms of pain and pruritus and increases the objective information used in the VSS (Draaijers et al., 2004), but as the other scales, it does not include functional measurements about the influence of pain or pruritus in patient’s quality of life (Roques and Teot, 2007).
2.1.1.6 -
Stony Brook Scar Evaluation Scale (SBSES)
Proposed by Singer et al. (Singer et al., 2007) in 2007, it is based on five scar parameters includ-ing width, elevation or height, colour, suture or hatch marks and overall appearance (Sinclud-inger et al., 2007). Each parameter is rated by 0 or 1 (Table 2.5) for the presence or absence of the following: width greater than 2 mm at any point of the scar, raised or depressed scar, a darker coloration than the surrounding skin, any hatch or staple marks and an overall poor appearance. The total score ranges from 0 (worst) to 5 (best) (Singer et al., 2007).
Table 2.5- The Stony Brook Scar Evaluation Scale (Fearmonti et al., 2010).
Width Score Height Score Colour Score Hatch marks
Score Overall ap-pearance Score >2mm 0 Elevated/depressed in relation to sur-rounding skin 0 Darker than surrounding skin 0 Present 0 Poor 0
≤ 2mm 1 Flat 1 Same colour or
lighter than surrounding skin
The main goal of the SBSES was to measure short-term instead of long-term wound outcomes, so it was recently recommended for being used in research (Sullivan et al., 1990; Fearmonti et al., 2010). Therefore, its use is restricted for pathologic scar assessment.
Most of the above described scales do not incorporate subjective symptoms (pain or pruritus) in their assessment (Crowe et al., 1998; Van der Wal et al., 2012; Flanagan, 1993; Van Zuijlen et al., 2002), do not considers nutrition as a risk factor (Flanagan, 1997) and do not records the location of the ulcer, foot deformities and/or patient-related factors (emotional upset, poor foot care, denial) (Oyibo et al., 2001).
Numerous researchers point out that future scales should contain a patient-based component (missing in scales such as the SBSBES, the SSS and the Hamilton scale), since the presence of itching and pain is more disturbing than the appearance of the scar, and therefore these symptoms have a great impact on the quality of life and in the mental health (Van Loey and Van Son, 2003; Cheng et al., 1996; Patterson et al., 1993; Herndon et al., 1986; Mazharinia et al., 2007; Patterson et al. 2000; Sheffield et al., 1988).
2.1.2 - Pressure ulcer (PU)
PU are characterised by the action of pressure, friction, or shearing leading to areas of skin and subcutaneous tissues breakdown (Benbow, 2006). The frequency (Whittington and Briones, 2004), cost (Zhan and Miller, 2003) and sufferance (Langemo, 2005) of patients confined to bed due to pressure ulcers turns this type of lesions in an important clinical problematic.
The time necessary for the wounds to heal, as well as its high prevalence among CW, increases the necessity of predicting the probability of a wound not healing early after starting a treatment. However, there is no consensus of which wound healing parameters permits accurately predict wound healing (Kantor and Margolis, 2000; Tallman et al., 1997).
The optimal scale for wound risk assessment must have a high sensitivity and specificity in order to provide an acceptable prediction of the risk of wound development. Once its use is confined mainly to healthcare professionals, it should be simple to use, for that it is imperative that the pa-rameters are clear and appropriate to apply in different healthcare settings (Torra, 1997).
Thereafter are presented the scales that are most commonly used for the assessment of PUs.
2.1.2.1 -
Norton scale
The first PU risk assessment tool was created in 1962 by Doreen Norton (Norton et al., 1962), with the aim of being used in elderly care environment. This scale qualifies five key risk factors separated: activity, physical condition, mobility, incontinent and mental condition (Table 2.6). Each parameter was scored from 1 to 4, thus, the range of possible total scores varies between 5 and 20, with a subjective cut-off score of 14, which equates to the individual being ‘at risk’. In this tool, scores under 14 signify ‘at risk’ and scores under 12 signify ‘high risk ‘, thus, the lowers scores rep-resent the worst scenario (Norton et al., 1962).
Table 2.6- Norton scale (Bell, 2005).
Despite in the original Norton scale nutritional factors and shearing forces were not contem-plated and parameters are in need of a functional definition, this scale is widely used for clinical evaluation of pressure ulcer risk (Papanikolaou et al., 2007; Bolton, 2007). Additionally, this tool has suffered several improvements in posterior versions as the incorporation of nutrition as a risk factor once it has been reported that it is important in the process of wound healing, as well as stratification of the degrees of risk (Wai-Han et al., 1997; European Pressure Ulcer Advisory Panel, 2003).
2.1.2.2 -
Braden scale
In the mid-1980s the Braden Scale was devised (Bergstrom et al., 1987), shown in Table 2.7. The foundation for this tool was based on a “conceptual schema of aetiological factors” as well as the assumption that “pressure” and “tissue tolerance” are important aspects to be considered in the development of PUs (Bergstrom et al., 1987). Six further parameters were identified as risk factors: sensory perception, moisture, activity, mobility, nutrition and friction and shear. In this tool, every parameter is rated between 1 and 4 with the exception of “Friction and shear” that has 3 possible scores (1, 2 and 3) (Bergstrom et al., 1987). When using this tool, the range of possible total scores varies between 6 and 23 and low scores signify higher risk. The cut off points, which signify that an individual is ‘at risk’, varies between 16 and 18 (Bergstrom et al., 1987).
Table 2.7- Braden scale (Bergstrom et al., 1987). Physical
condition
Score Mental condi-tion
Score Activity Score Mobility Score Incontinent Score
Very bad 1 Stupor 1 Stupor 1 Immobile 1 Doubly 1
Poor 2 Confused 2 Chair-bound 2 Very limited 2 Usually urine 2
Fair 3 Apathetic 3 Walk-help 3 Slightly
limited
3 Occasional 3
Good 4 Alert 4 Ambulant 4 Full 4 Not 4
Sensory perception
Score Moisture Score Activity Score Mobility Score Nutrition Score Friction and shear Score Completely Limited 1 Constantly Moist 1 Bedfast 1 Com-pletely Immo-bile
1 Very Poor 1 Problem 1
Very Limited 2 Very Moist 2 Chair
fast 2 Very Limited 2 Probably Inade-quate
2 Potential
Problem 2
Slightly
Limited 3 Occasion-ally Moist 3 Walks Occa-sionally
3 Slightly
Limited 3 Adequate 3 No Appar-ent Prob-lem
3
No
Impair-ment 4 Rarely Moist 4 Walks
Fre-quently
4 No
The main criticism to the Braden scale is the incapability of professionals to differentiate the parameters. For instance, ‘mobility and activity’, where ‘mobility’ is used by the authors to enquiry the capacity of the patient to relieve pressure through movement, whereas, ‘activity’ is applied to ascertain the frequency and duration of a patient’s movement (Capobianco and McDonald, 1996). Even though, this scale has been found to have better predictive validity than single nursing judg-ment (Pancorbo et al., 2006).
2.1.2.3 -
Waterlow scale
Developed in 1987 by Judy Waterlow (Waterlow, 1988), this scale was created as an alternative to the Norton scale, once the author felt that the Norton scale did not address nutritional issues, underlying pathologies, or the risk of patients undergoing surgical procedures.
When compared to both the Norton and the Braden scales, the Waterlow scale recognises more risk factors in its assessment such as Body Mass Index (BMI), skin appearance in risk areas, sex and age, continence, mobility, appetite, neurological deficit and special risks (Waterlow, 1988; Water-low, 1998) (Table 2. 8). Both BMI, skin appearance in risk areas, continence and appetite are rated from 0 to 3, sex and age and mobility has 6 possible scores (0 to 5), special risks are rated between 1 and 8 and lastly, neurological deficit has three possible scores (4-6, 5 and 8). The total score possible ranges between 4 and 40. In contrary to the Braden and Norton scales, in the Waterlow scale high scores signify high risk.
Table 2.8- Waterlow Scale (Agrawal and Chauhan, 2012).
Built/weight for
height Score Skin type- Visual risk areas Score Sex and age Score Special risks Score
Average–BMI 20-24.9 0 Healthy 0 Male 0 Multiple organ
fail-ure/terminal cachexia 8 Above average–BMI
25-29.9 1 Tissue paper/ Dry/Oedematous/Clammy /Pyrexia
1 Female 1 Single organ failure 5
Obese- BMI> 30 2 Discoloured
(bruis-ing/mottled) 2 14-49 1 Peripheral vascular disease 5
Below average-BMI<
20 3 Broken (established ulcer) 3 50-64 2 Anaemia= Hb<8 2
65-74 3 Smoking 1
75-80 4
81+ 5
Mobility Score Continence Score Appetite Score Neurological deficit Score
Fully mobile 0 Complete/catheterised 0 Normal 0 Diabetes, MS, CVA 4-6
Restless/fidgety 1 Incontinent urine 1 Scarce/feedin
g tube
1
Mo-tor/sensory/paraplegia 4-6
Apathetic 2 Incontinent faeces 2 Liquid IV 2 Major trauma 5
Restricted 3 Doubly continent (urine
and faeces) 3 Anorexia/ absolute diet 3 Orthopaedic/spinal 5 Bedbound (e.g.
traction) 4 On table >2 hours 5
The most obvious limitation of the Waterlow scale is the risk of over assessment, the fact that it has several parameters which, makes it complex to use and non-practical and is implied that women have higher risk of developing pressure ulcers than men (Edwards, 1995; Weststrate, et al., 1998).
2.1.2.4 -
Pressure ulcer scale for healing (PUSH)
The PUSH scale was designed in 1996 by National Pressure Ulcer Advisory Panel (NPUAP) as an instrument easy to use, clinically practical and biologically accurate, to follow PUs in different care situations. This scale was evaluated and accepted for measuring the healing process of venous and diabetic foot ulcers (Cuddigan, 1997; Thomas et al., 1997; Stotts et al., 2001).
In this scale, three factors are considered to evaluate the wound condition, namely its size (cm2), the type of tissue existing in wound bed and the amount of exudate. Tissue type has four
possible scores (0, 1, 2, 3 or 4), while the exudate amount parameter has possible scores that ranges between 0 and 3, finally, the length/width parameter has eleven possible scores between 0 and 10 as shown in Table 2.9 (Ferrell et al., 2000). The scores of the three considered parameters are then added together to obtain a global score (Thomas et al., 1997; Stotts et al., 2001) and higher final scores mean a higher risk.
Table 2.9- Pressure ulcer scale for healing 3.0 (Cuddigan, 1997; Thomas et al., 1997;Stotts et al., 2001).
The PUSH tool appears to be more easily incorporated into clinical practice routine than many other wound assessment instruments already introduced in this document, once it has fewer items, takes less time and effort to complete and does not requires intensive user training (McHorney and Tarlov, 1995).
Since the parameters measured by the PUSH tool are not only aetiology-specific, the instrument should theoretically be applicable not only to PUs but also to other wound types, where the three parameters are measureable. To date, studies (Ratliff and Rodeheaver, 2005; Hon et al., 2010; Mackelbust, 1997; Gardner et al., 2005) have validated the PUSH tool and shown that it is respon-sive for monitoring wound healing progress of pressure, diabetic and venous ulcers (Ratliff and Rodeheaver, 2005; Hon et al., 2010).
weel-chair)
Length/ width (cm2) Score Exudate amount Score Tissue type Score
0 0 None 0 Closed 0
<0.3 1 Light 1 Epithelial tissue 1
0.3 – 0.6 2 Moderate 2 Granulation tissue 2
0.7 – 1.0 3 Heavy 3 Slough 3 1.1 – 2.0 4 Necrotic tissue 4 2.1 – 3.0 5 3.1 – 4.0 6 4.1 – 8.0 7 8.1 – 12.0 8 12.1 – 24.0 9 >24.0 10
2.1.2.5 -
European Pressure Ulcer Advisory Panel scale (EPUAP)
Created in 1999, the EPUAP (European Pressure Ulcer Advisory Panel, 1999) scale resulted from a united effort of both European Pressure Ulcer Advisory Panel scale and National Pressure Ulcer Advisory Panel, being the PUs classified into four stages according to the ulcer’s depth (Ferrell et al., 2000;
Berlowitz et al., 1997; Mayfield et al., 1998).
The EPUAP pressure ulcer classification distinguishes four grades and each grade is defined by the anatomic limit of soft-tissue damage: non-blanchable erythema corresponds to grade 1, blister-ing is included in grade 2, superficial lesions are classified as beblister-ing grade 3 and deep lesions corre-spond to an ulcer with a grade 4 classification (European Pressure Ulcer Advisory Panel, 1999). The classification of 4th stage represents the higher risk and the 1st stage represent the lowest (Table
2.10). However, some authors (Defloor et al., 2001; Schoonhoven, 2003) do not include non-blanchable erythema as a pressure stage
.
Table 2.10- EPUAP scale. Based on (Thomas et al., 1997; Stotts et al., 2001).
When an eschar is present, correct characterisation is not conceivable with this scale (Ferrell et al., 2000; Berlowitz et al., 1997; Mayfield et al., 1998). On the other hand, the classification is based on a correct identification of the different tissue layers and the extent of tissue damage which demands training and experience from the user (Ferrell et al., 2000; Berlowitz et al., 1997; Mayfield et al., 1998).
The most critical unresolved issues relatively to the formulation of assessment scales for pres-sure ulcers are:
• Pre-requisite of training
Most of the described scales are simple and easy-to-use however, was proved by the daily usage that these scales only provide usable measurements of the ulcer incidence and severity when used by trained healthcare professionals.
Grade Characteristics
1 The affected area of skin appears discoloured and is red in white people, and pur-ple or blue in peopur-ple with darker coloured skin.
Oedema, induration.
Warmth over a bony prominence.
2 Partial thickness skin loss involving epidermis, dermis or both.
The ulcer is superficial and presents clinically as an abrasion or blister.
3 Full thickness loss of skin involving damage to or necrosis of, subcutaneous tissue that may extend down to, but not through, underlying fascia.
Presents clinically as a deep crater with or without undermining
4 Full thickness skin loss with extensive destruction, tissue necrosis, or damage to muscle, bone, or supporting structures, for example, tendon or joint capsule. Undermining and sinus tracts may be associated with this stage of wound progres-sion.
Similar to grading a burn with the addition of a stage 4 that is deeper than a stage 3 ulcer or 3rd degree burn.
• Need for clarity
Scales such as the Norton and the Waterlow scales do not provide descriptions of their risk com-ponents, although this need has been recognised by Norton (Norton, 1996). The absence of explana-tory observations leads to misjudgements when assigning scores to each parameter. Therefore, their usage requires informed clinical judgment, which turns it applicability restricted to the better-trained healthcare professionals.
• Predictive performance
The existing scales are over-sensitive to the number of patients assigned to the ‘at-risk’ group of pressure ulcer occurrence and under-sensitive to the number of patients assigned to the ‘risk-free’ group. Therefore, according to Bick and Stephens (Bick and Stephens, 2004) ulcer assessment should be performed in combination with clinical judgment (National Institute for Clinical Excellence, 2003; National Institute for Clinical Excellence, 2005).
• Definition of the critical threshold score
According to the existing literature (Clark and Farrar, 1992) there are no match in scores that define the “at risk “and “risk-free” status among the scales. The higher risk score varies from scale to scale. Furthermore, the disagreement about the proper cut-off score is pertinent, once health-care professionals receive confusing signals about the best available evidence when applying risk assessment strategies and this may well produce variations in the appropriateness of the resultant healthcare preventive plans.
2.1.3 - Diabetic ulcer
Foot ulcers are one of the severe consequences of diabetes and main reasons of morbidity (Reiber et al., 1998; Frykberg, 1991; Larsson et al., 1993; Levin, 1993; Bose, 1979; Benotmane et al., 2000; Van Houtum et al., 1996; Boulton et al., 2005; Ribu et al., 2007). According to statistics, 25% of individuals with diabetes will have a foot ulcer during their life and 70% of those who healed ulcers are in risk of them to reappear in 5 years (Palumbo and Melton, 1985; Apelqvist et al., 1993). There are several risk factors that result from the disease and lead to the development of diabetic foot ulcers, the main aspects are peripheral vascular disease, peripheral neuropathy, abnormal plantar pressure load and infection, which frequently leads to amputations (Edmonds et al., 1982; Shaw and Boulton, 1997).
In order to reduce the impact of the disease, and thus, decrease the occurrence of major ampu-tation, which was defined as a marker of the disease and its management, premature professional evaluation and treatment are obligatory (Jeffcoate and Van Houtum, 2004). Numerous assessment tools have been developed in order to classify ulcers with more accuracy, allowing the comparison of the results of routine management and treatments (Jeffcoate and Van Houtum, 2004; Oakley and Caterall, 1956; Shea, 1975; Jones et al., 1987; Kaufman et al., 1987).
Further, are presented the scales that are the most commonly used worldwide for the assess-ment of diabetic ulcers.
2.1.3.1 -
Wagner scale
The most commonly acknowledged assessment method for diabetic wound is the Wagner scale (Wagner Jr., 1981; Wagner Jr., 1986), which was developed in the 1970s. This scale scores wounds from 0 to 5 mainly according to the depth and severity of the ulcer as shown in Table 2.11 (Wagner Jr., 1981; Wagner Jr., 1986).
The first four grades (grade 0, 1, 2, and 3) are based on the physical depth of the lesion in and through the soft tissues of the foot. The last two grades (grade 4 and 5) are completely distinct when compared with the previous because they are based on the extent of gangrene and loss of tissue in the foot (Mark and Warren, 2007).
Table 2.11- The Wagner scale (Wagner Jr., 1981; Wagner Jr., 1986).
This scale is easy to memorise as a visual method, but does not comprises ulcer dimensions, pe-ripheral neuropathy, pepe-ripheral arterial disease nor the level of infection (Wagner Jr., 1986). This is due to the fact that infection is only ascertained in the grade 3 (Wagner Jr., 1981; Wagner Jr., 1986). This scale fails to recognise and define vascular disease as one risk feature. Besides, infected superficial wounds or dysvascular wounds cannot be categorised by this scale (Wagner Jr., 1981; Wagner Jr., 1986).
The best use of the Wagner scale is with the assistance of systems such as a ruler, grid or meas-uring tape that allows an objective assessment (Wagner Jr., 1981; Wagner Jr., 1986).
2.1.3.2 -
University of Texas Diabetic Wound Classification scale (UT)
The UT scale evaluates diabetic wounds via four stages and four grades, ulcer’s depth, wound infection and ischemia in the lower-extremities (Oyibo et al., 2001).
Relatively to the grades, grade 0 represents healing ulcers, grade 1 ulcers are superficial wounds through the epidermis or the epidermis and dermis, not penetrating on the tendon, capsule, or bone. Grade 2 wounds penetrate to tendon or capsule, without the bone and joints being involved. Grade 3 wounds penetrate to bone or into a joint.
Each wound grade consists of 4 stages: clean wounds (A), non-ischemic infected wounds (B), ischemic wounds (C), and infected ischemic wounds (D) (Table 2.12) (Oyibo et al., 2001; Lavery et al., 1996; Jain, 2012).
Grade Type of lesion
0 Pre- or post-ulcerative site
1 Superficial ulcer
2 Ulcer penetrating to tendon or joint capsule
3 Lesion involving deeper tissues
4 Forefoot gangrene
5 Whole foot gangrene involving more than two thirds of the foot
Table 2.12- The university of Texas diabetic wound classification system. Based on (Lavery et al., 1996).
Comparing the UT and the Wagner scale, the first is more descriptive and has shown a greater association with higher risk of amputation and likelihood of the healing process of ulcers, which is due to the combination of both grade and stage.
The assessment obtained with the UT scale can usually be predicted, at wounds of higher grade and stage, which are less likely to heal without revascularisation or amputation (Oyibo et al., 2001; Lavery et al., 1996). Being simple and easy to use, this scale shows good performance as predictor of clinical outcome, according to Oyibo et al. (Oyibo et al., 2001) for groups rather than individual patients.
A comparison between all of the described scales during this section of the chapter is performed in Table 2.13.
Stage Type of lesion
A No infection or ischemia
B Infection present
C Ischemia present
D Infection and ischemia present
Grade Type of lesion
0 Epithelialised wound
1 Superficial wound
2 Wound penetrates to tendon or capsule 3 Wound penetrates to bone or joint
Table 2.13- Comparison of all the scales mentioned in this report. Based on (Fearmonti et al., 2010; Reichel,
1958; Mark and Warren, 2007; Jain, 2012; Beeckman et al., 2007).
Type of wound Scale Inputs Strengths Limitations Higher risk
Cutaneous Vancouver Scar Scale (VSS) Vascularity Height/thickness Pliability Pigmentation
Used widely in literature for outcome measure in burn studies.
Not applicable for large and irregular scars High score does not neces-sarily mean worse scenario Excludes pain and pruritus.
High scores Seattle Scar Scale Surface irregularity Thickness Border height Colour Proved to be a useful tool for evaluation of the 4 parameters considered
Allows negative scores Lack of attention to symp-toms High scores Hamilton Scale Surface irregularity Thickness Colour Vascularity
Does not require training Lack of an assessment of subjective symptoms High scores
Patient and Observer Scar Assessment Scale (POSAS)
The observer scale: Vascularity
Pigmentation Thickness Relief Pliability
The patient scale: Pain Itching Colour Stiffness Thickness Irregularity
Focuses on scar severity from clinician’s and patient’s points of view
Items represented may not adequately express pa-tient’s perceptions and concerns
Cannot be used for young children High scores Manchester Scar Scale (MSS) Colour Matte vs shiny Contour Distortion Texture Applicable to a wider range of scars
Arbitrary assessment and
weighting of items High scores
Stony Brook Scar Evaluation Scale (SBSES) Width Height Colour Hatch marks Overall appearance Developed to assess short-term appearance of repaired lacerations
Does not include patient assessment
Not designed for long-term scar assessment Low scores Pressure ulcer Norton scale Physical condition Mental condition Activity Mobility Incontinence
Widely used for clinical evaluation of pressure ulcer risk
Shearing force and nutri-tion are not incorporated in the scale.
Overly simple
Low scores
Braden scale
Activity
Mobility Good sensitivity and reasonable specificity levels
Difficulty in distinguish
Nutrition Moisture
Friction and shear
Waterlow scale
Build/weight for height
Skin appearance in risk areas
Sex and age Continence Mobility Appetite Neurological deficit Special risks. Identifies significantly more risk factors than the Norton and Braden scale.
Has the assumption that women are at a higher risk of developing pressure ulcer than men. Risk of over assessment
High scores
Pressure ulcer scale for healing (PUSH)
Length/ width Exudate amount Tissue type
Does not requires inten-sive user training Easy to use
Not widely used
Has limited use in clinical practice and research
High scores
European Pres-sure Ulcer Advi-sory Panel scale
Anatomic limit of soft-tissue damage.
Widely used to deter-mine the severity of pressure ulcers.
Unambiguous descriptions of pressure ulcer grades Lack of distinction be-tween moisture lesions.
High grade number Diabetic ulcer University of Texas Diabetic Wound Classifi-cation scale Depth of ulcer penetration Presence of infec-tion
Widely used to deter-mine the severity of diabetic ulcers.
Do not include all the diabetic foot complications Cannot be used as a teach-ing tool.
High grade number and stage num-ber Wagner scale Physical depth of the lesion Simple to use and easy to remember
Does not take the presence of neuropathy or the size of the lesion into account.
High grade number
2.2 - Quantitative wound assessment
2.2.1 - Visual characterisation of wounds
One of the characteristics that can be added in order to obtain a more accurate diagnosis of the state of a wound is its aspect. This additional information provides vital evidences that can be help-ful when defining wound’s severity and the prediction of healing (Oduncu et al., 2004; Pereira et al., 2013).
In 1983 was developed the Red-Yellow-Black (RYB) wound colour classification (Hellgren and Vincent, 1986) as a simple practical method of assessing wounds used by physicians in a descriptive manner (Oduncu et al., 2004; Pereira et al., 2013; Hellgren and Vincent, 1986; Ballerini et al., 2010; Wannous et al., 2010; Dorileo et al., 2010; Zheng et al., 2004; Cuzzel, 1988).
The colours are descriptive of tissue types in the wound bed (Hellgren and Vincent, 1986): Red wounds are usually granulating and healing.
Yellow wounds have sloughy tissue adherent to the wound bed. Black wounds have necrotic tissue.