Article
J. Braz. Chem. Soc., Vol. 29, No. 10, 2117-2126, 2018 Printed in Brazil - ©2018 Sociedade Brasileira de Química*e-mail: [email protected]
Evaluation of the Suitability of Analytical Methods in Trichothecene A and B Degradation
Ana Carla P. Feltrin,a Karen V. M. Sibaja,a Cíntia Tusnski,a Sergiane S. Caldas,b Ednei G. Primelb and Jaqueline Garda-Buffon*,a
aLaboratório de Micotoxinas e Ciência de Alimentos, Escola de Química e Alimentos,
Universidade Federal do Rio Grande (FURG), Avenida Itália, km 8, Campus Carreiros, 96203-900 Rio Grande-RS, Brazil
bLaboratório de Análise de Compostos Orgânicos e Metais,
Programa de Pós-Graduação em Química Tecnológica e Ambiental, Escola de Química e Alimentos, Universidade Federal do Rio Grande (FURG),
Avenida Itália, km 8, Campus Carreiros, 96203-900 Rio Grande-RS, Brazil
An investigation was conducted to standardize conditions for laccase and lipase activity required to maximize trichothecene degradation. The analytical methods were suitable and validated in model solutions for detection of five analytes (T-2 toxin, deoxynivalenol, nivalenol, 3-acetyldeoxynivalenol and 15-acetyldeoxynivalenol), the methods were then applied in the degradation tests of these trichothecenes. The method of salting-out assisted liquid-liquid extraction (SALLE), using three different NaCl concentration levels, obtained recoveries in the range of 47.4-103.4% at pH 5.0 and 36.6-106.8% at pH 7.0, with an intra-day relative standard deviation under 15% for the majority of the compounds. Quantification limits remained in the region of 0.07 µg mL-1 for
15-acetyldeoxynivalenol and 0.3 µg mL-1 for nivalenol. Finally, the suitable analytical methods
were applied in a study of trichothecene degradation by enzymatic action, resulting in a reduction of 12.3% for T-2 toxin, 68.4% for deoxynivalenol, 50.2% for 3-acetyldeoxynivalenol and 45.4% for 15-acetyldeoxynivalenol.
Keywords: liquid chromatography, enzymes, mycotoxins, biodegradation
Introduction
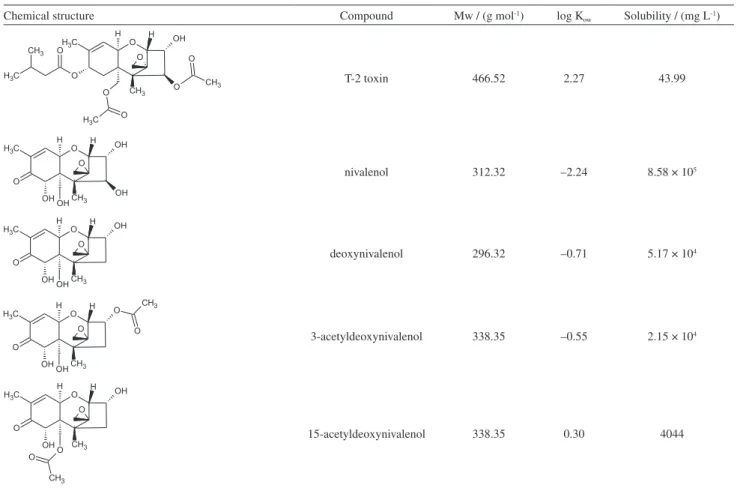
Trichothecenes (Table 1) are compounds that belong to one of the largest classes of mycotoxins. They are
produced by, among others, Fusarium spp., which can
contaminate a variety of grains and cereals, including
wheat, maize and barley.2,3 The mycotoxin groups are
divided into four types (A, B, C and D). The trichothecenes of interest in this article belong to two groups, type A (T-2 toxin (T-2)) and type B (deoxynivalenol (DON), nivalenol (NIV), 3-acetyldeoxynivalenol (3-ADON) and 15-acetyldeoxynivalenol (15-ADON)).
Trichothecenes have been shown to demonstrate multiple biological activities and have been reported as causes of hematological disorders, immunosuppression
and cytotoxicity.4 At a molecular level, these compounds
can inhibit the synthesis of DNA, RNA and proteins.5
The presence of mycotoxins in foods is a matter of global concern, for this reason there are tolerable doses
of exposure to these compounds in the countries of the European Union, Brazil, the United States of America,
Russia and China.6,7
The control of trichothecene formation is not easy to achieve, their presence and detection are inevitable,
leading to higher health risks for humans and animals.8 The
application of degradative or biodegradative techniques, resulting in trichothecene transformation or reduction of trichothecene levels, is extremely important to ensure food safety. Enzymes play a crucial role in the degradation process, their aim is to alter the chemical structure through stereospecific actions that can lead to detoxification without changing the technological and functional properties of the food. Hydrolytic and oxidoreductive enzymes are two
alternatives in the trichothecene degradation process.9,10
due to their wide availability, as well as their wide specificity of action on several substrates, giving them the
capability of transforming a wide range of compounds.11,12
However, the evaluation of decontamination or detoxification is a process that requires reliable and low cost analytical methods, making its application in research and industry feasible. High performance liquid chromatography (HPLC), perhaps the most frequently used technique for the determination of trichothecenes, has been used in many works mainly using an ultraviolet (UV)
detector.13,14 Gas chromatography (GC) can also be used as
a technique for trichothecene detection. Although GC has a high degree of accuracy for more volatile and nonpolar compounds, polar compounds can only be analyzed with the aid of derivatization, which increases the time and decreases the sensitivity of the analysis. For trichothecenes, derivatization is performed by silanization, acylation and
alkylation reactions.11,15 The development of a method
suitable for multiple mycotoxins, with a common sample preparation procedure, requiring only a final determination is highly desirable. Most analytical techniques used for the determination of trichothecenes proposed their extraction
from the food matrix into a solvent. In general, organic-solvent extraction is used to allow further concentration of the analyte for accurate measurement at low levels, another
important consideration is the extraction efficiency.16 In this
sense, the extraction is the critical stage, it should allow suitable recoveries of all compounds under investigation. In this study, the objective was to adopt a fast and inexpensive analytical method for trichothecene A and B extraction and quantification using HPLC-UV, then apply this method to evaluate the enzymatic degradation of these mycotoxins.
Experimental
Chemicals and reagents
Acetonitrile (MeCN), benzene (BZN) and chloroform
(CH3Cl) of HPLC grade were acquired from J.T.Baker
(USA). T-2, DON, NIV, 3-ADON, 15-ADON, p-nitrophenyl
butyrate (p-NPB), triton X-100, tetrahydrofuran (THF),
5 mmol L-1
2,2’-azino-bis(3-ethylbenzothiazoline-6-sulfonic acid) diammonium salt (ABTS), laccase from
Trametes versicolor and lipase from Aspergillus niger were
Table1. Chemical structures and physico-chemical properties of the compounds under study1
Chemical structure Compound Mw / (g mol-1) log K
ow Solubility / (mg L-1)
T-2 toxin 466.52 2.27 43.99
nivalenol 312.32 –2.24 8.58 × 10⁵
deoxynivalenol 296.32 –0.71 5.17 × 10⁴
3-acetyldeoxynivalenol 338.35 –0.55 2.15 × 10⁴
15-acetyldeoxynivalenol 338.35 0.30 4044
obtained from Sigma-Aldrich (St. Louis, USA). Phosphate buffer sodium (PBS) (pH 5.0 and 7.0), acetate buffer sodium (ABS) (pH 4.5) and sodium chloride (NaCl) were obtained from Synth (São Paulo, Brazil), all were analytical
grade. The water was purified in a Direct-QUV3® system
(resistivity 18.2 MΩ cm, Millipore, USA).
Preparation of the enzyme model solution and trichothecene A and B standard solutions
The enzymatic activities of laccase and lipase were determined by solubilization of 0.1 g of enzyme in 10 mL of ultrapure water. From this solution, successive dilutions were then made to the suitable concentration required for enzymatic activity determination. T-2, DON, NIV, 3-ADON and 15-ADON stock solutions were
prepared following the procedure described by AOAC.17
The stock solution concentration was determined by the m/v ratio and confirmed by the method described
by Bennett and Shotwell18 for T-2 and Krska et al.13 for
type B trichothecenes, using molar absorptivity. All these solutions were kept in safety conditions at –10 °C. The physico-chemical characteristics of the compounds under investigation are listed in Table 1.
The enzyme model solution consisted of buffer solution (without substrate addition). For laccase, phosphate buffer
(50 mmol L-1, pH 5.0) was used, and for lipase, phosphate
buffer (50 mmol L-1, pH 7.0) was used.
Suitability of the analytical method of trichothecene A and B determination
Trichothecene A and B separation and determination was performed through an adaption of the method proposed
by Souza et al.19 The trichothecene concentrations were
determined according to Feltrin et al.,20 using an LC 20A
Prominence HPLC system (Shimadzu, Kyoto, Japan) equipped with a UV detector (SPD-20A), a system controller (CBM-20A), a column oven (CTO-20AC), an autosampler (SIL-20AHT) and an online degasser (DGU-20A5). The chromatograms were analyzed by LC solution data acquisition software (Shimadzu, Kyoto, Japan). The chromatographic system was equipped with a Gemini 5 µm C-18 column (Phenomenex, Torrance, USA)
with 250 mmlength × 4.6 mm inner diameter, the mobile
phase consisted of a mixture of ultrapure water (30%) and MeCN (70%) (v/v), and was used in isocratic mode. The compound separation was achieved using a wavelength gradient, 220 nm to 7 min of chromatographic run and, thereafter, the wavelength of 193 nm until the end of the analysis. The injection volume was 20 µL and the mobile
phase flow maintained at 0.5 mL min-1. The trichothecene
identification was performed by comparing the retention time of the compounds and the absorption spectrum in an HPLC-DAD (HPLC-diode array detector) system (Waters, Milford, MA, USA), using the same chromatographic conditions as HPLC-UV. Trichothecene degradation was estimated by comparing the chromatographic peak areas under investigation in HPLC-UV and the calibration curve of standard solutions.
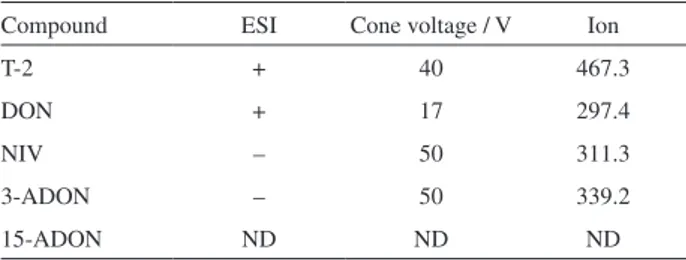
The LC-MS/MS (liquid chromatography tandem mass spectrometry) acquisition parameters that were used for the analysis of the trichothecenes in the samples are shown in
Table 2, and were according to Dors et al.21
LC-MS/MS was used to confirm the presence of trichothecenes in the model solution. Chromatography was carried out on a 50 mm length × 3 mm inner diameter, Phenomenex Kinetex (2.6 µm particle) column at a temperature of 40 °C. The injection volume was
10 µL, and the flow rate was set at 0.5 mL min-1. A liquid
chromatograph Alliance Separations 2695 Waters system (Milford, MA, USA) was used with an MS detector Micromass® Quatro Micro™ API Waters with API (atmospheric pressure ionization) source, a thermostated autosampler, and electrospray ionization mode (ESI). Data acquisition was performed with MassLynx 4.0 (Waters, Milford, USA) software.
Sample preparation
In the reactor, trichothecene standard solution corresponding to 1 µg was added, the solvent was dried under an atmosphere of nitrogen and solubilized in model solution by agitation using a vortex (30 s) followed by an ultrasonic bath (3 min). After that, two extraction methods, liquid-liquid extraction (LLE) and salting-out assisted liquid-liquid-liquid-liquid extraction (SALLE) were evaluated. This evaluation was performed in both model solutions due to the pH difference.
Table2. Parameters for the determination of trichothecenes in model solution
Compound ESI Cone voltage / V Ion
T-2 + 40 467.3
DON + 17 297.4
NIV – 50 311.3
3-ADON – 50 339.2
15-ADON ND ND ND
LLE was evaluated according to the method of
Garda et al.,22 with adaptations. To 1 mL of model solution
containing the solubilized trichothecenes, 3 mL of CH3Cl
was added and agitated with a vortex (30 s), and then placed in an ultrasonic bath (3 min). This operation was repeated twice to ensure the total transference of compounds to the extraction solvent. The aliquots removed were combined and dried under a nitrogen atmosphere. Recovery was evaluated according to equation 1.
(1)
SALLE was performed according to the method
proposed by Tabata et al.23 with adaptations for this
work. To 1 mL of model solution with the solubilized trichothecenes, 2.33 mL of MeCN (extraction solvent) was added, followed by agitation with a vortex (30 s) and placed in an ultrasonic bath (3 min). For this, 0.5 g of NaCl was added, after phase separation, the MeCN phase was withdrawn. This extraction was repeated twice, with addition of 1 and 0.5 mL of MeCN, to ensure the total extraction of the trichothecenes. MeCN phases were combined and dried under a nitrogen atmosphere to concentrate the samples. Different weights of NaCl (0.1, 0.25 and 0.5 g) were evaluated, aimed at determining the best separation of compounds to the organic phase. Recoveries were evaluated according to equation 1.
Analytical method validation in HPLC-UV
The linearity of each calibration curve was determined through the preparation of 7 points with different concentration levels for T-2, DON, NIV, 3-ADON and 15-ADON in MeCN, injected into HPLC-UV system. Curves were constructed with simultaneous analysis and separated for acetylate metabolites. Calibration equations
were obtained by plotting the signal area versus compound
concentration. Analytical limits were shown based on the limit of detection (LOD) and limit of quantification (LOQ) for each trichothecene, which were estimated through successive dilutions to establish signal/noise. The determination occurred by evaluating the analyte concentration or weight that produces a signal 3 times (LOD) and 10 times (LOQ) greater than the system noise
signal.24 Intra-day variation was evaluated for method
precision, where experiments were determined through 10 consecutive injections, on the same day and with
the same equipment. The solution contained 1 µg mL-1
of trichothecene mixture (T-2, DON, NIV, 3-ADON, 15-ADON and ADONS (3-ADON + 15-ADON)). The optimized extraction procedure was tested for its recoveries
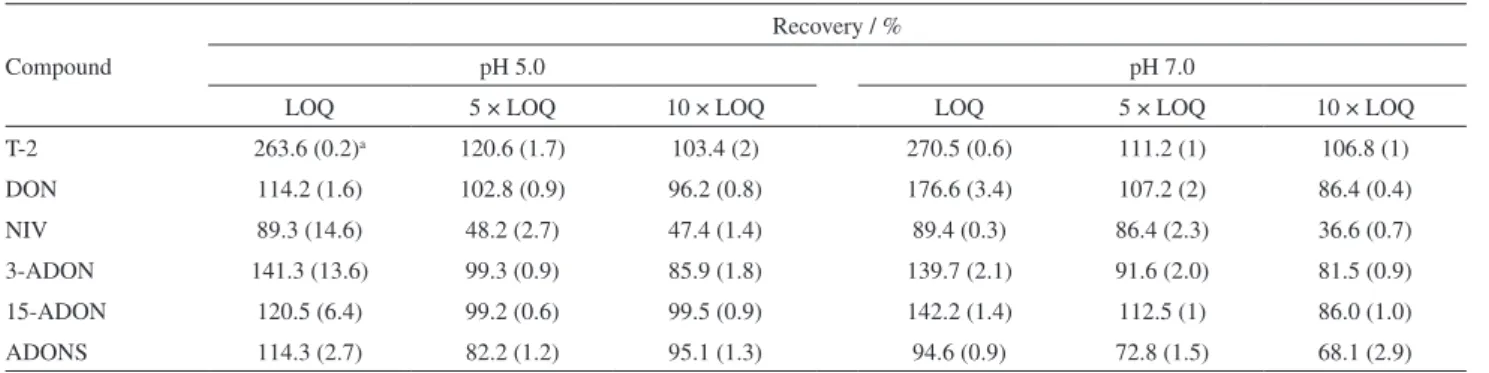
at 3 levels of contamination (1, 5 and 10 times LOQ) at pH 5.0 and 7.0 for T-2, DON, NIV, 3-ADON, 15-ADON and ADONS. Each test was performed in triplicate and the calculated recovery values were based on equation 1.
Trichothecene biodegradation
The model solution for the standardization of enzymatic degradations was evaluated to determine optimal conditions by using different reaction conditions (pH and salt concentration). The evaluation of the enzymatic reaction system occurred at pH 5.0 and 7.0, using a phosphate buffer
concentration of 0.05 mol L-1 for both enzymes. Enzymatic
activity (U mL-1) was used to express the results obtained.
Assays to evaluate trichothecene A and B degradation by the application of the enzymes in the model solution were conducted in triplicate, under the optimal conditions (as previously determined). Trichothecene concentrations
were maintained at 1 µg mL-1, the enzyme concentrations
were 0.67 U mL-1 for laccase and 0.01 U mL-1 for lipase,
according to the concentration obtained after standard dilutions in previous studies (unpublished results). Model solution incubation occurred under constant shaking (150 rpm) for 120 min for both enzymes in the study. Equations 2 and 3 evaluate degradation and reaction velocity, respectively.
(2)
(3)
where Concentrationresidual is the trichothecene residual level
after reaction time; Concentrationinitial is the trichothecene
spiked level; U mL-1 is the enzymatic amount added to the
model solution; and t is the reaction time (min).
Enzymatic activity measurement
The T. versicolor laccase activity obtained was
determined according to Tavarez et al.,25 substrate
oxidation was monitored spectrophotometrically at 420 nm,
considering ε
420 to ABTS = 36000 M-1 cm-1. Laccase activity
(unit: U) was defined as the enzyme amount required to catalyze the oxidation of 1 µmol of ABTS in 1 min. In these
systems, the activity was evaluated in U mL-1, according
to equation 4.
where Abs is the absorbance; fdil is the sample dilution
factor; Vr×n (mL) is the reaction volume; 103 is the
conversion factor to L from mL; ε is the substrate coefficient
of molar absorptivity; t is the reaction time (min); and V is the enzymatic volume added in the reaction environment (mL).
The activity of lipase from A. niger was determined
spectrophotometrically at 405 nm, following p-NPB
hydrolysis (coefficient of molar absorptivity of
p-nitrophenol ε
405 = 15245 M-1 cm-1).26 An activity unit
was defined as the amount of lipase sufficient to release
1 µmol of p-nitrophenol in 1 min under specific conditions,
according to equation 4.
Statistical analysis
Data statistical analysis was performed by ANOVA, taking into consideration the test means of repetitions,
followed by Tukey’s test and Student’s t-test. Variables
under study were the estimated enzymatic activities
(U mL-1).
Results and Discussion
Trichothecenes A and B determination
With the current legislation6 to control tolerable limits
of trichothecenes in foods in Brazil and worldwide, it is necessary for industries to adapt to these recommended levels of the compounds in food, for the safety of the final consumer. However, the possible acquisition and availability of the highly sensitive equipment required for the detection of mycotoxins can be major stumbling blocks in the process, especially when taking into account the demand for products and raw materials. HPLC-UV is routinely employed in the detection of trichothecenes with good accuracy and precision. Among the methods used to detect these compounds, HPLC has the advantage of not
requiring the derivatization step prior to detection.27 In
this study, we aimed to adopt an analytical method using HPLC-UV for the quantification of the trichothecenes in a model solution. Thereby, it is possible to quantify these compounds in both raw materials and food products, as well as applying the method in the degradation evaluation of trichothecenes.
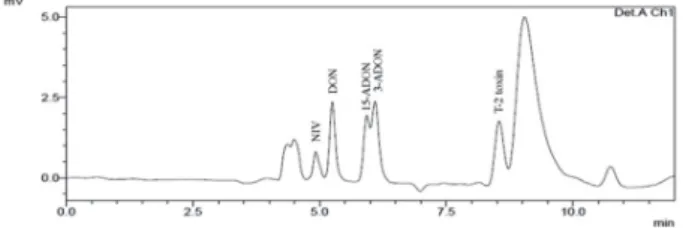
A representative chromatogram of the compound mixture is illustrated in Figure 1. As shown on the chromatogram, 3-ADON and 15-ADON proved impossible to resolve in both HPLC systems (HPLC-UV and HPLC-DAD), and also LC-MS/MS. This result is in
agreement with the literature.28,29 It can be observed
that the 2 isomers overlap, thus these compounds were analyzed jointly and separately. In view of the presence of other peaks in the chromatographic analysis, it was necessary to use HPLC-DAD and LC-MS/MS analyses, thus confirming the identity of the peaks of the compounds, highlighted in Figure 1. The other peaks found are equivalent to the dissolution solvent (MeCN), which is
different from the mobile phase (MeCN:H2O), which
provides greater stability for the storage of the samples because the compounds under study do not present stability in water.
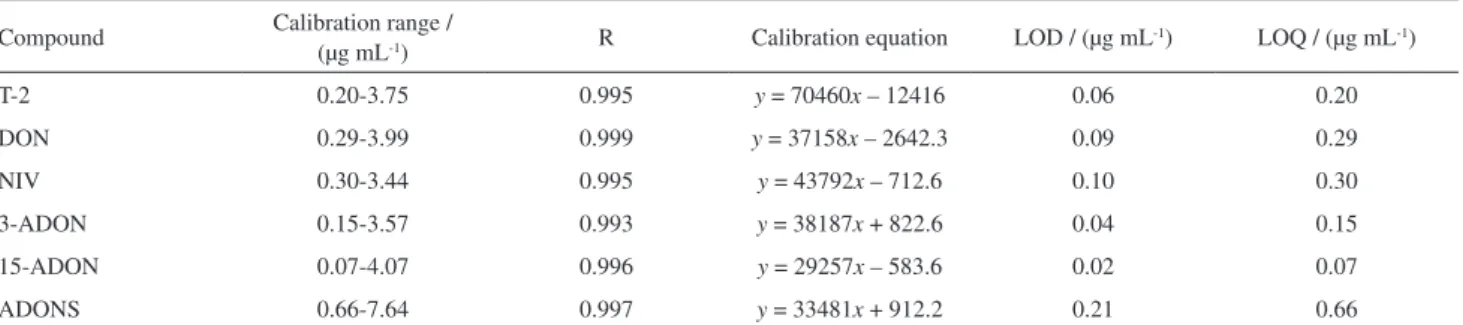
The procedure of validation in HPLC-UV characterizes the performance of the method ensuring its suitability for trichothecene identification, confirmation and quantification. The method was evaluated in terms of linearity, analytical limits, precision (intra-day variability) and recovery. Table 3 presents the calibration curves, good linearity was observed as demonstrated by the correlation coefficients, being between 0.993 for 3-ADON and 0.999 for DON. LOD and LOQ showed that the sensitivity of the trichothecene analysis was at a level that was suitable for following the mycotoxin biodegradation process.
Sample preparation
An analytical study aims to obtain qualitative and quantitative data for one or more compounds of a sample. A vital consideration requiring evaluation is the environment in which the compounds are resuspended, in our case, the buffer solution. The buffer is considered an important component of chemical and biochemical systems, so compounds can achieve an optimal stability or for a reaction to be performed under controlled conditions of pH and
ionic strength,30 which may influence product extraction.31
The important influence the buffer has in the analysis was observed in our study, which confirmed the necessity to use a suitable extraction method in order to obtain a clear chromatographic analysis.
Commonly, the two favored extraction methods for trichothecenes are LLE and solid phase extraction (SPE). LLE is currently considered a classic extraction technique,
which advantages are its simplicity and low cost. However,
on the downside, a large volume of toxic solvent is used.32
The use of this technique has been reported in mycotoxin analysis utilizing water-immiscible organic solvents, but these demonstrated low recoveries for the majority of
mycotoxins, as shown by Gupta et al.33
Furthermore, since 1980, methods using chlorinated solvents have been avoided due to environmental concerns and the possible deleterious effects on the health of the analysts. These issues led to the development of several
new methods.34 In this study, the use of an extraction
method using a water-immiscible organic solvent (CH3Cl)
was demonstrated (Table 4). MeCN, when inserted in most organic systems, allows clean extraction, when used with the addition of salt, it also results in a lower water content than when a mixture of alcohol and acetone is used.
Considering the low recovery, it was necessary to evaluate a second extraction technique for the compounds: SALLE. SALLE is a homogeneous type of LLE which uses a dilution effect to separate water from a miscible solvent, such as MeCN. The use of SALLE has already been described for the extraction of a range of drugs and their metabolites from several aqueous samples, including
biofluids.35 According to the literature, there have been
no studies about trichothecene extraction from a model solution using this technique. Although several inorganic salts have been used in SALLE, this research employs sodium chloride for phase separation, due to its low cost.
Additionally, MeCN was used as a water-miscible solvent and trichothecene extraction agent. NaCl was used as a reagent in order to avoid emulsion formation due to its high ionization index, producing clean and light phase separation. Once the samples were extracted with the MeCN layer, the extracts were initially concentrated, then diluted and injected or directly injected from SALLE. These results in a simple, fast and environmentally friendly method, while being comparable with LLE in terms of extract cleaning.
In the case of NIV, as can be seen in Tables 4 and 5, it was impossible to extract it from the model system by SALLE. For this reason, it was decided not to evaluate NIV degradation analysis. These results can be explained by two possibilities. Firstly, it could be the result of the compound having four hydroxyl groups in its structure (Table 1), which can facilitate hydrogen bond formation with phosphate groups present in the buffer, making its extraction difficult. The second possibility considers log Kow (Table 1), which describes the distribution of a solute between an aqueous
Table3. Linearity values, trichothecene LOD and LOQ in HPLC-UV
Compound Calibration range /
(µg mL-1) R Calibration equation LOD / (µg mL
-1) LOQ / (µg mL-1)
T-2 0.20-3.75 0.995 y = 70460x – 12416 0.06 0.20
DON 0.29-3.99 0.999 y = 37158x – 2642.3 0.09 0.29
NIV 0.30-3.44 0.995 y = 43792x – 712.6 0.10 0.30
3-ADON 0.15-3.57 0.993 y = 38187x + 822.6 0.04 0.15
15-ADON 0.07-4.07 0.996 y = 29257x – 583.6 0.02 0.07
ADONS 0.66-7.64 0.997 y = 33481x + 912.2 0.21 0.66
R: correlation coefficient; LOD: limit of detection; LOQ: limit of quantification; T-2: T-2 toxin; DON: deoxynivalenol; NIV: nivalenol; 3-ADON: 3-acetyldeoxynivalenol; 15-ADON: 15-acetyldeoxynivalenol; ADONS: 3-ADON + 15-ADON.
Table4. Comparison between LLE and SALLE extraction methods
Compound
Recovery / %
LLE SALLE
PBS 0.05 mol L-1
pH 5
PBS 0.05 mol L-1
pH 7
PBS 0.05 mol L-1
pH 5
PBS 0.05 mol L-1
pH 7
T-2 80.0 (0.5) 38.0 (0.8) 103.4 (1.8) 106.8 (1.2)
DON 43.7 (6.9)a 46.3 (0.5) 96.2 (0.8) 86.5 (0.4)
NIV 13.7 (1.8) 15.0 (2.8) 47.4 (1.4) 36.6 (0.7)
3-ADON 58.2 (0.9) 67.2 (0.9) 86.0 (1.8) 81.5 (0.9)
15-ADON 102.4 (0.4) 73.3 (0.1) 99.5 (0.9) 86.0 (1.0)
aCoefficient of variation of experiments in triplicate. LLE: liquid-liquid extraction; SALLE: salting-out liquid-liquid extraction; PBS: phosphate buffer
and organic phases. In the case of NIV, low values of Kow represent a compound trend to be held in aqueous phase,
and not released into the organic phase.36 For the other
trichothecenes, recoveries varied between 82.2-120.6% at pH 5.0 and 72.8-112.5% at pH 7.0 (Table 5). The recovery data are within the criteria adopted by European Regulatory
Committee (EC No. 401/2006)37 that governs analytical
methods used for trichothecene determination, it states acceptable recovery ranges should be 70-120% for DON, and 60-130% for T-2.
Regarding the recovery of T-2 with fortification level equivalent to LOQ, it is possible to observe that the recoveries were around 265%. This is related to the model system and its effect of increase in the resulting signal. The maximum absorption wavelength of T-2 (193 nm) allows other chemical groups to present as potential interferents when performing such low T-2 concentrations. However, this effect is minimized when higher levels of T-2 concentration have been evaluated, since the interfering concentration of the model system remains constant.
Furthermore, it is interesting to note the lower recovery at pH 7.0 when compared to pH 5.0, however, these percentages are still within the acceptable range for
analytical procedures.24 The decrease at pH 7.0 compared
to 5.0 shows a difference of approximately 11% in recovery, which demonstrates that pH adjustment should be considered during trichothecene extraction.
With pH alteration in SALLE, the compound distribution coefficient is changed, thus, both aqueous phase and extractive phase can retain the analytes. According to
Saien and Daliri,38 in an investigation of the influence of
aqueous phase pH on mass transfer rate, it was possible to notice a significant reduction of the aqueous phase with pH increment, which was attributed to hydroxyl ion adsorption. During the partition step, the salt addition to the aqueous phase has a direct effect on the polarity range covered by the
method, thus increasing its polarity and leading to higher
recoveries of polar analytes.39
From the coefficient of variation (CV) values of the recovery method expressed in Table 5, it can be concluded that the instrumental precision was suitable for the use of this method in trichothecene degradation assays, when values above the quantification limits were used. In this work, the influence of NaCl on the recovery percentage was evaluated only in DON, because this compound presents the lowest recoveries in relation to the other trichothecenes and it has the highest polarity in relation to the other analytes in the study. When 0.1 g NaCl was added, a recovery of 36.2% with a CV of 10.3% was observed, with the addition of 0.25 g a recovery of 95.4% with a CV of 0.4% was found, and a recovery of 83.5% using 0.5 g with a CV of 3% was obtained. Thereby, 0.25 g of NaCl was established as the salt saturation point during extraction process.
Enzymatic activity standardization
During the laccase enzymatic evaluation, the determinations were made using an acetate buffer as a reaction buffer. However, that differed from the lipase analysis which used a phosphate buffer. Thus, the influence of using different buffers was evaluated by
changing from acetate buffer pH 4.5 (0.05 mol L-1) to
phosphate buffer pH 5.0 (0.05 mol L-1). With the alteration
in model solution composition, the enzyme activity
changed from 8.3 to 7.9 U mL-1, with a significant level
of 90%, showing that the difference was not significant. The use of phosphate buffer pH 7.0 was also evaluated, where laccase activity was not observed (Table 6). This
is in agreement with the literature,40,41 laccases from
T. versicolor normally show a decreased activity when the pH is above 6.0. During oxidation of electron donating substrates, such as ABTS, laccase activity decreases with increasing pH. This occurs because protons are not
Table5. Accuracy of the method used at three different concentration levels
Compound
Recovery / %
pH 5.0 pH 7.0
LOQ 5 × LOQ 10 × LOQ LOQ 5 × LOQ 10 × LOQ
T-2 263.6 (0.2)a 120.6 (1.7) 103.4 (2) 270.5 (0.6) 111.2 (1) 106.8 (1)
DON 114.2 (1.6) 102.8 (0.9) 96.2 (0.8) 176.6 (3.4) 107.2 (2) 86.4 (0.4)
NIV 89.3 (14.6) 48.2 (2.7) 47.4 (1.4) 89.4 (0.3) 86.4 (2.3) 36.6 (0.7)
3-ADON 141.3 (13.6) 99.3 (0.9) 85.9 (1.8) 139.7 (2.1) 91.6 (2.0) 81.5 (0.9)
15-ADON 120.5 (6.4) 99.2 (0.6) 99.5 (0.9) 142.2 (1.4) 112.5 (1) 86.0 (1.0)
ADONS 114.3 (2.7) 82.2 (1.2) 95.1 (1.3) 94.6 (0.9) 72.8 (1.5) 68.1 (2.9)
aCoefficient of variation of experiments in triplicate. LOQ: limit of quantification; T-2: T-2 toxin; DON: deoxynivalenol; NIV: nivalenol; 3-ADON:
involved in this substrate oxidation and the pH influence on the compound redox potential is minimal. In our case, the enzymatic activity reduction is associated with the
bonding of a hydroxide ion (OH−) found in the enzyme
T2/T3 active center.42 Usually, the inhibition by OH− in
auto oxidation increases laccase stability in acidic pH.43
Mindful of this, the use of laccase was standardized in
phosphate buffer pH 5.0 (0.05 mol L-1). With the model
solution defined for the oxidative enzyme action, an evaluation of the hydrolytic enzyme reaction system at pH 5.0 was conducted (Table 6).
However, it was not possible to maintain this pH, since the change resulted in enzyme precipitation, which can be explained by the fact that this enzyme has a higher activity in alkaline conditions, between pH 6.0 and 10.0
being optimal.26,44 Therefore, the model solutions for the
enzyme application in trichothecene degradation assays
were established as phosphate buffer 0.05 mol L-1 at pH 5.0
for laccase and at pH 7.0 for lipase.
The intention of the reaction system evaluation is based on the enzyme application on trichothecenes, taking into consideration their stereospecific action. The hydrolytic enzymes act on the epoxide ring (forming a diol) or on acetyl bonds leading to a breakage of the steric hindrance formed by these groups, facilitating the oxidative enzyme access to the epoxide. Therefore, it is advantageous to use the sequential addition of hydrolytic and oxidative enzymes in the reaction system. However, there is a pH compatibility issue, since the hydrolytic enzymes have an action at pH 7.0 and, according to the data presented in this work, they do not have activity at
pH 5.0 (the pH established for laccase), and vice versa for
laccase. Therefore, the lipase enzyme was added to the reaction system first, and it was sustained under optimal conditions of enzymatic action. Then the pH of the system was changed to 5.0 to provide optimal enzymatic conditions before the addition of the laccase.
Trichothecene A and B biodegradation
Once the enzymatic reaction system was standardized and adapted to trichothecene determination, the enzymatic action on the degradation of trichothecenes was investigated.
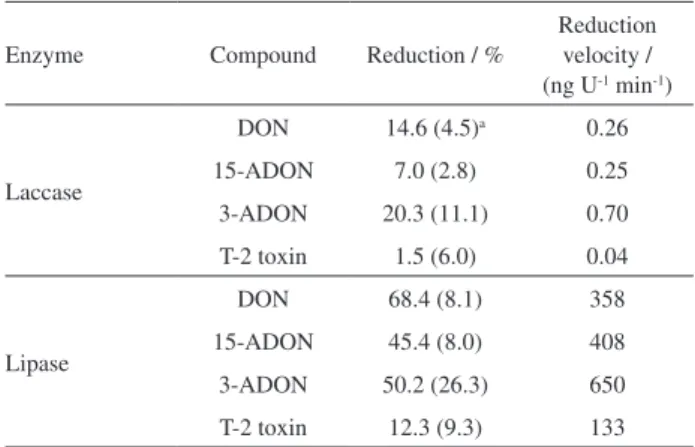
Table 7 presents the degradation percentages as well as the reduction velocity rate during interactions between trichothecenes and enzymes. Trichothecene degradation by laccase action is based on the enzyme causing epoxide ring opening, with two other possibilities: hydroxyl groups can be oxidized to ketones (3 groups in DON, 2 groups in 3-ADON and 15-ADON, and 1 group in T-2); and the promotion of an adsorption process also by the presence of hydroxyl groups through hydrogen bonds.
Laccases also have a stereospecific action on the oxidation of hydroxyl groups of phenolic rings (in the case of trichothecenes, the hydroxyl linked to carbon 7). The 15-ADON, acetylated derivative, showed a low percentage of degradation due to presence of an acetyl group that performs steric hindrance for the interaction of the laccase with the hydroxyl group, while in 3-ADON this is not observed. The T-2 toxin does not have a phenolic ring in its structure, which may explain the fact that it did not show degradation by the enzyme action. The reduction of trichothecene levels has been described in
the literature using other enzymes.9 That study correlated
DON degradation with the peroxidase enzymatic
activity produced by Aspergillus oryzae and Rhizopus
oryzae. R. oryzae caused the greatest decrease in DON concentration, approximately 90% in 240 h, compared with
74% reduction in 96 hfor A. oryzae.
DON degradation was attributed to the oxidative action of the peroxidase on the epoxide ring, consequently leading to the loss of its toxicity. Another study was performed by
Gautério et al.,45 where the peroxidase enzyme obtained
and purified from rice bran was used in a model system resulting in a reduction of 81.7% of DON. The authors
Table6. pH evaluation of model solution in phosphate buffer
Enzyme Enzymatic activity / (U mL
-1)
pH 5.0 pH 7.0
Laccase 7.9 0
Lipase 0 0.1
Table7. Reduction of trichothecene A and B (1 µg mL-1) by enzymatic
action. 0.67 U mL-1 laccase and 0.001 U mL-1 lipase were added to the
reaction system
Enzyme Compound Reduction / %
Reduction velocity / (ng U-1 min-1)
Laccase
DON 14.6 (4.5)a 0.26
15-ADON 7.0 (2.8) 0.25
3-ADON 20.3 (11.1) 0.70
T-2 toxin 1.5 (6.0) 0.04
Lipase
DON 68.4 (8.1) 358
15-ADON 45.4 (8.0) 408
3-ADON 50.2 (26.3) 650
T-2 toxin 12.3 (9.3) 133
aCoefficient of variation of experiments in triplicate. DON: deoxynivalenol;
emphasize that they cannot affirm whether there is actually an oxidative action of the enzyme on the trichothecene structure. They proposed the hypothesis that the proteins show adsorption capacity due to active groups present on the protein surface, which may occur in substitution of the oxidative mechanism.
Schmeitzl et al.46 published a study about the isolation
and characterization of a carboxylesterase enzyme from
Brachypodium distachyon in trichothecene deacetylation. 3-ADON, 15-ADON and T-2 showed 100% of deacetylation
after 24 h of exposure. The Michaelis-Menten (KM)
constant, which shows the affinity of an enzyme for its substrate, revealed that carboxylesterase had a major
affinity to 15-ADON (421 µmol L-1) compared to the
substrate p-NPB (5530 µmol L-1). Assays with 3-ADON
revealed substrate inhibition of the enzyme with increasing concentration.
The data presented from our work represents a preliminary study, which demonstrated that optimization can be used to provide even more promising degradation values. The use of enzymes with high purification grade and low cost, presented in this work, represents a significant advance to the works mentioned so far, in terms of velocity, time and selectivity in enzymatic action specificity. Although all the conclusions presented are hypotheses, they are supported by the mechanisms and kinetics of the enzymatic action evaluated for the degradation process. Thus, our results emphasize that laccase and lipase have degradative action on trichothecenes.
Considering the new approaches of Green Chemistry, which aims to eliminate hazardous substances from chemical processes, the use of enzymes in this work stands out as a fundamental tool to achieve the objectives of Green Chemistry. Enzymes are not harmful and also minimize the production of toxic waste. The use of the enzymes under study in food industry processes has been demonstrated, which emphasizes the importance of our results. Hazing is a quality defect in beer that is characterized by “cloudiness” in the final product. Laccase can be added to the wort or at the end of the process to remove the polyphenols that may still remain in the beer. The polyphenol complexes, formed by the laccase, can be separated via filtration and thus this reduces the probability of the hazing effect from occurring. Laccase can also remove excess oxygen in beer and increase its storage life. In fruit juices, such as apple and grape, excess oxidation of phenolic compounds causes negative effects on the taste, color, odor and mouthfeel. Laccase has been proposed to delay the oxidation of polyphenols and stabilize the juice. In case of lipases, the enzymes serve as important roles in human practices as ancient as yogurt and cheese fermentation.
Conclusions
After the evaluation of the performance characteristics, suitable analytical methods for enzymatic activity determination and trichothecene extraction were applied with success in trichothecene A and B enzymatic degradation analysis. Compared with other methodologies for trichothecene determination, this was easy and fast to perform and the SALLE method showed good extraction of the compounds. In terms of the degradation process being applied in food industry, when considering the use of trichothecene reduction agents, it is necessary to use a low-cost process which does not result in the generation of chemical residues. Also, it is necessary to show a reduction in trichothecene levels and to manufacture a final product that is totally decontaminated or has levels lower than that legislated. Our results show that the process developed is applicable to the reduction of trichothecenes on an industrial scale. This work opens the way for the development of other investigations on the subject, considering that the degradation process developed in this study is a potential candidate in the application of the removal of trichothecenes from food products, such as beer, juice, pasta, breads and biscuits, among others. The application of these enzymes also becomes an alternative, when used in food raw materials and processed food products, for the reduction of other contaminants, such as mycotoxins (in general), estrogenic endocrine disruptors, agrochemicals and antimicrobials.
Acknowledgments
The authors thank the financial support of Coordination of Superior Level Staff Improvement, National Research Council (CNPq), Foundation for Research in the State of Rio Grande do Sul (FAPERGS) and Federal University of Rio Grande (FURG).
References
1. http://www.chemspider.com/, accessed in May 2017. 2. Guan, S.; He, J.; Young, J. C.; Zhu, H.; Li, X.-Z.; Ji, C.; Zhou,
T.; Aquaculture 2009, 290, 290.
3. Ma, Y.; Zhang, A.; Shi, Z.; He, C.; Ding, J.; Wang, X.; Ma, J.; Zhang, H.; Toxicol. In Vitro 2012, 26, 414.
4. Wu, W.; Flannery, B. M.; Sugita-Konishi, Y.; Watanabe, M.; Zhang, H.; Pestka, J. J.; Food Chem. Toxicol. 2012, 50, 2056.
6. Agência Nacional de Vigilância Sanitária (ANVISA); Limites Máximos Tolerados (LMT) para Micotoxinas em Alimentos, RDC No. 59, 2013.
7. García-Cela, E.; Ramos, A. J.; Sanchis, V.; Marin, S.; Food Control 2012, 25, 797.
8. Ndossi, D. G.; Frizzell, C.; Tremoen, N. H.; Faeste, C. K.; Verhaegen, S.; Dahl, E.; Eriksen, G. S.; Sorlie, M.; Connolly, L.; Ropstad, R.; Toxicol. Lett. 2012, 214, 268.
9. Garda-Buffon, J.; Kupski, L.; Badiale-Furlong, E.; Food Sci. Technol. 2011, 3, 198.
10. Karlovsky, P.; Appl. Microbiol. Biotechnol. 2011, 91, 491. 11. Meneely, J. P.; Ricci, F.; van Egmond, H. P.; Elliott, C. T.; Trends
Anal. Chem. 2011, 30, 192.
12. Torres, E.; Bustos-Jaimes, I.; Borgne, S. L.; Appl. Catal. B 2003, 46, 1.
13. Krska, R.; Schubert-Ullrich, P.; Josephs, R. D.; Emteborg, H.; Buttinger, G.; Pettersson, H.; van Egmond, H. P.; Schothorst, R. C.; MacDonald, S.; Chan, D.; Anal. Bioanal. Chem. 2007, 388, 1215.
14. Pascale, M.; Panzarini, G.; Visconti, A.; Talanta 2012, 89, 231. 15. Ran, R.; Wang, C.; Han, Z.; Wu, A.; Zhang, D.; Shi, J.; Food
Control 2013, 34, 138.
16. Juan, C.; Ritieni, A.; Mañes, J.; Food Chem. 2012, 134, 2389. 17. Association of Official Analytical Chemists (AOAC); Official
Methods of Analysis of AOAC International, 16th ed., vol. 2; AOAC International: Washington, 1995.
18. Bennett, G. A.; Shotwell, O. L.; J. - Assoc. Off. Anal. Chem.
1990, 73, 270.
19. Souza, T. D.; Caldas, S. S.; Primel, E. G.; Badiale-Furlong, E.; Food Control 2015, 50, 789.
20. Feltrin, A. C. P.; Fontes, M. R. V.; Gracia, H. D. K.; Badiale-Furlong, E.; Garda-Buffon, J.; Quim. Nova 2017, 40, 908. 21. Dors, G. C.; Caldas, S. S.; Hackbart, H. C. S.; Primel, E. G.;
Fagundes, C. A. A.; Badiale-Furlong, E.; J. Agric. Food Chem.
2013, 61, 1985.
22. Garda, J.; Macedo, R. M.; Badiale-Furlong, E.; Food Sci. Technol. 2004, 24, 657.
23. Tabata, M.; Kumamoto, M.; Nishimoto, J.; Anal. Sci. 1994, 10, 383.
24. European Commission; Guidance Document on Analytical Quality Control and Method Validation Procedures for Pesticide
Residues Analysis in Food and Feed, 2015. Available at https:// ec.europa.eu/food/sites/food/files/plant/docs/pesticides_mrl_ guidelines_wrkdoc_11945.pdf, accessed in April 2018. 25. Tavarez, A. P. M.; Silva, C. G.; Drazic, G.; Silva, A. M. T.;
Loureiro, J. M.; Faria, J. L.; J. Colloid Interface Sci. 2015, 454, 52.
26. Ghati, A.; Paul, G.; Process Biochem. 2015, 50, 771. 27. Lattanzio, V. M. T.; Solfrizzo, M.; Girolamo, A.; Chulze, S. N.;
Torres, A. M.; Visconti, A; J. Chromatogr. B 2011, 879, 707.
28. Zhao, Z.; Rao, Q.; Song, S.; Liu, N.; Han, Z.; Hou, Z.; Wu, A.; J. Chromatogr. B 2014, 963, 75.
29. Flores-Flores, M. E.; Gonzalez-Peñas, E.; J. Chromatogr. A
2015, 1419, 37.
30. Sheraz, M. A.; Kazi, S. H.; Ahmed, S.; Mirza, T.; Ahmad, I.; Evstigneev, M. P.; J. Photochem. Photobiol., A 2014, 27, 17. 31. Caldas, S. S.; Gonçalves, F. F.; Primel, E. G.; Prestes, O. D.;
Martins, M. L.; Zanella, R.; Quim. Nova 2011, 34, 1604. 32. Turner, N. W.; Bramhmbhatt, H.; Szabo-Vezse, M.; Poma, A.;
Coker, R.; Piletsky, S. A.; Anal. Chim. Acta 2015, 901, 12. 33. Gupta, M.; Jain, A.; Verma, K. K.; Talanta 2009, 80, 526. 34. Anastassiades, M.; Lehotay, S.; Stajnbaher, D.; Schenck, F. J.;
J. AOAC Int. 2003, 86, 412.
35. Tang, Y. Q.; Weng, N.; Future Sci. 2013, 5, 1583.
36. Lyman, W. J.; Reehl, W. F.; Rosenblatt, D. H.; Handbook of Chemical Property Estimation Methods: Environmental
Behavior of Organic Compounds; McGraw-Hill: New York, 1982.
37. European Commission; Commission Regulation (EC) No. 401/2006 of 23 February 2006, Laying Down the Methods of Sampling and Analysis for the Official Control of the Levels
of Mycotoxins in Foodstuffs; Official Journal of the European Communities: Brussels, 2006, L70, 12 and 34. Available at https://eur-lex.europa.eu/legal-content/EN/TXT/HTML/?uri= CELEX:32006R0401&from=EN, accessed in April 2018. 38. Saien, J.; Daliri, S.; Ind. Eng. Chem. Res. 2008, 47, 171. 39. Prestes, O. D.; Friggi, C. A.; Adaime, M. B.; Zanella, R.; Quim.
Nova 2009, 32, 1620.
40. Brown, M. A.; Zhao, Z.; Mauk, A. G.; Inorg. Chim. Acta 2012, 331, 232.
41. Catapane, M.; Nicolucci, C.; Menale, C.; Mita, L.; Rossi, S.; Mita, D. G.; Diano, N.; J. Hazard. Mater. 2013, 248-249, 337. 42. Morozova, O. V.; Shumakovich, G. P.; Gorbacheva, M. A.;
Shleev, S. V.; Yaropolov, A. I.; Biochemistry (Moscow) 2007, 72, 1136.
43. Gianfreda, L.; Xu, F.; Bollag, J.-M.; Biorem. J. 2010, 3, 1. 44. Yan, Q.-J.; Yang, S.-Q.; Duan, X.-J.; Xu, H.-B.; Liu, Y.; Jiang,
Z.-Q.; J. Mol. Catal. B: Enzym. 2014, 109, 76.
45. Gautério, G. V.; Malta, D. S.; Reginatto, L.; Feltrin, A. C. P.; Garda-Buffon, J.; Kalil, S. J.; J. Chem. Technol. Biotechnol.
2017, 92, 1998.
46. Schmeitzl, C.; Varga, E.; Warth, B.; Kugler, K. G.; Malachová, A.; Michlmayr, H.; Wiesenberger, G.; Mayer, K. F. X.; Mewes, H.-W.; Krska, R.; Schuhmacher, R.; Berthiller, F.; Adam, G.; Toxins 2015, 8, 6.
Submitted: March 1, 2018
Published online: April 24, 2018