Enrique Martínez-Galán & Maria Paula Fontoura
Labour content of international trade in
intermediates: the case of Portugal
WP16/2017/DE/UECE
_________________________________________________________
De pa rtme nt o f Ec o no mic s
WORKING PAPERS
Labour content of international trade in intermediates: the case
of Portugal
Enrique Martínez-Galán *
* ISEG-Lisbon School of Economics and Management, University of Lisbon, and GPEARI - Office for Economic Policy and International Affairs of the Portuguese Finance Ministry
Maria Paula Fontoura **
** ISEG (Lisbon School of Economics and Management), University of Lisbon, and UECE (Research Unit on Complexity and Economics)
Corresponding Author:
Enrique Martínez-Galán*
The authors acknowledge the financial support from national funds by FCT (Fundação para a Ciência e a Tecnologia) under grant SFRH/BD/71528/2010 and the strategic project UID/ECO/00436/2013.
ABSTRACT
This paper addresses the relation between international trade and employment in Portugal with regard to the labour content of trade in intermediates. It considers both the overall level of employment and labour disaggregated by skills (high-skill, medium-skill and low-skill). The assessment makes use of the newly developed internationally linked input-output (IO) database named World Input-Output Database (WIOD), complemented with the Socio-Economic Accounts (SEA) for skill-types of labour. The period analysed – 1995-2009 - is the longest possible taking into account the two databases used. The amount of labour required to produce imported intermediates (exported intermediates) is taken as a proxy to the job effect of downward (upward) embeddedness of the country into Global Value Chains (GVCs). We conclude that intermediates’ exports are basically intensive in low-skilled labour although presenting a tendency to skill-upgrading during the period analysed, while intermediates’ imports are proportionally much more intensive in skilled labour, predominantly of a medium skill level, an expected result in a country of an intermediate level of development. We also concluded that the estimated net labour content of jobs in trade in intermediates in the final year of the period analysed was globally negative in 51 thousand jobs. Main net losses were observed with Brazil, People’s Republic of China and India, while main net gains were observed with Spain and France.
2
1. Introduction
The significant reduction in transaction costs associated with globalisation, caused mainly by the wide use of Information and Communication Technologies (ICT), allowed for the fragmentation of the stages of production in the second half of the 20th century, particularly since the 1990s, leading to the quick spread of the so called Global Value Chains (GVCs). This fragmentation of production had particular impact on international trade, with cross-border trade in intermediate goods becoming dominant in world merchandise trade. UNCTAD (2013) estimated that value chains administered by multinational enterprises accounted for 80% of global trade in 2010, while the World Economic Forum (2013) concluded that concerted action to reduce supply chain trade barriers could increase global Gross Domestic Product (GDP) up to six times more (by 4.7%) than removing all remaining import tariffs (0.7%).
Given the increasing importance of this phenomenon, many studies aimed to measure the flows of value added traded and capture their impact on trade and growth of firms and countries involved (see, for instance, Keller, 2002 and Baldone et al, 2007). Much less studied is the effect of GVCs on labour and the job structure of an economy, namely in what concerns the amount of labour.
This paper addresses the relation between international trade and employment with regard to the job – overall and by skills (high-skill, medium-skill and low-skill) - content of trade of intermediates (inputs), namely raw materials, industrial parts and components and services. It focuses on the case of Portugal in the period 1995-2009, following the methodology of Stehrer & Stöllinger (2012) to calculate the job content of international trade, which the authors define as “trade in jobs”. The job content of international trade compares the amount of labour (number of jobs) that a country uses to produce its exports with the hypothetical amount of jobs that would be required to produce its imports domestically, i.e. with domestic labour input requirements. Jobs linked to imports can be considered as “forgone” (potentially, i.e. assuming that the country can produce the imported inputs).
3
national IO matrices provide data on the interactions between domestic and foreign suppliers (rows) and domestic and foreign users (columns) of domestically produced and imported intermediates and final goods, respectively designated in IO literature by the downstream and upstream approaches1.IO matrices are the only reliable source of data to deal with inputs’ trade, considering that even when we are working with highly disaggregated levels of information in international trade databases, in order to take into consideration the characteristics of the traded good, some goods can be used both as an intermediate and as a final good, a distinction that only the IO matrices allow to make. The WIOD database is complemented with the Socio-Economic Accounts (SEA) for skill-types of labour. The period analysed was the longest possible given the temporal crossing of the two databases used, as explained in the empirical part of this research.
The amount of labour required to produce imported intermediates (exported intermediates) is taken as a proxy to the job effect of downward (upward) embeddedness of the country into GVCs and a positive net labour content in trading of intermediates signalsa positive effect for the country of participation in international value chains.
The paper is organized as follows: section 2 presents a revision of literature on the effects of GVCs on the labour market; section 3 presents the calculations for Portugal; section 4 concludes.
2. Previous studies on the impact of Global Value Chains on the labour
market
Only a few authors focused the impact of international fragmentation of production on the labour market, in spite of its importance.
The first studies on this topic focussed the impact on the remuneration of the labour force. It was the case of Feenstra & Hanson (1996, 1999) and Feenstra (1998), who concluded that international fragmentation of production was responsible for a significant share of the increase in demand for high-skilled labour force in the manufacturing industries of the United States (US) in the 1980s. Later on, Feenstra &
4
Hanson (2003) built a simple model of outsourcing to estimate the effects of trade in intermediates on wages in the US between 1979 and 1995 and concluded that the wages of employed workers with less than twelve years of schooling were those that decreased the highest with the relocation of economic activities intensive in low-skilled labour force outside of the country (by 20.2%), while the wages of workers with sixteen years of schooling or more increased by 3.4%. Several other studies presented similar conclusions for other regions: Strauss-Kahn (2003) for France; Geishecker (2006), and Geishecker & Görg (2008) for Germany (the latter also for the United Kingdom, UK, and Denmark); Hijzen (2007) for the UK; Hanson (2007) for Mexico, and Molnar et al (2007) for the Organization for Economic Cooperation and Development (OECD).
In sum, the above mentioned group of authors concluded that remuneration of the labour factor was affected by the relocation of production. However, this impact was not evenly distributed, being clearly differentiated between low-skilled and high-skilled jobs. Usually, the firm relocating usually chooses developing countries, which are intensive in low-skilled, in search for lower salaries. This puts pressure downwards on the remuneration of the low-skilled workers in the relocating (developed) country, while relative demand and salaries for higher-skilled jobs increases and the relative remuneration of low-skilled workers increases in the country (less developed) receiving the economic activity.
Other studies assessed not the change in remuneration of the workforce, but the size of the change in employment. The first authors to make use of this approach were Amiti & Wei (2005) for the services industry in the US and the UK, and Lui & Trefler (2008), for the services industry in the US and its outsourcing to India and the People Republic of China (PRC). In both cases, they found no or small significance of job losses in these countries due to international fragmentation of production. The first authors to find some significance in this regard were McKendrick et al (2000), who empirically concluded that in the case of jobs in the US hard-drive disk industry 80% had migrated to Southeast Asia from the 1970s onwards and by mid-1990s.
5
in the German transport equipment sector. In this regard, they showed that, between 1995 and 2008, the large majority of the 1.5 million-increase observed in the number of jobs in industries relevant to respond to the higher demand for German cars occurred outside Germany. In Germany, high-skilled and medium-skilled jobs increased only slightly, while low-skilled jobs decreased marginally.
Stehrer & Stöllinger (2012) tackled the question of how trade affected the demand for labour and the jobs structure of the European economy between 1995 and 2008, by measuring the job embodiment of trade by individual occupations of labour with the facilities provided by the WIOD database. The authors found different realities according to the skill-level of the workforce but, in general, at least in the more developed countries, jobs were lost for low-skilled workers, mainly related to the assembling and manufacturing stages of production, while jobs were gained for high-skilled workers, mainly related to research, development, design and marketing tasks.
3 The labour content of international trade in intermediates in the case of Portugal
This section aims to measure the job content of international trade of intermediates in Portugal in the period 1995-2009 adopting the methodology of Steher & Stollinger (2012).
6
databases were only available for 1995, 2000, 2005 and 2009. Prices are constant and allow for Purchasing Power Parity-conversion2.
In addition to the data published by the WIOD, we use the SEA, a database built for each one of the 35 sectors, 40 countries and 17 years covered by the WIOD that includes country-specific environmental and socio-economic indicators, such as industry-level data of capital stock, investment, wages and employment (by skill-type) for the period 1995-20093. The WIOD allows estimating how many dollars Portugal imported/exported in inputs, per sector and from/for any given country, while the SEA allows estimating, after some basic arithmetic transformations, the number of persons engaged in the economy, per sector and per skill.
While calculating the jobs embodied in exports of intermediates of country i is straightforward, the amount of labour required to produce imports is, as already mentioned, an hypothetical value that is calculated as follows: first, we estimate the import flows of inputs by country i, which are measured in USD; second, we convert the measurement unit of these flows from USD to amount of labour, namely to number of persons engaged4, assuming that those imported inputs are produced domestically, i.e. with country i’s technology.
The resulting number of jobs of the counterfactual exercise above explained is a
proxy for the job effect of a country’s downward embeddedness into GVCs with
reservations that cannot be neglected. First, because we are not using the labour content of imported inputs but the labour content that would be hypothetically used if those inputs were produced domestically. Second, because it omits potential efficiency gains obtained
by using those “foregone” resources domestically in more relatively efficient sectors, as already observed by Stehrer & Stöllinger (2012). Third, because the relation between
2 For more detailed information about how the WIOD was built, see Timmer et al (2012).
3 Also published by in http://www.wiod.org/new_site/database/seas.htm. The SEA include the following indicators: (i)
gross output by industry at current basic prices; (ii) intermediate inputs at current purchasers’ prices; (iii) gross value added at current basic prices; (iv) compensation of employees; (v) labour compensation; (vi) capital compensation; (vii) nominal Gross Fixed Capital Formation (GFCF); (viii) number of persons engaged; (ix) number of employees; (x) total hours worked by persons engaged; (xi) total hours worked by employees; (xii) price levels of gross output; (xiii) price levels of intermediate inputs; (xiv) price levels of gross value added; (xv) price levels of GFCF; (xvi) gross output; (xvii) intermediate inputs; (xviii) gross value added; (xix) real fixed capital stock; (xx) high-skilled labour compensation; (xxi) medium-skilled labour compensation; (xxii) low-skilled labour compensation; (xxiii) hours worked by high-skilled persons engaged; (xxiv) hours worked by medium-skilled persons engaged; and (xxv) hours worked by low-skilled persons engaged.
4 “Persons engaged” means “salaried employees plus self-employed and family members”, according to the SEA
7
GVCs and employment is not clear cut, as with GVCs international trade becomes, to use Stehrer & Stöllinger (2012)’s expression, more granular; in fact, internationally traded inputs may incorporate, in turn, imported inputs (the so-called second-round effects of
inputs, that can be even of higher order).
In what follows, we will start with the suppliers or downstream approach of the IO internationally linked matrix (subsection 3.1); next, we continue with the users or upstream approach (subsection 3.2); and, finally, we present the net job content of Portuguese international inputs’ trade disaggregated by trade partners (section 3.3.).
Despite the focus of our analysis being the trading of inputs, we will consider the whole amount of jobs associated to domestic production in order to provide a more comprehensive view of the Portuguese economy.
In the tables presented in this section, the job content associated to input-imports flows will be designated by “foregone jobs” (potentially, as mentioned above) and the job content of inputs exported will be designated by “gained jobs”. Note that in both cases we are evaluating the jobs embodied in inputs’ trade and not the impact of trade on the level of employment of a country. At this broader level, it may happen, for instance, that the level of employment in the country remains unchanged despite inputs’ trading5.
We will present calculations for the last year of the period analysed (2009) and the difference between this year and first one considered (1995). Results for the remaining years of the period are available upon request.
3.1.The supplier’s approach (or the downstream approach)
Bearing in mind that “foregone jobs” are those mentioned in the Tables of this sub-section as “jobs abroad”, Table I below presents the estimated domestic and “foregone jobs” in Portugal in 2009, calculated according to the downstream approach of an IO table. It shows that 4.8 million jobs (persons engaged) in Portugal were based on the demand for products and services in the Portuguese economy in 2009: 3.3 million in
5 If imported inputs were produced domestically and labour displaced shifted to other productions with limited
8
services (69% of total) and 1.5 million in manufacturing (31%). Of those 4.8 million jobs: (i) 3.1 million were based on the demand for products and services originated in the same sector (64%); (ii) 1.4 million were based on the demand for products and services originated in other sectors of the Portuguese economy (30%); and (iii) 304 thousand were based on the demand for foreign inputs, i.e. “foregone jobs” (6%).
TABLE I-ESTIMATED DOMESTIC AND “FOREGONE JOBS” IN THE PORTUGUESE ECONOMY:
SUPPLIERS’ APPROACH, PERSONS ENGAGED (IN THOUSANDS,2009)
All sectors Manufacturing sectors Services
Jobs in the sector producing that good or providing that service (1)
3,097 673 2,424
Jobs in other sectors than the one producing that good or providing that service (2)
1,425 640 785
Jobs in Portugal (1+2) 4,521 1,313 3,209
Jobs abroad (3) 304 167 137
Total jobs (1+2+3) 4,825 1,480 3,346
Source: Author's estimations based on WIOD and SEA, retrieved in January 2014. Due to rounding, numbers presented may not add up precisely to the totals provided.
9
TABLE II-ESTIMATED DOMESTIC AND “FOREGONE JOBS” BY THE PORTUGUESE ECONOMY:
SUPPLIERS’ APPROACH, PERSONS ENGAGED DISAGGREGATED PER SKILLS (IN THOUSANDS, 2009)
All sectors Manufacturing Services
High‐skilled jobs in the sector producing that good or providing that service (1)
503 25 478
High‐skilled jobs in other sectors than the one producing that good or providing that service (2)
169 49 120
High‐skilled jobs in Portugal (1+2) 672 74 597
High‐skilled jobs abroad (3) 51 22 29
High‐skilled jobs (1+2+3) 722 96 626
Medium‐skilled jobs in the sector producing that good or providing that service (4)
614 58 555
Medium‐skilled jobs in other sectors than the one producing that good or providing that service (5)
289 103 187
Medium‐skilled jobs in Portugal (4+5) 903 161 742
Medium‐skilled jobs abroad (6) 116 57 59
Medium‐skilled jobs (4+5+6) 1,018 218 801
Low‐skilled jobs in the sector producing that good or providing that service (7)
1,980 589 1,391
Low‐skilled jobs in other sectors than the one producing that good or providing that service (8)
976 488 479
Low‐skilled jobs in Portugal (7+8) 2,947 1,077 1,870
Low‐skilled jobs abroad (9) 138 88 49
Low‐skilled jobs (7+8+9) 3,085 1,166 1,919
Total jobs (1+2+3+4+5+6+7+8+9) 4,825 1,480 3,346
Source: Authors’ estimations based on WIOD and SEA, retrieved in January 2014. Due to rounding, numbers presented may not add up precisely to the totals provided.
A first conclusion about the downward embeddedness of Portugal into GVCs in 2009 is that being the country predominantly an unskilled labour user (with a number of this type of jobs almost 6 times higher than those in the medium-skilled category), the
10
labour skilled, mainly of the medium-skilled category, which represents a number of jobs
only slightly smaller than those in the low-skilled category.
Table III and Table IV below estimate the difference in domestic and “foregone jobs” observed between 2009 and 1995, respectively for total of persons engaged and disaggregating by labour skills. Note, that a decrease in the number of jobs, either used in domestic production or in imported inputs, does not necessarily mean a decrease in domestic production/imported inputs as it may be due to technology improvement between the two observed years.
Three main conclusions may be withdrawn from Table III. First, jobs based on the domestic production of the Portuguese economy increased by half a million when comparing those two years. Second, while the number of jobs in the service sectors increased by 804 thousand, the number of jobs in manufacturing decreased by 267 thousand. We can state therefore that jobs in the Portuguese economy were becoming increasingly concentrated in services. Third, the number of jobs in the same sector producing that good or service increased by 381 thousand, while the number of jobs in other sectors increased by 148 thousand and the number of “foregone jobs” increased by 7 thousand (namely in services, where those jobs increased by 16 thousand, since in manufacturing occurred a decrease of 9 thousand jobs). These 7 thousand additional jobs suggest an increasing downward participation of Portugal into GVCs, but in services.
TABLE III-ESTIMATED CHANGE IN DOMESTIC AND IN “FOREGONE JOBS” BY THE
PORTUGUESE ECONOMY FROM 1995 TO 2009: SUPPLIERS’ APPROACH, PERSONS ENGAGED
(IN THOUSANDS)
All sectors Manufacturing sectors Services
Jobs in the sector producing that good or providing that service (1)
381 ‐ 228 610
Jobs in other sectors than the one producing that good or providing that service (2)
148 ‐ 30 178
Total jobs in Portugal (1+2) 529 ‐ 259 788
Jobs abroad (3) 7 ‐ 9 16
Total jobs (1+2+3) 537 ‐ 267 804
11
In terms of job-skills (Table IV), we observe (downstream) that, over the period analysed, the number of jobs based on domestic production increased by 332 thousand in high-skilled category and 342 thousand in the medium-skilled one, while the number of low-skilled jobs decreased in 137 thousand. This evolution is more significant if we consider only manufacturing sectors, where the number of jobs based on domestic production increased by 40 thousand in high-skilled category and 26 thousand in the medium-skilled one, with low-skilled jobs decreasing in more than 333 thousand. Therefore, Portugal registers a favourable evolution in terms of skilled labour in the period analysed. Concerning the downward insertion of Portugal into GVCs, the number of “foregone jobs” increased in 21 thousand in high-skilled labour (of which 8 thousand in manufacturing and 13 thousand in services), 4 thousand in medium-skilled labour (corresponding to a decrease of 5 thousand in manufacturing and an increase of 9 thousand in services) and, finally, decreased 18 thousand in the low-skilled category (of which 12 thousand in manufacturing and the remaining in services).
TABLE IV-ESTIMATED CHANGE IN DOMESTIC AND IN “FOREGONE JOBS” BY THE
PORTUGUESE ECONOMY FROM 1995 TO 2009: SUPPLIERS’ APPROACH, PERSONS ENGAGED DISAGGREGATED PER SKILLS (IN THOUSANDS)
All sectors Manufacturing sectors Services
High‐skilled jobs in the sector producing that good or providing that service (1)
227 12 215
High‐skilled jobs in other sectors than the one producing that good or providing that service (2)
84 20 63
High‐skilled jobs in Portugal (1+2) 311 32 278
High‐skilled jobs abroad (3) 21 8 13
High‐skilled jobs (1+2+3) 332 40 292
Medium‐skilled jobs in the sector producing that good or providing that service (4)
227 1 226
Medium‐skilled jobs in other sectors than the one producing that good or providing that service (5)
111 30 80
Medium‐skilled jobs in Portugal (4+5) 337 31 306
Medium‐skilled jobs abroad (6) 4 ‐ 5 9
Medium‐skilled jobs (4+5+6) 342 26 316
Low‐skilled jobs in the sector producing that good or providing that service (7)
12
Low‐skilled jobs in other sectors than the one producing that good or providing that service (8)
‐ 46 ‐ 81 35
Low‐skilled jobs in Portugal (7+8) ‐ 118 ‐ 322 204
Low‐skilled jobs abroad (9) ‐ 18 ‐ 12 ‐ 7
Low‐skilled jobs (7+8+9) ‐ 137 ‐ 333 197
Total jobs (1+2+3+4+5+6+7+8+9) 537 ‐ 267 804
Source: Authors’ estimations based on WIOD and SEA, retrieved in January 2014. Due to rounding, numbers presented may not add up precisely to the totals provided.
The pattern of specialization of the Portuguese economy in terms of GVCs that emerge in this (partial) assessment is that inputs imported became increasingly intensive in more skilled labour (specially of a high level), this being the category that increased the most during the period analysed. This evolution is particularly noticeable in the import of services.
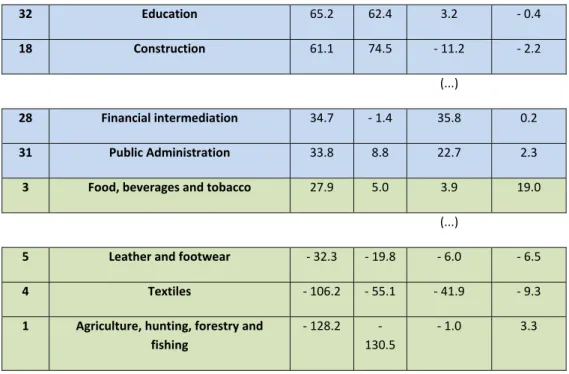
Finally, we sought to know which sectors were responsible for the trend presented above. The answer is shown in Table V6 below in what concerns total persons engaged7.
TABLE V-ESTIMATED CHANGE IN DOMESTIC AND IN “FOREGONE JOBS” BY THE
PORTUGUESE ECONOMY FROM 1995 TO 2009, PER SECTOR: SUPPLIERS’ APPROACH, PERSONS ENGAGED (IN 103, RANKED FROM HIGHEST TO LOWEST IN TERMS OF TOTAL JOBS)
Code Sector Total Direct
jobs
Indirect jobs
Jobs abroad
30 Renting of machines and equipment and other business activities
173.4 145.5 27.2 0.7
33 Health and social work 123.2 105.9 13.9 3.4
21 Retail trade, except of motor vehicles, and repair of househ. goods
91.5 83.8 8.0 ‐ 0.3
22 Hotels and restaurants 68.3 62.9 5.2 0.3
6 We note those sectors that employed more people (downstream) in 2009, namely: (i) “Construction” (401 thousand);
(ii) “Renting of machines and equipment and other business activities” (348 thousand); (iii) “Agriculture, hunting, forestry and fishing” (342 thousand); (iv) “Retail trade” (309 thousand); (v) “Health and social work” (290 thousand); and (vi) “Public Administration” (289 thousand). From 1995 to 2009, it was observed an increase in people employed in services relatively to those employed in manufacturing services. In addition, we identified those sectors that were more intensive in using (i) high-skilled jobs (both direct and indirect jobs), namely “Education”, “Financial Intermediation”, “Health”, and “Renting of machines and equipment”, with 54%, 34%, 28% and 28% of the total labour force, respectively; and (ii) low-skilled jobs, namely “Agriculture, hunting, forestry and fishing”, “Food, beverage and tobacco”, and “Wood, products of wood and cork”, with 93%, 86% and 84% of the total labour force, respectively, in 2009.
13
32 Education 65.2 62.4 3.2 ‐ 0.4
18 Construction 61.1 74.5 ‐ 11.2 ‐ 2.2
(...)
28 Financial intermediation 34.7 ‐ 1.4 35.8 0.2
31 Public Administration 33.8 8.8 22.7 2.3
3 Food, beverages and tobacco 27.9 5.0 3.9 19.0
(...)
5 Leather and footwear ‐ 32.3 ‐ 19.8 ‐ 6.0 ‐ 6.5
4 Textiles ‐ 106.2 ‐ 55.1 ‐ 41.9 ‐ 9.3
1 Agriculture, hunting, forestry and fishing
‐ 128.2 ‐ 130.5
‐ 1.0 3.3
Source: Authors’ estimations based on WIOD and SEA, retrieved in January 2014. Nec stands for not elsewhere classified. Highlighted in green and blue are manufacturing and services sectors, respectively.
Table V shows the sectors that contributed most, in the period between 1995-2009, to the increase in direct and indirect domestic jobs (sectors 30, 33, 21, 22, 32, 18), all classified as services, and to the decrease of this type of jobs (sectors 5, 4 and 1), all classified as manufacturing. In terms of “foregone jobs”, “Food, beverages and tobacco” was the sector with the highest estimated jobs’ increase (almost 19 thousand), followed at distance by “Agriculture, hunting, forestry and fishing” (around 3 thousand) in manufacturing, while “Textiles” and “Leather and footwear” presented the highest reduction.
3.2.The user’s approach (or the upstream approach)
14
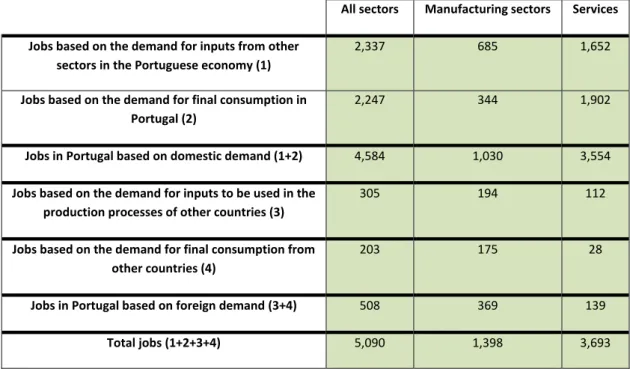
Table VI below shows, for 2009, nearly 5.1 million jobs (persons engaged)8 in the Portuguese economy. From these, we estimated that: (i) 2.3 million were based on the demand for inputs from other sectors in the Portuguese economy (45%); (ii) 2.2 million were based on the demand for final consumption in Portugal (43%); (iii) 305 thousand were based on the demand for Portuguese inputs used in the production processes of other countries (“gained jobs”) (6%); and (iv) 203 thousand were based on the foreign demand for Portuguese products used in final consumption.
TABLE VI-ESTIMATED DOMESTIC JOBS IN THE PORTUGUESE ECONOMY, INCLUDING
“GAINED JOBS”: USER’S APPROACH, PERSONS ENGAGED (IN THOUSANDS,2009)
All sectors Manufacturing sectors Services
Jobs based on the demand for inputs from other sectors in the Portuguese economy (1)
2,337 685 1,652
Jobs based on the demand for final consumption in Portugal (2)
2,247 344 1,902
Jobs in Portugal based on domestic demand (1+2) 4,584 1,030 3,554
Jobs based on the demand for inputs to be used in the production processes of other countries (3)
305 194 112
Jobs based on the demand for final consumption from other countries (4)
203 175 28
Jobs in Portugal based on foreign demand (3+4) 508 369 139
Total jobs (1+2+3+4) 5,090 1,398 3,693
Source: Authors’ estimations based on WIOD and SEA, retrieved in January 2014. Due to rounding, numbers presented may not add up precisely to the totals provided.
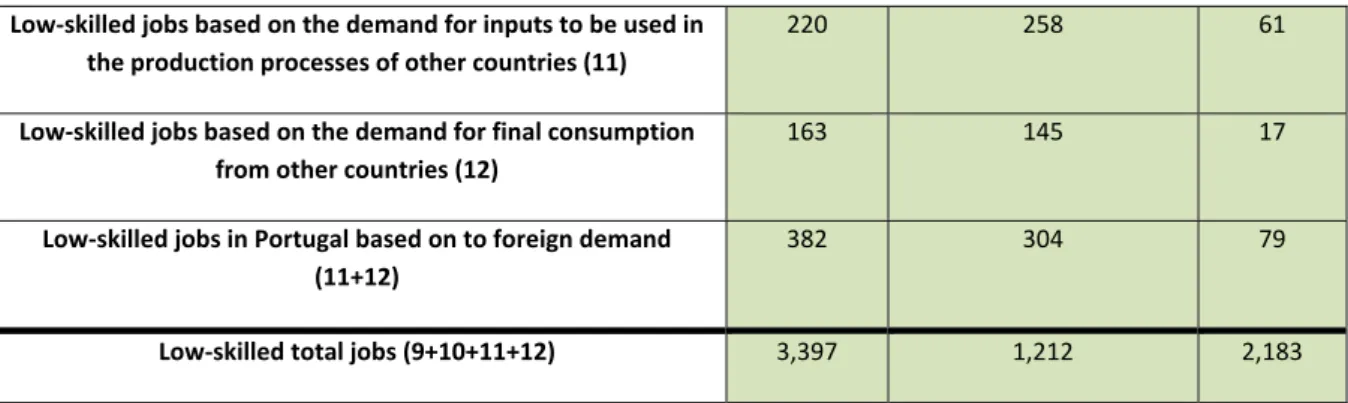
In Table VII below, which disaggregates Table VI per level of skills, beyond the expected breakdown of the total number of jobs by skills (which must coincide with that of the downward approach, with the correction explained in the Annex 3), we note that jobs used in production of exported inputs (“gained jobs”) were mostly of a low-skilled type ( 29 thousand high-low-skilled, 57 thousand medium-low-skilled and 220 thousand low-skilled), This bias towards low-skilled work is much more pronounced in manufacturing. Therefore, the pattern of labour used by Portugal in exported inputs is
clearly in line with that of the economy as a whole, as expected.
8 The difference between this 5.1 million (estimated according to the upstream approach) and the 4.8 million estimated
15
TABLE VII-ESTIMATED DOMESTIC JOBS IN THE PORTUGUESE ECONOMY INCLUDING
“GAINED JOBS”: USER’S APPROACH, PERSONS ENGAGED, DISAGGREGATED PER SKILLS (IN THOUSANDS,2009)
All sectors Manufacturing sectors Services
High‐skilled jobs based on the demand for inputs from other sectors in the Portuguese economy (1)
257 24 233
High‐skilled jobs based on the demand for final consumption in Portugal (2)
424 12 412
High‐skilled jobs in Portugal based on domestic demand (1+2) 681 36 644
High‐skilled jobs based on the demand for inputs to be used in the production processes of other countries (3)
29 11 18
High‐skilled jobs based on the demand for final consumption from other countries (4)
12 9 3
High‐skilled jobs in Portugal based on foreign demand (3+4) 41 19 22
High‐skilled total jobs (1+2+3+4) 721 56 666
Medium‐skilled jobs based on the demand for inputs from other sectors in the Portuguese economy (5)
434 56 378
Medium‐skilled jobs based on the demand for final consumption in Portugal (6)
456 29 427
Medium‐skilled jobs in Portugal based on domestic demand (5+6)
890 85 805
Medium‐skilled jobs based on the demand for inputs to be used in the production processes of other countries (7)
57 25 32
Medium‐skilled jobs based on the demand for final consumption from other countries (8)
28 21 7
Medium‐skilled jobs in Portugal based on foreign demand (7+8)
85 46 39
Medium‐skilled total jobs (5+6+7+8) 975 131 844
Low‐skilled jobs based on the demand for inputs from other sectors in the Portuguese economy (9)
1,647 606 1,041
Low‐skilled jobs based on the demand for final consumption in Portugal (10)
1,366 303 1,064
16
Low‐skilled jobs based on the demand for inputs to be used in the production processes of other countries (11)
220 258 61
Low‐skilled jobs based on the demand for final consumption from other countries (12)
163 145 17
Low‐skilled jobs in Portugal based on to foreign demand (11+12)
382 304 79
Low‐skilled total jobs (9+10+11+12) 3,397 1,212 2,183
Source: Authors’ estimations based on WIOD and SEA, retrieved in January 2014. Due to rounding, numbers presented may not add up precisely to the totals provided.
Table VIII below shows the change in domestic jobs in Portugal between 1995 and 2009. We observe that the amount of jobs decreased by 105 thousand due to lower domestic demand for Portuguese inputs (around three quarters of them in manufacturing sectors and one quarter in services), while the amount of jobs increased by 127 thousand due to higher foreign demand, of which 86 thousand correspond to “gained jobs” (67 % in manufacturing and 33% in services). Those estimates point to an increasing upstream participation of Portugal in export activity in general and GVCs in particular, with a clear positive impact on employment.
TABLE VIII–CHANGE IN DOMESTIC JOBS IN THE PORTUGUESE ECONOMY INCLUDING
“GAINED JOBS” BETWEEN 1995 AND 2009: USER’S APPROACH, PERSONS ENGAGED (IN THOUSANDS,2009)
All sectors Manuf. sectors Services
Jobs based on the demand for inputs from other sectors in Portugal (1) ‐ 118 ‐ 70 ‐ 48
Jobs based on the demand for final consumption in Portugal (2) 13 ‐ 4 17
Jobs in Portugal based on domestic demand (1+2) ‐ 105 ‐ 73 ‐ 31
Jobs based on the demand for inputs to be used in the production processes of other countries (3)
86 58 28
Jobs based on the demand for final consumption from other countries (4) 41 30 11
Jobs in Portugal based on foreign demand (3+4) 127 88 39
Total jobs (1+2+3+4) 22 15 8
Source: Authors’ estimations based on WIOD and SEA, retrieved in January 2014. Due to rounding, numbers presented may not add up precisely to the totals provided.
17
Table IX below shows the change observed in domestic jobs in Portugal between 2009 and 1995 but now disaggregated according to their level of skills. While domestic demand was associated to a decrease in: (i) nearly 6 thousand high-skilled jobs, (ii) 15 thousand medium–skilled jobs; and (iii) 83 thousand low-skilled jobs in Portugal, foreign demand was associated to an increase in: (i) 8 thousand high-skilled jobs; (ii) 18 thousand medium-skilled jobs; and (iii) 102 thousand low-skilled jobs, of which 6 thousand, 14 thousand and 66 thousand, respectively, corresponded to “gained jobs”. Therefore, we conclude that Portuguese trading in exported inputs resulted in a global increase in jobs for all three levels of skills, although with a clear predominance of low-skilled labour, as expected form the characteristics of this economy.
TABLE IX–CHANGE IN DOMESTIC JOBS IN THE PORTUGUESE ECONOMY INCLUDING
“GAINED JOBS” BETWEEN 1995 AND 2009: USER’S APPROACH, PERSONS ENGAGED DISAGGREGATED PER SKILLS (IN THOUSANDS,2009)
All sectors Manufacturing sectors Services
High‐skilled jobs based on the demand for inputs from other sectors in the Portuguese economy (1)
‐ 15 ‐ 3 ‐ 12
High‐skilled jobs based on the demand for final consumption in Portugal (2)
9 1 9
High‐skilled jobs in Portugal based on domestic demand (1+2) ‐ 6 ‐ 3 ‐ 3
High‐skilled jobs based on the demand for inputs to be used in the production processes of other countries (3)
6 3 3
High‐skilled jobs based on the demand for final consumption from other countries (4)
1 1 1
High‐skilled jobs in Portugal based on foreign demand (3+4) 8 4 4
High‐skilled total jobs (1+2+3+4) 1 1 1
Medium‐skilled jobs based on the demand for inputs from other sectors in the Portuguese economy (5)
‐ 23 ‐ 8 ‐ 14
Medium‐skilled jobs based on the demand for final consumption in Portugal (6)
8 1 7
Medium‐skilled in Portugal based on domestic demand (5+6) ‐ 15 ‐ 7 ‐ 8
Medium‐skilled jobs based on the demand for inputs to be used in the production processes of other countries (7)
14 7 7
Medium‐skilled jobs based on the demand for final consumption from other countries (8)
4 2 2
Medium‐skilled jobs in Portugal based on foreign demand (7+8) 18 8 9
18
Low‐skilled jobs based on the demand for inputs from other sectors in the Portuguese economy (9)
‐ 80 ‐ 58 ‐ 22
Low‐skilled jobs based on the demand for final consumption in Portugal (10)
‐ 4 ‐ 5 1
Low‐skilled jobs in Portugal based on domestic demand (9+10) ‐ 83 ‐ 63 ‐ 20
Low‐skilled jobs based on the demand for inputs to be used in the production processes of other countries (11)
66 48 18
Low‐skilled jobs based on the demand for final consumption from other countries (12)
35 28 8
Low‐skilled jobs in Portugal based on foreign demand (11+12) 102 76 26
Low‐skilled total jobs (9+10+11+12) 18 13 6
Source: Authors’ estimations based on WIOD and SEA, retrieved in January 2014. Due to rounding, numbers presented may not add up precisely to the totals provided.
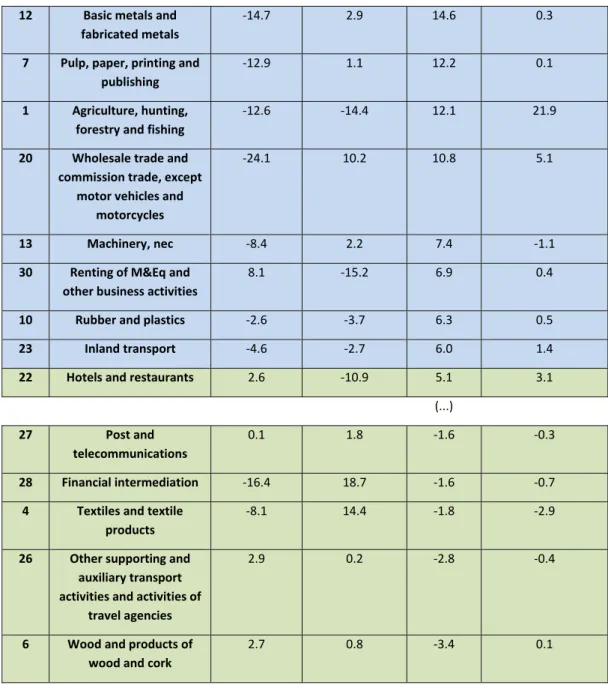
Finally, Table X below shows which sectors were more responsible for the increase in jobs in all three levels of skills between 1995 and 2009 in Portugal in terms of the upstream approach. Focussing our attention in those sectors where the increase in domestic jobs due to the higher demand for Portuguese inputs in other countries was higher, meaning more upstream GVC-embedded sectors in terms of jobs, we conclude that they are characterized by low skilled intensity, namely: (i) “Basic metals and fabricated metals” (with an increase of 14.6 thousand jobs in the period considered, 80% in low-skilled jobs); (ii) “Pulp and paper” (12.2 thousand jobs, 80% also in low-skilled jobs); (iii) “Agriculture, hunting, forestry and fishing” (12.1 thousand jobs, 97% in low-skilled jobs); and (iv) “Wholesale trade” (10.8 thousand jobs, 68% in low-low-skilled jobs). Those sectors where the decrease in domestic jobs due to lower demand for Portuguese inputs in other countries was more significant, meaning less GVC-embedded in terms of jobs, were: (i) “Wood and cork” (with an decrease of 3.4 thousand jobs in the period considered, 79% in low-skilled jobs); (ii) “Other transport activities” (2,8 thousand jobs, 57% in low-skilled jobs); and (iii) “Textile and textile products” (1.8 thousand jobs, 79% in low-skilled jobs).
TABLE X-CHANGE IN DOMESTIC IN THE PORTUGUESE ECONOMY INCLUDING “GAINED JOBS” BETWEEN 1995 AND 2009 PER SECTOR: USER'S APPROACH, PERSONS ENGAGED (IN
THOUSANDS)
Code Sector Inputs to the
Portuguese economy
Final consumption in
Portugal
Inputs to other countries
19
12 Basic metals and fabricated metals
‐14.7 2.9 14.6 0.3
7 Pulp, paper, printing and publishing
‐12.9 1.1 12.2 0.1
1 Agriculture, hunting, forestry and fishing
‐12.6 ‐14.4 12.1 21.9
20 Wholesale trade and commission trade, except
motor vehicles and motorcycles
‐24.1 10.2 10.8 5.1
13 Machinery, nec ‐8.4 2.2 7.4 ‐1.1
30 Renting of M&Eq and other business activities
8.1 ‐15.2 6.9 0.4
10 Rubber and plastics ‐2.6 ‐3.7 6.3 0.5
23 Inland transport ‐4.6 ‐2.7 6.0 1.4
22 Hotels and restaurants 2.6 ‐10.9 5.1 3.1
(...)
27 Post and
telecommunications
0.1 1.8 ‐1.6 ‐0.3
28 Financial intermediation ‐16.4 18.7 ‐1.6 ‐0.7
4 Textiles and textile products
‐8.1 14.4 ‐1.8 ‐2.9
26 Other supporting and auxiliary transport activities and activities of
travel agencies
2.9 0.2 ‐2.8 ‐0.4
6 Wood and products of wood and cork
2.7 0.8 ‐3.4 0.1
Source: Authors’ estimations based on WIOD and SEA, retrieved in January 2014. Nec stands for not elsewhere classified. Highlighted in green and blue are manufacturing and services sectors, respectively.
Table X registers another interesting pattern: in all sectors but “Renting of machines and equipment and other business activities” and “Textiles and textile products”, the amount of jobs used to produce inputs declined when they were produced for the Portuguese economy and increased in the case of production for export, in line
20
3.3. The labour content of international trade in intermediates by trade partner
Based on the two approaches to estimate the content in jobs of trade in inputs presented in the two previous sub-sections, we now present a measure for Portugal of the net gains in terms of the “trade in jobs” in the year 2009 both for the whole economy and for each one the 40 countries reported in the WIOD database.
This measure consists in simply subtracting the number of “foregone jobs” to the number of “gained jobs”. Therefore, it is a measure of net jobs “gain” in intermediates’ trade9. A positive result means that to produce the exported inputs requires more employment than producing the imported inputs domestically (i.e. with the country´s labour productivity), therefore the balance of GVC embeddedness is favourable in terms of jobs.
Calculations were made for total trade of Portugal and also at the bilateral level, by country of the WIOD database, and they are presented in Table XI below.
TABLE XI–BILATERAL NET JOB CONTENT IN INPUTS’ TRADE OF PORTUGAL (2009)
(THOUSAND JOBS)
Country “Gained jobs” (A) “Foregone jobs” (B) (A‐B)
Spain 75.9 55.0 20.9
France 29.8 9.8 20.0
US 21.4 7.4 14.0
Germany 30.9 20.6 10.3
Belgium 8.9 4.1 4.8
Ireland 7.4 2.9 4.6
UK 16.2 12.0 4.2
Sweden 3.6 1.2 2.4
Austria 4.0 1.8 2.2
Netherlands 8.9 6.8 2.2
Czech Rep. 3.4 1.6 1.7
Italy 10.3 8.8 1.5
Canada 2.6 1.2 1.4
Finland 2.0 1.2 0.8
9 To allow comparisons between time periods and/or other countries the referred difference can be
21
Denmark 1.8 1.0 0.8
Australia 0.6 0.2 0.4
Greece 0.8 0.4 0.4
Luxembourg 0.7 0.3 0.3
Japan 0.9 0.6 0.3
Cyprus 0.1 0.0 0.1
Slovenia 0.2 0.2 0.1
Malta 0.1 0.1 ‐0.1
Estonia 0.1 0.1 ‐0.1
Latvia 0.1 0.2 ‐0.1
Taiwan 0.3 0.5 ‐0.2
Slovakia 0.5 0.7 ‐0.2
Poland 2.9 3.1 ‐0.2
Lithuania 0.1 0.5 ‐0.4
South Korea 0.3 0.8 ‐0.5
Hungary 0.8 2.0 ‐1.2
Turkey 1.8 3.5 ‐1.7
Mexico 1.1 3.6 ‐2.6
Russia 1.2 4.4 ‐3.2
Bulgaria 0.3 5.0 ‐4.7
Indonesia 0.0 8.0 ‐7.9
Romania 1.8 10.1 ‐8.3
India 0.3 25.0 ‐24.7
PRC 3.4 30.9 ‐27.5
Brazil 7.9 68.6 ‐60.7
Total 253.410 304.0 ‐50.6
Source: Authors’ estimations based on WIOD and SEA, retrieved in January 2014.
According to Table XI, Portuguese embeddedness in GVCs led to a net loss of almost 51 thousand jobs, being the highest gains in inputs’ trade with Spain and France, and the highest losses in inputs’ trade with Brazil, followed by PRC and India.
10 This value does not include 53.5 thousand jobs “gained” due to demand for foreign inputs from the RoW. The
22
4.Conclusions
This paper addressed the relation between international trade and labour in Portugal with regard to the job content of trade in intermediates by considering both the overall number of jobs and jobs disaggregated by levels of skills in the period 1995-2009 with two (complementary) approaches: downward and upward.
With regard to the downward approach, the results that we highlight are the following. First, we observed over the period analysed an increase in the number of jobs embodied in inputs’ imports in 7 thousand, pointing to an increasing downward participation of the Portuguese economy into GVCs, observed mainly in services. Second, in 2009, Portugal, while being predominantly an unskilled-labour user (with a number of this type of jobs almost 6 times higher than those in the medium-skilled category),
imported inputs that were relatively more intensive in skilled labour (with a similar
content of medium-skilled and low-skilled jobs). Third, imported inputs became
increasingly intensive in high-skilled labour, this being the category that increased the most during the period analysed, particularly noticeable in the import of services. Fourth, the sectors that increased more their downward insertion into GVCs, measured in terms of “foregone jobs”, were “Food, beverages and tobacco”, followed at distance by “Agriculture, hunting, forestry and fishing” in manufacturing.
In terms of the upstream approach, we highlight the following results. First, “gained jobs” present a strong bias towards low-skilled labour, especially in manufacturing. Therefore, the pattern of labour used by Portugal in exported inputs is
23
Finally, we highlight that the increased embeddeness of the country into GVCs led, in the end of the period analysed, to a loss of 51 thousand jobs. This is apparently worrying news for employment but it needs to be verified by calculating the net job content of intermediates in other years.
In any case, we note that results for job content are subject to reservation for two main
reasons. First, restrictive assumptions were made to perform this empirical exercise,
namely in the case of inputs’ imports, as already explained. They imply that Portugal has
the resource endowment and technology to produce those imports domestically and that
they can be produced with the Portuguese level of labour productivity (labour input
requirements). Second, this job content measurement does not capture productivity
effects, although they can explain a decrease in jobs through labour saving technological
progress.
Bibliography
Amiti, M. & Wei, S.J. (2005). “Fear of service outsourcing: is it justified?”. Economic Policy. 20 (2). pp. 308-347.
Baldone, S., Sdogati, F. & Tajoli, L. (2007). “On some effects of international fragmentation of production on comparative advantages, trade flows and the income of countries”. The World Economy. 30 (11). pp. 1726-1769.
Escaith, H. & Timmer, M. (2012). Global Value Chains, trade, jobs and environment: the new WIOD database [online]. Available in: www.voxeu.org/article/new-world-input-output-database.
Eurostat (2008). Eurostat Manual of Supply, Use and Input-Output Tables, Office for official publications of the European Communities. Luxembourg.
Feenstra, R.C. (1998). “Integration of trade and disintegration of production in the global economy”. Journal of Economic Perspectives. 12 (4). pp. 31-50.
Feenstra, R.C. & Hanson, G.H. (1996). “Globalization, outsourcing and wage inequality”.
The American Economic Review, 86 (2), pp. 240-245.
Feenstra, R.C. & Hanson, G.H. (1999). “The impact of outsourcing and high-technology capital on wages: Estimates for the United States, 1979-1990”. The Quarterly Journal of Economics, 114 (3), pp. 907-940.
Feenstra, R.C. & Hanson, G.H. (2003). “Global production sharing and rising inequality: a survey of trade and wages”. Chapter 6 in: Choi, E.K. & Harrigan, J. (Eds.) (2003).
Handbook of International Trade, Volume 1. Blackwell Publishing.
24
Geishecker, I. & Görg, H. (2008). “Winners and losers: a micro-level analysis of international outsourcing and wages”. Canadian Journal of Economics, 41, 243-270. Hanson, G.H. (2007). “Globalization, Labour Income and Poverty in Mexico”. In:
Harrison, A. (Ed.) (2005). Globalization and Poverty. NBER Press. Washington DC, pp. 417-456.
Hijzen, A. (2007). “International outsourcing, technological change and wage inequality”. Review of International Economics, 15 (1), pp. 188-205.
Keller, W. (2002). “Trade and the transmission of technology”. Journal of Economic Growth, 7. pp. 5-21.
Lenzen, M., Kanemoto, K., Moran, D. & Geschke, A. (2012). “Mapping the structure of the world economy”. Environmental, Science and Technology, 46 (15). pp. 8374-8381.
Liu, R. & Trefler, D. (2008). “Much ado about nothing: American jobs and the rise of service outsourcing to PRC and India”. National Bureau of Economic Research
Working Paper Series, 14,061. Cambridge, MA. US.
McKendrick, D.; Doner, R.F. & Haggard, S. (2000), From Silicon Valley to Singapore:
Location and competitive advantage in the hard disk drive industry, Stanford,
California, Stanford University Press.
Molnar, M., Pain, N. & Taglioni, D. (2007). “The internationalization of production, international outsourcing and employment in the OECD”. OECD Economics DepartmentWorking Paper Series, n. 561. Paris.
Stehrer, R. & Stöllinger, R. (2012). “Trade in jobs: a counterfactual exercise”. Paper presented at the final WIOD Conference: Causes and consequences of globalization.
April, 24-26. Groningen. Available in:
www.wiod.org/conferences/groningen/Paper_St%C3%B6llinger_Stehrer.pdf.
Strauss-Kahn, V. (2003). “The role of globalization in the within-industry shift away from unskilled workers in France”. National Bureau of Economic Research Working Paper Series, n. 9,716. Cambridge, MA. US.
Timmer, M., Erumban, A.A., Los, B., Stehrer, R. & De Vries, G. (2012). “Slicing Up Global Value Chains”. WIOD Working Paper Series, n. 12. Available in: www.wiod.org/publications/papers/wiod12.pdf.
UNCTAD (2013). “80% of trade takes place in ‘value chains’ linked to transnational corporations, UNCTAD report says”. United Nations Conference on Trade and
Development Press Releases. UNCTAD/PRESS/PR/2013/00. 27 February 2013.
Genève. Available in:
unctad.org/en/pages/PressRelease.aspx?OriginalVersionID=113.
Wixted, B., Yamano, N. & Webb, C. (2006). “Input-Output analysis in an increasingly globalized world: applications of OECD harmonized international tables”. OECD
Science Technology and Industry Working Paper Series, number 7-2006. OECD.
Paris.
World Economic Forum (2013), Enabling trade: valuing growth opportunities, World Economic Forum. Genève. Available in:
25
Yamano, N. & Ahmad, N. (2006). “The OECD Input-Output Database: 2006 Edition”.
OECD Science Technology and Industry Working Paper Series, 8-2006. OECD.
Paris.
Annex I – The structures of an IO table and of internationally-linked IO tables
An IO table, conceived as a supply and use table of national production, provides data on the interactions between suppliers (rows) and users (columns) of (i) domestically produced and consumed intermediates (raw materials, industrial parts and components and services), (ii) domestically produced and consumed final goods, in private final consumption, in Government final consumption or in GFCF; (iii) domestically produced and exported final goods; and (iv) externally produced imported intermediates.
In fact, this matrix is a supply and use table of national production, as referred in Eurostat (2008), and not a supply and use table of total flows in the economy, since information is not presented about imports of final goods, including those re-exported with no value-added in the domestic economy. A supply and use table of total flows would also present an additional row for imports of final goods. This missing information is not relevant, nonetheless, for the purpose of assessing the participation of national production in GVCs.
The basic structure of an IO table is presented below in Figure 1.
26 Source: Wixted et al (2006).
On one hand, rows give information about how a given sector of activity, let’s say agriculture (row 1), supplied (i) the production processes of other sectors (i.e. 3 units as inputs in the mining sector, 8,260 units as inputs in the manufactures sector, 36 units as inputs in the utilities sector, 59 units as inputs in the construction sector, and 615 units as inputs in the services sector); (ii) the production process in the same sector (i.e. 2,731 units); (iii) the final consumption in the country (962 units); (iv) the government final consumption in the country (62 units); (v) the GFCF in the country (567 units); and (vi) the exports (8,568).
On the other hand, columns give information about how the production of a given sector of activity, let´s say agriculture (column 1) disaggregated in terms of (i) inputs from other sectors of activity (i.e. 4 units from mining, 3,322 units from manufactures, 983 units from utilities, 121 units from construction and 2,884 units from services); (ii) inputs from the same sector (2,731 units from agriculture); (iii) imported inputs (1,779 units); (iv) taxes on products (129 units); and (v) value added in the sector, at basic prices, representing the sum of wages and salaries (remuneration of labour) plus gross operating surplus (remuneration of capital) (9,910 units).
27
be either at basic or at purchaser’s prices11. Highlighted in green, one can observe the total imported inputs. Highlighted in blue are the supplies of goods that are not consumed by domestic industries.
The international linkage between the IO tables of several countries can be observed in Figure 2 below12. This extended matrix just builds on the one observed in Figure 1 above by disaggregating: (i) the column called “Exports” in several submatrices that present, for each one of the other countries in the sample and the remaining Rest of the World (RoW) as a whole, information about how the goods and services supplied have been used in those countries as inputs, per sector; as private final consumption; as Government final consumption; and as GFCF. For example, Figure 1 above showed us that agriculture supplied foreign users with 8,568 units. Additionally, Figure 2 shows us how those 8,568 units disaggregate per country and per final use (e.g. that 343 units were used as inputs in the production of manufactures of country B, or that 1,285 units were used as private final consumption in country B).
FIGURE 2 -THE BASIC STRUCTURE OF AN INTERNATIONALLY LINKED IOTABLE (FOR THREE REGIONS; COUNTRY A, COUNTRY B AND REST OF THE WORLD)
Source: Authors, based on Timmer et al (2012a).
11 While the basic price is the amount receivable by the producer exclusive of taxes payable on products and inclusive
of subsidies receivable on products (the equivalent for imported products is the c.i.f. - cost, insurance and freight, that is, the value at the border of the importing country), the purchaser price is the amount payable by the purchaser (it includes trade margins realized by wholesalers and retailers - by definition, their output - as well as transport margins - that is, any transport charges paid separately by the purchaser - and non-deductible value-added tax (definitions by the Data Helpdesk of the World Bank, in https://datahelpdesk.worldbank.org/knowledgebase/articles/114947-what-is-the-difference-between-purchaser-prices-p).
12 For additional information about how these internationally linked IO matrices are built, see Yamano & Ahmad
28
Analogously, this extended matrix also builds on the matrix observed in Figure 2 above by disaggregating (ii) the row called “Imports” into several submatrices that present, for each one of the other countries in the sample and the remaining RoW as a whole, information about how the domestic production processes of goods and services are supplied with inputs by each one of the other countries, per sector. For instance, in Figure 1 above, the production of the agriculture sector was supplied by inputs produced abroad amounting 1,779 units. Figure 2 additionally allowed us to observe how that amount disaggregated per country and per sector (e.g. 71 units of inputs were originated in the manufacture sector of country B, or that 142 units of inputs were originated in the agriculture sector of countries not covered in the sample).
Annex II – List of the 35 sectors included in the WIOD
Annex III – The reconciliation of the downstream and the upstream approaches
29
explained in Figure 3 below. In this figure, we show the reconciliation of both approaches. In one hand, we see in the figure’s left side that, following the downstream approach, the output produced in Portugal creates a given demand for domestic and foreign inputs. The domestic and foreign inputs needed are produced with both domestic labour force (blue box #1) and with foreign labour force (blue box #3), respectively. In the other hand, we also see in the figure’s right side that, following the upstream approach, the output produced abroad creates a given demand for domestic and foreign inputs. The domestic and foreign inputs needed are produced with both domestic labour force (pink box #2) and with foreign labour force (pink box #4), respectively. Translating those boxes into jobs, the blue box #1 corresponds to the number of jobs existing in Portugal due to domestic demand (downstream approach): 4.521 million according to Table I. The red box #2 corresponds to the number of jobs existing in Portugal due to foreign demand (upstream approach): 0.508 million jobs, according to Table VI. Altogether, we concluded that, in 2009, there were 5.029 million employed persons in Portugal. Two other minor reasons explaining the difference between the 5.029 million and the 5.090 million are: (i) first, the downstream approach does not consider jobs existing due to tax/subsidies, and (ii) second, the upstream approach does not take into account variations in stocks. Finally, the blue box #3 corresponds to the number of jobs existing abroad due to the Portuguese demand for foreign inputs (downstream approach): 0.304 million, according to Table I.
FIGURE 3-SCHEMATIC OUTLINE OF THE METHODOLOGICAL DIFFERENCES IN THE JOBS ESTIMATED BY THE DOWNSTREAM AND THE UPSTREAM APPROACHES
Source: Authors.