A Work Project presented as part of the requirements for the Award of a Master
Degree in Finance from the NOVA – School of Business and Economics
Hedging Strategy for the Bond Liquidation Group
Elizaveta Vintovkina 30341
A Project carried out on the Master in Finance Program, under the supervision of
Gonçalo Sommer Ribeiro
A Project is a part of Direct Research Internship within Deutsche Börse Group –
Eurex Clearing at Risk Management department in the section of Default Management
Process, under the supervision of
Vincent Prepin
Abstract
This Paper studies possible hedging strategies for the Bond Liquidation Group within CCP. As one of the most important Default Management steps, hedging of the defaulted Clearing Member’s portfolio will take place in order to reduce market risk sensitivity. The paper is aimed to answer the question of what strategy should DMP team choose – what instrument to use, what number of contracts, within what time. The analysis is developed based on the studied real Clearing Member’s portfolio in order to reach realistic results. Finally, paper comes up with more ideas of hedging for more general cases based on the conclusions from studied portfolio.
Keywords: He
dging strategy, Central Counterparty, Bond Liquidation Group, Interest Rate Risk, Risk ManagementGlossary
Definition/Acronym
Description
BPM Bond Position Manager tool
CCP Central Counterparty
CDS Credit Default Swap
CM Clearing Member
DMP Default Management Process
DV01 Dollar Value of 1 basis point
ECB European Central Bank
EMIR European Market Infrastructure Regulation
FX Foreign Exchange
GC Pooling General Collateral Repo
GC ECB General Collateral ECB Standard Basket
GC ECB X General Collateral ECB Extended Basket
HQLA Hight Quality Liquid Assets
IM Initial Margin
LG Liquidation Group
LCR Liquidity Coverage Ratio
Purchase Price Amount of cash exchanged at the First Leg
Repo Repurchase Agreement
SR Special Repo
Side 1/Seller Cash Taker or Collateral provider
Side 2/Buyer Cash Provider or Collateral Receiver
Contents
1. Chapter 1
Introduction……… ………4
1.1. What is Repurchase Agreement?...6
1.1.1. Eurex Repo………...6
1.2. Literature Review………8
1.3. Default Management Process………...10
1.3.1. Case Study: Liquidation of the Maple’s positions………...12
2. Chapter 2 2.1. Data sample description……….12
2.2. Description of the analysed portfolio………13
2.2.1. Portfolio Term Structure………...13
2.2.2. Portfolio Risk Exposure………14
2.2.2.1. Haircut and DV01 as risk metrics……….15
2.2.2.2. HQLA risk analysis………...17
2.3. Instrument Analysis………...18
2.4. Hedging with Bond Futures………..20
2.5. Hedging with Euro Stoxx 50 Corporate Bond Index Futures………...20
3. Chapter 3 3.1. General Definition of the Hedging Strategy for a CCP ……….22
3.1.1. Measures of the portfolio risk………...22
3.1.2. Measures of the costs for CCP………..23
3.2. Comparative Analysis of the Strategies………..24
3.3. Conclusion and Recommendations ………27
3.4. Limitations to the Analysis and further steps……….30
References………..31
Appendix………32
Chapter 1
Introduction
The Global Financial Crisis has shown the whole financial system instability. Lehman Brothers was the biggest ever defaulted bank in the history. The crisis revealed many assumptions like “too big to fail” not to be true anymore in the real world, and any institution, even the biggest ones, can go bankrupt. Hence, if the strongest and the biggest banks were struggling, how could have financial markets survived? In order to preserve financial markets, regulatory bodies have implemented considerable changes. The European Market Infrastructure Regulation imposed rules tightening many assets classes’ trading. Highlighted the role and increased importance of tri-party contractual relationships that created a new “transparency paradigm”. Nowadays, most of the derivatives are to be cleared through Central Counterparties, which decreases credit risk and increase creditworthiness, financial markets stability and in general supports development. At the same time the questions of how to build appropriate risk management and how to be prepared for the Clearing Member default are to be approached by CCPs.
I have the chance to be the part of Risk Management – Default Management team in Eurex Clearing AG – the biggest Central Counterparty in the world and part of Deutshe Borse Group. As an intern I am involved in many tasks and projects regarding the key processes and tools to be used in case of one of the members’ default. One of the most interesting projects for me is the Bond Position Manager tool development, where the key idea is to present all bonds data in the applicable and readable format, to identify key risk exposures and propose preliminary macro hedging steps for a trader in case of a default. My role in the project is to develop all the hedging analysis first, before being coded, in order to understand the basic idea behind. When all results are approved, the techniques and idea will be implemented into the tool. Finally, the tool should be able to provide processed data regarding all bond related positions of a Clearing Member as well as to propose some hedging steps regarding the portfolio.
As a part of my internship as well as the part of my studies in this research project I will try to answer the question of how would a central counterparty hedge the bond portfolio against the interest rate risk
as a preliminary step of Default Management Process? Hence, the goal of the research is to develop sustainable and consistent hedging strategy for the bond portfolio from the CCP’s perspective. BPM is focused on the whole bond liquidation group, which includes all members’ bond or bond-related positions. Currently, bonds as a single asset are not traded at Eurex exchange, meaning that we have bond positions for studied portfolio in repurchase agreements only (where bond acts as a collateral).
The whole DMP takes time, which imposes additional market risks for CCP. In this regard, first of all, the CCP needs to do a macro hedge. Macro hedge is the hedge against market volatility for the specific portfolio of a defaulted CM. CCP enters derivatives positions off-setting the risk of a portfolio, which results in lower portfolio volatility.
In this regard, the research question is narrowed to the bonds related positions in the repurchase agreements, where the macro hedge will have the most important role. Hence, for studying purposes the real repo trades portfolio will be further taken as a sample for the research analysis.
There will be studied different techniques and methods in order to define best hedging strategy for a CCP. Following the analysis, all methods are to be tested using the real portfolio above mentioned. The research paper is separated into three main parts. First part provides brief explanation of the repurchase agreement as an instrument and explains the CCP’s business with the focus on the DMP. Different hedging strategies are developed in the Chapter 2 with detailed portfolio analysis, instruments and techniques description. Thirdly, Chapter 3 summarizes the results of the second part and concludes best ways of hedging for a CCP. It also outlines limitations of the research and provides recommendations for the further tool development based on the analysis.
All the data and information sources used can be split into two main groups. First, the theoretical background of hedging and default management processes were obtained through the studying of scientific papers, through Eurex documents and by personal communicating with experienced traders. The second group of sources is more technical and more for data gathering purposes. This group includes Bloomberg and Reuters terminals in order to get all necessary bonds’ information. The company provides an access to the terminals with all necessary assistance in data gathering. While the
industry experience and professionalism of my supervisors – Gonçalo Ribeiro and Vincent Prepin supported me in the analysis development.
1.1. What is a Repurchase Agreement?
Repo is a secured way of financing activities, which most often is related to short term borrowing and lending. Secured financing means that investors mitigate the counterparty risk through the collateralized transactions, where collateral acts as a guarantee. In order to be clearer in terms used it is necessary to explain how the repo trade is built (Pic. 1): repo has two sides, where Side 1 and Side 2 are agreement participants. At day t sides agree the amount of cash and market value of the collateral that will be exchanged at day t + x (First Leg). After some time, at t + y (Term Leg/Second Leg), sides do the reverse exchange, where the borrower of cash returns that cash, pays some predefined interest and receives its collateral back. In every transaction the side that borrows cash at First Leg is called Cash Taker or Collateral provider, while the other side is the Cash Provider or Collateral Receiver. To access the cash, Side 1 (or Seller) should pay for this liquidity. This payment is called Repo Rate and is defined as an interest rate. Repo Rate is usually already included in repurchase price and the rate itself is usually lower then LIBOR or EURIBOR due to collateralized borrowing.
Picture 1. Repurchase Agreement transaction
The relationship between cash taken and collateral provided is the following: purchase price is equal to the market value of securities. Repo rate is computed as the percentage of cash amount.
1.1.1. Eurex Repo
At Eurex, the Repurchase Agreement as a product exists for 17 years already. Currently there are more than 150 international market participants that settle repo transactions at Eurex market (Eurex Repo,
2018). Eurex offers all possible types of collateralized borrowing where the most popular are the General Collateral repo and the Special Repo. Both types of transactions assume that both sides of the agreement agree to exchange cash and securities at the purchase price amount and at a specified rate. But there is a difference: in case of GC, the buyer or collateral receiver at the First Leg does not specify what exactly security he expects to receive. Side 1 provides so called basket of securities that would satisfy the requirements of a buyer. SR is built on the opposite logic: buyer in the repo transaction will expect to receive a certain specified security at the settlement date of the contract.
Eurex offers around 5000 fixed income securities that are spread within 27 different baskets. Baskets are different in terms of riskiness of assets, country/region exposure, maturities of assets or industry exposure. The most common ones for repo transactions are the ECB Basket – EU countries government and corporate bonds with the rating no lower than A, and the ECB extended basket – EU countries plus Malta, Slovakia and corporate and government bond issued with the rating no lower than BBB. As soon as a repo is settled, Eurex Clearing automatically becomes the legal clearer of that transaction. To clear repo transaction for Eurex Clearing means that company is becoming the buyer for the seller (Side 1) and the seller for the buyer (Side 2). If one of the sides defaults, Eurex Clearing is obliged to fulfill all the obligations of the defaulted member. Thus further, it is necessary to break down the risk profile of repo transaction as well as the underlying security.
For simplicity we can assume that at some point one of the members that had open repo trades portfolio, defaults. Moreover, the defaulted member had taken both Side 1 and Side 2 in different repo transactions, meaning that Eurex will take all its positions on both sides. On the one hand, Eurex will need to deliver the repurchase price (cash taken plus repo rate specified at a settlement date), on the other hand, the company will need to deliver collateral. In both cases Eurex will be subject to bond risk profile as in the first case it will receive collateral and sell it in the market in order to cover cash returned, and in the second case it will need to go to the market in order to buy the necessary bonds to deliver. That effectively means there is market risk on both sides.
Being subject to the bond portfolio means two big types of risk – systemic (market) risk and idiosyncratic (credit) risk of the issuer. Credit risk is not taken into consideration in the analysis due to the fact that all baskets are strictly controlled by regulators and are aimed to mitigate credit risk for
the clearing house in general. At the same time market risk is not covered and should be carefully treated.
Market risk is presented by a volatile interest rate environment. Repo short positions, where Eurex will need to buy and deliver bonds at term leg, will suffer from the interest rates going down (meaning bonds prices up). At the same time, if Eurex will need to sell received collateral in order to cover paid cash, then it will suffer from interest rates going up (meaning bonds prices down).
In such a way, the company needs a sustainable interest rate strategy to mitigate risk in order to prevent big losses. Theoretical background will give a solid understanding of the product and how to hedge the portfolio in different market conditions.
1.2. Literature Review
Repurchase agreement as a product
With the increased interest for secured financing, multiple articles have been developed about the repo as a product and the dynamics of its markets. Namely, Choudhry (2011) provides complete description of the instrument with derivation of different types and risk analysis of repo trades. The author focuses on theoretical explanation of the product applicability. Central banks use repo as an instrument for open market operations, while companies find repurchase agreement very important for liquidity needs. At the same time the author provides some practical examples from the trading point of view in UK gilt repo market. The work is also very interesting in terms of market description by countries including UK, France, Germany and Italy, which is highly useful and important to understand as most of the Eurex CMs come from listed above countries.
In order to develop a hedging strategy, it is key to understand underlying risk factors. Hence, regarding the risk analysis, academics discuss risks such as market, credit and counterparty risks. Comotto (2009) and Biaconi, Collot and Knepper (2010) and Kakumanu, Nelken, Choudhry (2005) outline these risks for participants of an agreement including suggestions of how to deal with all of them. Papers break down the risk and treat them separately. The market risk, which is the risk of prices change (namely, interest rates for repo transaction), should be mitigated by appropriate hedging strategy using swaps or bond futures. The authors also explain that operational (inability
to deliver the security in time), credit (inability of the issuer to pay its obligations) and technical problems including the security or cash delivery might bring additional risks for the contract sides. All of them can become the reason not to receive cash or security for one of the sides at maturity as it was outlined in the contract. Hence, authors highlight CCP role as a key element to mitigate these risks.
Though papers study the risk from the investment managers’ perspective (which is different from CCP), they help to identify that repo transaction brings interest rates uncertainty as a main and first risk to be hedged due to markets high volatility and sensitivity to news. Further, after understanding where the risk comes from, it is necessary to study how to get rid of it.
Hedging instruments and strategies
The common risk to be discussed in the Chapter 2, is interest rate risk. Thus, it is essential to study common ways to hedge against it in a bond portfolio. Currently the greater concern is caused by uncertainty regarding the future of interest rates (in particular, the current flattening the yield curve). Future possible crisis as well as the exit of the Quantitative Easing Program and the foreseen future Central Bank rate hikes underline the increasing importance to the hedge future interest rate volatility.
This way, there are several studies dedicated to the discussion of interest rates uncertainty. The research of Chida (2006) has valuable implication for further analysis. The author studies practical application of hedging with bond futures in rising interest rates market conditions on the European market data. Chida presents different ways to calculate the hedge ratio which is the proportion of futures one must held to hedge the full book. The ratio can be computed using either the conversion factor, duration method or the regression analysis. The first method assumes that hedge ratio is equal to conversion factor (i.e., the relation of cash bond price to the futures price), duration method is based on the idea of interest rates sensitivity (i.e., duration of the bond divided by the duration of futures) and regression analysis studies the linear regression between underlying and hedging instrument, where slope coefficient (beta) plays key role for hedge ratio computation. Chida tests all the alternatives and the results are compared based on real data for Japanese Government Bonds
market. Though, the author highlights the applicability of regression and duration methods, he also emphasizes that results can vary in different market conditions.
Several studies have examined how to deal with corporate bonds in a bond portfolio. The matter is that all usual hedge instruments (bond futures, swaps) have government bonds as an underlying asset, which puts their applicability for corporate ones as hedge instruments under the question. Kubelek and Pefley (1987), and Acharya and Carpenter (2000) examines different ways. Papers show cross hedge (hedge based on the positively correlated securities) applicability of Treasury bond futures for US corporate bond. The authors study portfolios with different corporate bonds proportion in the portfolio (from the lowest – where there are only government bonds, to the highest – where the majority is corporate part). The main conclusion is that the instrument to be used depends on the proportion of corporates and quality of these bonds in a portfolio. It is possible to hedge the whole portfolio with government bond derivatives or use more corporate focused instruments (CDS, equity indexes, callable bonds etc.). This paper is highly valuable due to one more conclusion: government bond futures might be used for hedging purposes in case corporate bonds in a portfolio are highly-ranked. Our case is one of those as ECB and ECB extended baskets contain only high-quality bonds.
All the discussed works study the instrument, strategy, techniques using different methodologies. At the same time there is a very important point to keep in mind – most of the focus in the risk discussions comes from the investment manager’s perspective, while the CCP’s goals and hedge criteria are different (Chapter 3). Secondly, studied papers focus on US, UK or Japanese markets, which makes sense to check delivered results on the EU market data. Thus, the analysis will fill the gap in terms of providing the step by step hedging strategy for a CCP based on the European bonds market data.
1.3. Default Management Process
In case one of the CMs cannot fulfill its obligations, CCP should terminate all its positions. Then, the liquidation of existing positions is initiated. To liquidate positions means to fulfill all the obligations
instead of the defaulted CM and, finally, to get rid of these positions. For these purposes Default Management Process is initiated. The main idea of DMP is to mitigate all risks connected to the defaulted side, minimize the risks for all possible second sides and counterparties for the defaulted CM and to protect market stability.
When the default management process is started, all the positions from the terminated account are transferred to the CCP’s account. The positions that are cleared by CCP are separated in predefined liquidation groups (Equities, Bonds, Commodities etc.). LG is an asset class or group of asset classes of similar profile (risk, pricing, building blocks etc.), After the split, each group is treated separately. DMP unit has predefined steps for default management. They can be divided into 2 groups – hedging the positions and liquidating the positions. Positions of the defaulted CM are liquidated through the auction or independent sale. Independent sale represents selling the portfolio (most probably small one) to other clearing members through the exchange trades or OTC through cold calling.
Auction is a more complicated process. They are split by LGs and further can also be divided based on the more specific product separation (e.g. Equities – Standard equity derivatives, Dividend derivatives and Volatility derivatives). Before the auction takes place, the portfolio is sent to the participants. During the auction, CMs bid their prices and, subsequently, the portfolio is sold out to the highest bidder.
After the DMP process initiation hedging immediately takes place. The first hedging steps are always related to market moves and are called macro hedging. The idea behind is to eliminate most obvious and most relevant market risks as underlying moves or interest rate changes. The whole liquidation process might take time, in this regard, the hedge acts as preliminary steps against market volatility. Most often the hedging entails entering one-side positions which are subsequently added to the existing portfolio. For repurchase agreement trades, their liquidation can be executed through the auction/independent sale or through the series of reverse repo. Reverse repo means to enter the repo transaction that would have approximately the same cash flows but with the opposite sign. If CCP needs to deliver cash at the Leg 1, it will enter a trade where it will receive the same amount of cash
at Leg 1 at the same time. A series of reverse repo transactions off-set the risk of CCP and is one of the most commonly used instrument of liquidation process.
1.3.1. Case Study: Liquidation of Maple positions
On the 6th of February 2016 BaFin issued Moratorium against one of the biggest German banks –
Maple Bank. According to the triggers described in Clearing Conditions (Chapter I, Part 1, 7.2.1), “Regulatory Actions” (Bank went under court proceedings for being caught in Cum-Ex trading) issued on the CM were the prerequisite for Eurex Clearing AG to terminate the client. On the 8th of February
the Board decided to liquidate all the position of Maple Bank and to start DMP. The Maple case is very interesting and important for the research as the main issue for the DMP team was exactly repo liquidation.
The most important lessons learnt from the studied materials about the Maple case are the following: 1) it is extremely important to have the tool that would process all necessary raw data and present portfolio analysis in the way that a trader could immediately start the macro hedging and reverse repo transactions afterwards; 2) the macro hedge (against market risk) in this case was made with German Bunds futures, but it depends on each case; 3) Overall, the hedging strategy might not necessarily cost money for the company and result in loss, but it can also bring profits; 4) if the portfolio contains trades with the first leg, then it can be attempted to try to cancel these repo trades in order to get rid of them. If the other party disagrees, then central counterparty should take these trades into account as well. Thus, Maple default might be one of the most important examples of how in reality the central counterparty will liquidate repo positions, what macro and micro - hedging strategies might be undertaken and what instruments might be used.
Chapter 2
2.1. Data sample description
Real Clearing Member’s repo positions are taken for the analysis. For confidentiality purposes, all the positions were then changed. Despite the fact that the portfolio was modified, it remains realistic
compared to a typical CM in terms of size, number of trades, country exposure, basket position (long/short) and the same maturity of trades. Thus, on the one hand, all confidentiality rules are met, while, on the other hand, we deal with a realistic case.
All the bonds from two GC baskets (ECB and ECB Extended) are gathered and integrated with SR bonds. The obtained bond portfolio represents the total bond exposure of CCP after the CM default. The total number of bonds in the portfolio is 124. The database provides all necessary information about the position, including the amount of securities, cash claim and maturity. In order to be able to have detailed portfolio analysis, the bond portfolio needs to be accomplished with further information. Bloomberg and Reuters terminals were used in order to obtain missing data. Thus, information about the issuer, sector, full bond name, liquidity profile and country of risk were additionally downloaded based on the ISIN of bonds. All data is presented as if CM defaulted on the 16th of October, hence, all
data was downloaded with the reference to the specified date.
2.2. Portfolio Analysis
The portfolio has 124 different bonds: 12 bonds relate to Special Repo trades, while other 112 come from GC Pooling baskets. It is worth noticing that current portfolio only has assets denominated in Euro currency. Hence, after the default, the CCP is not exposed to FX risk. But it is necessary to understand this case is more exception than the general case. In general, portfolios might have bonds/cash to deliver/receive in USD, GBP, YEN or CAD.
2.2.1. Portfolio Term Structure
The preliminary step in repo portfolio analysis is always to consider the term structure. There are 12 dates where CCP will need to deliver either cash or security at the term leg. There are two baskets – Standard ECB and Extended one. Total portfolio is split into GC pooling where CCP will act as a cash payer, while in case of Special Repo intermediary acts as a collateral provider. Overall, we can see that defaulted member is cash payer (» 3 Bn EUR) and collateral receiver at the term leg. Term structure is very important to analyze in order to understand in what periods of time CCP should have certain amount of cash and when it needs securities to deliver.
Picture 2. Term structure of the studied defaulted Clearing Member’s portfolio
Picture 2 represents the amount of securities to receive or deliver at the second leg. CCP will both receive and deliver securities. We can also conclude that the company will act as a collateral provider in GC pooling side. It means that defaulted Clearing Member was acting as special securities borrower and cash provider. From the Picture 2 we can see that during the first 7 working days after the default CCP will need to provide totally around 3.6 Bn EUR in cash. This figure is important to know as soon as possible after default. In terms of liquidity, to raise around 4 Bn EUR in cash might be an issue. DMP team will declare the cash amount required and treasury department will provide that amount. The problem is usually solved by issuing short-term debt or by borrowing from ECB.
On the SR side, CCP will need to provide securities. In order to fulfill this obligation, it will be necessary to buy them first in the market and then deliver at the specified date. Delivered GC Pooling securities (in the first 7 working days) will be sold out afterwards. In that case CCP will suffer if interest rates go up, because in that way company will sell the portfolio at a lower price. In case of SR, where Eurex will need to buy the securities first, company will suffer if interest rates go down, as it will pay higher price.
2.2.2. Portfolio Risk Exposure
Government bonds were always considered as the safest bonds to invest in. These bonds might be issued by a national government as well as by lower levels of government authorities, e.g. municipals. There is big difference between German government bonds and bonds of Spain or Italy, for example. The last ones are considered riskier in comparison to German bonds. Usually riskier bonds offer higher coupons in order to satisfy additional risks. Same applies for other sectors, e.g. financial sector is
-400 -200 0 200 400 600 800 1000 1200 1400 1600
GC ECB GC ECB X GC ECB GC ECB X GC ECB X SR SR SR SR SR SR SR
19/10/2018 23/10/2018 24/10/2018 15/11/2018 16/11/2018 12/12/2018 14/12/2018 12/01/2019 13/03/2019 09/04/2019
Mi
lli
on
s
Securities Amount to receive/deliver (EUR) at term leg
considered the riskiest for the bond. German Bund are considered safer in regard to an Italian bank bond due to country fundamentals and political, economic and financial risk.
In order to get a broader view on the portfolio, we analyze it in terms of country and sector of risk. The studied portfolio is majorly exposed to the French bonds, which represent 59% of total portfolio Market Value (2.8Bn EUR). Then UK, German, Italian and Sweden represent 8%, 6%, 6% and 5% respectively. All in all, listed above countries constitute to the 85% of country portfolio exposure. Regarding the industry, we can see that corporate bonds constitute together to the 76% of the portfolio, while government bonds are just 20%. Moreover, among corporate bonds 55% are from financial sector. All these metrics show that portfolio of bonds is quite risky and require preliminary hedge. Though, it is hard to judge if one bond is riskier than another without specified indicators.
Picture 3. Portfolio sector exposure, country exposure and liquidity HQLA index analysis, all as % of total MV
2.2.2.1 Haircut and DV01 as Risk Metrics
We can track the risk level of a single security using many measures. One of the most convenient indicators might be the haircut. Haircut is a reduction of the asset value usually expressed in percentage. If an asset is worth 1M and the haircut is 20%, then Eurex will treat an asset as it would worth 0.8M, though real value at that moment is 1M. Haircut principal is usually applied to collateral value and represents a line of defense. Hence, if the borrower cannot return the cash, the lender will sell the collateral. While selling the asset in the market, prices can be very volatile, moreover, the asset might be not that liquid. In this regard, haircut provides kind of the buffer against liquidity and market risks and protects the lender from losses. Overall, it means that the higher the haircut, the riskier the asset in terms of liquidity and market risk.
Another often used metrics is the Dollar Value duration or DV01. It shows how the position will change if interest rate of the respective bond changes by 1 basis point, i.e if the DV01 of the portfolio is equal to -1.7 M, it means that if interest rates go up, the portfolio will lose 1.7 M. In different sources and scientific papers, the sign of DV01 is interpreted differently: some prefer to leave sign, some just show absolute value. To avoid confusion, we will further say that if DV01 is negative, then portfolio loses with rates going up and it means that overall portfolio has long position and vice versa.
DV01 for a single bond as well as the DV01 of the portfolio are computed using the formulas below, where 𝑃" is the price of a bond, 𝐷𝑢𝑟" – duration of a bond, 𝑟 "is the interest rate, 𝑁 "is the weight of the
asset in a portfolio:
𝑫𝑽𝟎𝟏𝒊: = −0102 = 𝑃 ∗ 𝐷𝑢𝑟 𝑫𝑽𝟎𝟏𝒑∶= ∑7"89𝑁"∗ 𝐷𝑢𝑟" 𝑫𝒖𝒓𝒊: = − 19∗ 0102
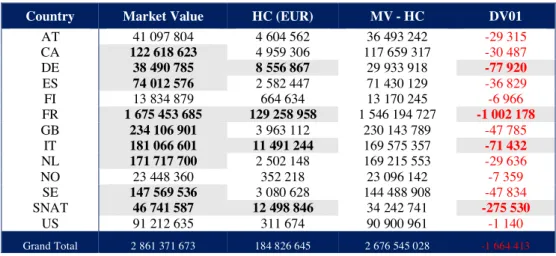
Thus, if we have DV01 in DE bonds is equal to – 77,920 EUR, it means that if interest rates change by 1 basis point then the portfolio will lose 78K EUR (Table 1). DV01 is an additive metric, meaning that two positions with +1 and -1 of DV01 will offset each other and result in 0 of risk (although they might have different maturities, currencies and being exposed to yield spread or credit risk).
DV01 is very convenient to use in terms of checking the offset and to explain the portfolio risk. We can see that the total portfolio DV01 is – 1.7 M EUR, meaning that if all respective underlying interest rates increase by 1 basis point, totally, our portfolio will lose 1.7M.
Earlier we have already identified France, Germany, UK, Italy and Sweden as the biggest exposure in terms of Market Value. But if two bonds have same notional but one is German, and one is Italian, they will probably have different risk profile. Hence, it is necessary to check what countries and sectors represent biggest risk.
In Table 1 the first column shows the biggest market value exposure of studied portfolio in respective country and sector group. Highlighted rows identify countries for further risk metrics analysis. Further we can see that Germany (8.6 M), France (129.3 M), Italy (11.5 M) and Supranational bonds (12.4 M) show the biggest haircut expressed in EUR. It means that for these countries CCP reduced biggest amount of real assets value in order to hedge against market and liquidity risk. In terms of DV01 the we can see the same country exposure (France, Germany, Italy and supranationals), where France
represents the biggest risk (DV01 of -1M). It is worth noticing, that British bonds have the second biggest market value exposure, while the total GB part of the overall portfolio is not considered as a risky one, thus, is out of the macro hedge analysis.
Country Market Value HC (EUR) MV - HC DV01
AT 41 097 804 4 604 562 36 493 242 -29 315 CA 122 618 623 4 959 306 117 659 317 -30 487 DE 38 490 785 8 556 867 29 933 918 -77 920 ES 74 012 576 2 582 447 71 430 129 -36 829 FI 13 834 879 664 634 13 170 245 -6 966 FR 1 675 453 685 129 258 958 1 546 194 727 -1 002 178 GB 234 106 901 3 963 112 230 143 789 -47 785 IT 181 066 601 11 491 244 169 575 357 -71 432 NL 171 717 700 2 502 148 169 215 553 -29 636 NO 23 448 360 352 218 23 096 142 -7 359 SE 147 569 536 3 080 628 144 488 908 -47 834 SNAT 46 741 587 12 498 846 34 242 741 -275 530 US 91 212 635 311 674 90 900 961 -1 140 Grand Total 2 861 371 673 184 826 645 2 676 545 028 -1 664 413
Table 1. Portfolio Risk Analysis based on DV01 and Haircut indicators.
Such a way, it was identified that French, German, Italian and Supranational bonds represent the biggest portfolio risk, where 55% are financial sector bonds, 21% - non-financial and 19% are government. Overall, defaulted CM had all listed countries long bond positions, meaning that portfolio will lose its value in case interest rates go up. At the same time, when it comes to the selling out the collateral provided, liquidity issue might take place. In this regard, analysis of liquidity exposure is also important.
2.2.2.2. HQLA Risk Analysis
Basel III introduced the scale for liquidity ranking of securities according to HQLA metrics. Thus, level 1 means very liquid assets, and the collateral holder will not struggle to sell the security out, while N or NR means the least liquid in HQLA scale, meaning that collateral receiver might sustain losses in terms of costs and time while liquidating the securities portfolio. It is worth taking into consideration the liquidity issue in a portfolio analysis in order to better estimate the time needed for liquidation. Secondly, the HQLA exposure represents the riskiness of the portfolio as well. If the securities are less liquid, it imposes additional risk to the portfolio. Thus, these securities should be hedged in the first place.
93% of the securities are liquid. 88% are highly liquid of 1 and 1A levels of HQLA scale (Pic. 3). The rest 7% are non-liquid securities. In general, it means that in order to sell these securities it might require additional costs and time. Finally, that can also result in higher liquidation costs for the
company. The breakdown of 7% of non-liquid assets show that 46%, 31%, 14% and 9% are French, Italian, German and UK bonds. These countries exposure has been already identified before and we can clearly see that from all studied risk metrics (market value, DV01, haircut and HQLA) French, Italian and German bonds require preliminary macro hedge steps in order to get rid of the market risk.
2.3. Instrument Analysis
In a liquidation process the DMP team will always first go to the Eurex market and use its product line for hedging purposes. If the product range is not enough or other markets offer an instrument that would be better hedge, DMP team will use it. We have already identified bond futures as the most appropriate instrument to use, while the portfolio analysis helped to identify countries exposure. Thus, we can already explore relevant products that might be a good hedge for the studied portfolio. German bonds
For German bonds Eurex offers wide range of derivates. Among bond futures we can use Euro-Schatz, Euro-Bobl, Euro-Bund and Euro-Buxl. All of the futures contracts have National Government bonds issued by Federal Republic of Germany as underlying. Contracts have different expiries. Thus, Schatz futures have 1.75 – 2.25 years of maturities, Bobl futures are 4.5 – 5.5 years and Bund has the range of longer maturities of 8.5 – 10.5 years. In the portfolio, all German bonds’ maturities vary from 1 to 10 years, hence, all of them can be hedged with Eurex bond futures. In the portfolio we also have Netherland bonds. The risk exposure analysis has not identified NL bonds as the potential area of threat. But since the NL bonds are very close to German bonds according to their risk profile, they can be hedged altogether with German bonds in the same basket. Supranational bonds include bonds that were issued by the international institutions. Current portfolio of bonds includes European Investment Bank, European Stability Mechanism and European Financial Stability. All supranational issuers are considered to have very high credit risk rating. Hence, all bonds are considered risk-free. In terms of risk profile, supranational bonds have the same characteristics as German bonds. In this regard, they can also be joined with German and Netherland bonds into one basket for hedging purposes. This way,
we take Netherlands, German and SNAT bonds as a separate portfolio or basket to be hedged. The correlation index between the bonds portfolio returns and futures returns portfolio returns is 0,95. French Bonds
OAT futures are considered as the best proxy for interest rates hedging in the French bond market. Eurex offers mid- and long-term futures for hedging purposes. French bonds in the portfolio have wide range of maturities from 3 months to 10 years. Further we will consider mid-term future contracts as a hedge proxy for bonds up to 3 years of maturity and from 3 years to 10 years as a proxy for long-term bonds.
OAT futures returns behavior exactly repeats the French bonds basket behavior. The correlation coefficient between French bonds portfolio returns and OAT futures returns is 0,95. It proves that OAT futures is a right instrument for hedging purposes of French bonds basket.
Italian Bonds
Euro-BTP Futures are futures on long-term Italian government bonds and considered to be a good hedge for Italian bonds in the portfolio. Italian bonds in the studied portfolio have the maturities from 4 years to 8 years. Long-term BTP are more liquid comparatively to the short- and mid-term ones. Thus, including the fact that portfolio contains bonds of different maturities, bucketing duration method will be used. This method (which assumes adjustments of the futures portfolio duration the way that both portfolio durations are the same) will help to create the futures portfolio that will better replicate the original portfolio. Thus, Bonds portfolio has the duration of 5.3, while the futures duration is 7 years, hence number of contacts will be multiplied by 0.76.
The correlation between Italian bonds basket and BTP futures is 0.67. According to many statistics rules (Taylor, 1990), correlation between 0.6 and 0.8 is considered to be strong. Though, we can notice that for Italian bonds the dependence between underlying portfolio and hedge instrument is lower than in German and French cases. Further, we will assume that BTP futures are still a good hedge for the Italian bonds portfolio. Italian bond market has similar risk profile with Spanish bond market, what makes both of them consider in the same basket for further hedging (as it was done for German + Netherlands, e.g.).
2.4. Hedging strategy with Bond Futures
Strategy 1: in very distressed situations with very limited time, the Bund future is used for hedging of the whole portfolio without splitting into baskets by country or by sector. The assumption behind is that all markets are highly correlated. If we compute the correlation coefficient, the relationship between Bund Futures returns and studied portfolio returns is around 0,91, which is very high. Thus, the first strategy to consider would be hedging the whole portfolio with Bund futures. To develop the strategy means to propose the instrument, number of contracts to enter and the direction of the position (long/short). We have an overall long market value bond portfolio, hence, we will need to short derivatives. The most important question of how many contracts should we enter? The hedge ratio will be computed using the duration method using the formula below, where the 𝐻= is the hedge ratio:
𝐻= = 𝐷𝑢𝑟= 𝐷𝑢𝑟>
Thus, if we say that portfolio DV01 is 1.67M EUR, the DV01 of 1 tick is 13.03, while transforming into EUR dimension (where 1 tick value is 10 EUR), in this regard DV01 of contract is 130.3 EUR. Overall, it means that we should enter short position of 12 238 of Bund futures. It is worth noticing, that all the DV01 were computed on the assumed day of default or when the macro hedge was supposed to be initiated. But these numbers might change overtime (e.g., because of the price changes).
Strategy 2: The second strategy would be to split the portfolio into baskets and hedge with appropriate country derivatives as it was analyzed before. The duration match method will be used to compute the number of contracts. Thus, as before we take the DV01 of the basket and the DV01 of the relevant future. Such a way, for DE+NL+SNAT basket, IT+ES basket and French basket will be hedged with the number of contracts -1406 of Schatz, 324 of Bobls and 540 of Bund futures, -1149 of BTP of relevant maturities and -8221 of OAT futures respectively. The DV01 of the total derivatives portfolio is 1.453M EUR, while the total DV01 of three bonds baskets is 1.454M EUR, which means that proposed number of contracts match the risk of the baskets split by country.
2.5. Hedging with Euro Stoxx 50 Corporate Bond Index Futures
Euro Stoxx Corporate Bond Index tracks the performance of the bonds issued by the companies in the Euro Stoxx 50 index composition. If we take the country split of Euro Stoxx Index we will see that biggest share is related to Germany (31%), France (27%), Italy (11%) and Spain (21%) by market
value. Our studied portfolio has 87% of DV01 related to the listed above countries. Moreover, we have already concluded the fact that prevailing number of bonds in the portfolio are corporate bonds, which makes the instrument more appropriate and relevant for hedging purposes. Thus, including the fact that the European bond market is highly correlated between countries, the Euro Stoxx 50 Corporate Bond Index Futures will be used in order to hedge the interest rate risk of the portfolio.
Strategy 3: One of the possible strategies could also be to hedge the whole portfolio with Index Futures due to medium correlation between corporate and government bond markets (correlation = 0.56). The product of Corporate Bond Index future is quite complex, and computation of duration takes a lot of time. At the same time can be very inaccurate estimation: Bloomberg does not provide risk metrics for CBI1 Index and there is no tool in DMP section for risk metrics computation regarding Corporate Bond index futures. In this regard, the linear regression method in order to compute the hedge ratio was used: 𝐻= = 𝜌=,>∗ AAB C = 𝛽=,> # 𝑜𝑓 𝑐𝑜𝑛𝑡𝑟𝑎𝑐𝑡𝑠 = 𝐻= ∗ 1M2N>MO"M P"QR SMN"MTUO M> >VNV2RP= 1M2N>MO"M P"QR 1C∗ WVON"=O"R2C
In the formula, 𝜌=,> is the correlation coefficient between bonds portfolio and futures, while 𝜎 represent
the standard deviation of assets. All in all, hedge ration is nothing but the slope of the linear regression, where portfolio is a dependent variable and futures is independent one. Further, number of contracts is computed by multiplying beta (7,8%) by the portfolio size (2,9 Bn) and is divided by the futures notional (102 790 EUR). Thus, number of contracts to enter is equal to – 2052.
Strategy 4: Another approach could be to hedge government bonds with futures on government bonds based on respective basket and corporate bonds portfolio to hedge with corporate bond index futures. Hence, the portfolio is divided into corporate and government parts. It is worth noticing that correlation between Index Future returns and corporate part of portfolio is much higher (0,65), which will have better hedging impact. The government part of bonds in the portfolio will be hedged with the same bond futures structure regarding the country and maturity of bonds, using the duration method: -958 of Schatz, -122 of Bobls and -328,6 for Bund futures (DE+NL+SNAT government bonds basket), - 94 BTP futures (IT+ES government bonds basket) and – 3964 of OAT futures (government French bonds basket). The corporate part of the portfolio will be hedged with Euro Stoxx 50 Corporate Bond Index Futures using the regression method (as in case of Strategy 3). Due to the high proportion (80%) of
corporate bonds in the portfolio, the number of Index Futures to hedge corporate bond part of the portfolio is -1940.
Strategy 5: One more possible strategy would be to hedge just the government bond part of the portfolio. The hypothesis here would be that Strategy 2 will provide better results in terms of smother returns and lower risk metrics measures. The general idea is that there is still quite high correlation in returns between corporate and government bond returns. But all of these hypotheses should still be tested on the real portfolio data. As before, we get the total DV01 for every basket and compute the number of contracts as DV01 of the basket divided by the DV01 of the futures contract, using the duration method. Thus, we get number of contracts to enter for German and Supranational basket of – 2037 (Bund, Schatz and Bobl), -94 contracts of BTP and -3746 futures of OAT.
Chapter 3.
3.1. Risk Metrics for the developed strategies testing
The goal of hedge for a central counterparty is different from the traditional understanding of hedge. While hedging, traditional buy-side financial markets participants are focusing on both the return and volatility. Both metrics make sense and if there is a choice between two options, usual investment managers would go for the one with higher Sharpe ratio despite possibly that option having the highest standard deviation. In case of a CCP, it will not take the return into consideration. Central counterparties will always seek to reduce volatility and smooth the returns. As a stability warrant, CCP will choose the strategy with lower risk and with lower costs. The definition of costs for CCP is also different. Costs, from CCP perspective, are the market movements as a result of DMP process. Thus further, we will base on these two criteria – risk reduction and costs, to select the recommended strategy.
3.1.1. Measures of the portfolio risk
In order to compare different hedge approaches, it is necessary to transform risk into the same dimension for every strategy. The simplest way to compare risk can be the use of standard deviation of the hedged portfolio. We will assume that the strategy with lower standard deviation is less risky.
CCP should provide the macro hedge during the first 1-2 days of default in order to prevent future losses. Thus, for standard deviation metrics we will use daily parameter.
Only one risk metrics might give the biased estimation. In this regard, it is necessary to use other metrics for comparable reasons. Another common metrics is Value at Risk (VaR). VaR is quite often used in risk management due to its computation simplicity and ability to measure the riskiness of the portfolio including the multicollinearity effect between assets. For the case, we will use the daily data based on the 95% confidence interval and the Monte-Carlo simulation: 𝑽𝒂𝑹 = −𝑽𝒑∗ 𝝈𝒑∗ 𝒁𝜶 ,
where 𝑉= is the portfolio value, 𝜎=is daily standard deviation and 𝒁𝜶 is a value of cumulative
standardized normal distribution Z, with 5% probability mass to the left (95% confidence interval). One more important thing that can show the result of the hedging strategy is the P&L in the next day after the strategy is applied. Meaning that if we apply the strategy what would be the profit or loss on the next day after default. All of the strategies have to be compared between each other based on the described metrics and to the initial portfolio of the defaulted member. We will assume that hedging strategy is effective if it reduces the riskiness of the studied portfolio.
3.1.2. Measures of the costs for CCP
As it was already defined, the costs for CCP is not something which the company pays to execute the strategy, but it is something which brings alternative costs of it. If CCP enters a position with a significant amount, that might lead to adverse market movements which will bring losses for CCP and will cause regulatory issues from the authorities. Thus, important criteria for the strategy definition would be to define how deep the market is and if the CCP can execute the proposed strategy in real life without causing any market impact (comparison of number of contracts to enter and daily traded contracts). In order to measure it we will need to check the parameters of contracts traded during the day, open interest on it and track how the order book looks like during the day.
The Bund futures are the most liquid and frequently traded contracts, while the Schatz and Bobl futures have lower open interest and traded contracts during the day. The product that arises the biggest concern is Eurostoxx Corporate Bond Index futures. These index futures are completely illiquid and will be a big problem for the company while proceeding with liquidation. First, entering the position
of approximately 2k of futures will considerably move the market (as average daily traded volume for the last month is 5 contracts) and, secondly, the DMP team will not be able to get rid of these positions after the hedge. In this regard, Strategies 3 and 4 do not meet the costs criteria.
Regarding the costs analysis of the strategies using bond futures, we can see that all other products are quite liquid. At the same time, it is worth noticing that the final costs will depend on the traders’ execution strategy and the order book (if the trader bids 2K of contract at the same time or he does it during the 1-2 days, etc.). For example, if we take the Bund Futures during the day, the bid quantity is around 200 of contracts, which means that the trader will probably execute the 2K not at the same time but partially. All in all, the conclusion from the costs analysis says that bond futures are quite liquid and can be used for the hedging strategy. The Euro Stoxx 50 Corporate Bond Index Futures is an illiquid product, which will create some difficulties in terms of moving the market and liquidation of these positions after the DMP process. In general, the decision of hedging strategy will depend on the respective traders and analysts’ decision taking into consideration all costs and risk metrics analysis. It is worth saying, that the analysis was done taking in consideration the recent data and all the conclusions regarding the strategy applicability might change over time. It is possible, that volume on corporate bond index might be enough in the future to execute Strategies 3 and 4.
3.2. Strategies Comparative Analysis
In order to choose the best strategy for hedging it is necessary to compare all the deliberated options in two dimensions – the decrease of risk and costs involved in DMP process. For risk metrics we will look at the standard deviation, representing the daily volatility of portfolio, Next Day P&L (how much would portfolio earn/lose next day after hedge is executed) and VaR (meaning that portfolio in 95 out of 100 days will not lose more than VaR).
As we can see, initial portfolio has daily volatility of 0.13%, next day after the default would bring the portfolio owner 3.5M EUR and VaR is equal to 6.1, meaning that portfolio will not lose more than 6.1M in 95 out of 100 days on a daily basis.
The first strategy is based on the idea, that all markets are quite correlated, and Bund Futures are commonly used for the whole portfolio hedging. If we hedge the whole portfolio only with Bund Futures, this strategy will result in decrease of standard deviation by 0.09 p.p., next day CCP would earn 2.7M EUR and the VaR of this portfolio would be 4.86M.
In terms of costs, in order to execute the strategy, the trader should bid 12K of Bund Futures, representing 2% of traded daily contracts.
Strategy 2 is focused on the basket separation by country with the use of relevant bond future contracts with relevant maturity. This option shows significant decrease of volatility by 0.045 p.p., profit next day would be 2.1M and VaR is just 2.7M. This result shows, that if portfolio has quite diverse country exposure, hedging by basket would be most appropriate option to go for. Costs for Strategy 2: 0.3% for DE+NL+SNAT basket hedging, 2% for IT+ES and 5% for French bonds (all percentages are the proportion of hedge amount to the daily traded contracts).
Strategy 3 is based on the idea of hedging the total portfolio with the Eurostoxx Corporate Bond Index futures. It brings disappointing results of increased risk metrics and extremely high costs, meaning that execution of this strategy will worsen the situation and bring alternative costs for CCP in terms of market moves and difficulties in liquidation.
Strategy 4 is based on the idea to combine the corporate bond index for corporate bonds in the portfolio and bond futures for government bonds in the portfolio (as in case of Strategy 2). Here, the idea was to include the fact that corporate and government bonds can be treated differently to get better hedge.
The number of Eurostoxx 50 Corporate Bond Index Futures contracts for corporate part hedging is 1940, which is also an obstacle due to illiquidity of the product. At the same time the decision will depend on the traders who have very broad networks and it is always possible to execute the strategy OTC.
Strategy 5 based on the same hypothesis as Strategy 2, but just for the government part of the portfolio. Strategy brings a bit worse results in terms of riskiness, proving the fact that corporate and government bonds are correlated and dependent and it is worth hedging them together in some cases.
Overall, we can see that Strategy 2 brings the best results in terms of risk decrease and costs of execution. The final costs will depend on the trader’s strategy, who will be based on the order book and can take up to 2 days for strategy execution. Strategy 1 might have higher costs but can be better used for smaller portfolios (without high market value), for example. Strategy 2 is good when the portfolio is diverse in terms of countries exposure and the proportion of government bonds is higher than the proportion of corporate bonds in the portfolio. Strategy 3 and 4 might be used when the corporate bond index future will become more popular (the product is quite young) and when the traded volume will be higher. Overall, strategy 4 might be also the most reliable one, as it provides countries and sectors split and hedges these exposures of the portfolio accordingly. Strategy 4 can also be executed by traders taking into consideration OTC market.
The risk indicators of Strategy 5 (VaR is 3.4M) a bit worse than for Strategy 2 (VaR is 2.7M). The difference between them is that Strategy 5 focuses only on the government bonds part of the portfolio, while the Strategy 2 hedges country risk without taking into consideration government/corporate bonds split. Results obtained show that there is a dependence between government bonds and corporate bonds on the studied portfolio and that Strategy 2 hedges better the interest rate risk of it.
If we compare returns of the hedged portfolio using different strategies (Ap. 3), strategies 2,4,5 smoothen the returns of initial portfolio significantly, which already represent good result. According to the criteria the best strategies would be 2 or 5, depending on the portfolio size, costs structure (Strategy 5 will definitely bring lower costs as it focuses only on the government part) and the government/corporate bonds proportion in the portfolio.
Finally, if we project the returns of the initial portfolio and hedged portfolio according to Strategy 2, we can see lower volatility and smoother returns of it, which was the goal. According to the risk metrics and costs analysis, for studied portfolio Strategy 2 should be chosen for macro hedge in case of default.
Picture 4. Returns Comparison.
3.3. Conclusion and Recommendations
The main goal of the analysis included delivering sustainable hedging strategy for a CCP, that would make returns of the bond portfolio smoother and less volatile. Strategy 2 decreases riskiness of the portfolio by 55% according to VaR. In general, throughout time, if the CCP applies Strategy 2 it can reach a less volatile portfolio. This strategy can be a sustainable solution that meets the criteria of CCP as an intermediary in the market and meet the criteria of a macro hedge, that should be executed immediately after the default of one of its members. In general, Strategy 2 is the best solution for the studied portfolio and according to the analysis, CCP would need to use Strategy 2 in case studied CM defaults.
Overall, final costs and results will depend on the traders’ strategy execution, including the trading and positions liquidation (how the order book will look like, if traders go for the market or OTC, etc.). Besides reaching the final goal of the research and finding the solution, other conclusions can be found: 1) Bond futures have shown strong correlations with the relevant bond baskets portfolios, which makes the instrument in general very useful for hedging purposes. It was identified for studied portfolio that according to the portfolio split by country, the most relevant bond futures would be: Schtaz, Bobl and Bund for Germany + Netherlands + Supranationals basket, long-term BTP futures for Italian + Spanish basket and OAT futures of different maturities for French bonds in the portfolio.
2) The analysis helped to identify French, German, Supranational and Italian bonds as the most country risk exposed bonds. The instrument for hedging was chosen accordingly based on the identified countries. At the same time, an important conclusion is that if countries have similar risk
-0,25% -0,20% -0,15% -0,10% -0,05% 0,00% 0,05% 0,10% 0,15% 0,20% 10.08.18 30.08.18 19.09.18 09.10.18
Initial Portfolio returns vs Startegy 2 hedged portfolio returns
profile (as Germany and Netherlands) we can also include these countries in the same basket, which will allow:
a) To reduce more risk of the total portfolio overall;
b) To increase the number countries to be hedged against the interest rate risk;
3) The duration and regression methods might be used in order to identify the hedge ratio and appropriate number of contracts to be used in order to decrease the riskiness of the portfolio. Both methods provide reliable results.
4) For comparing purposes, in order to choose the best hedge, the CCP would need to look at the hedging results in two dimensions: the risk reduction and costs involved:
a) Risk reduction can be tracked through the standard deviation, VaR and Next Day P&L metrics, they allow to track if the original portfolio volatility was decreased after the hedge was applied; b) Costs are the adverse market movements following the CCP hedging steps, meaning that if CCP enters the comparatively big number of contracts in a very illiquid product, it will move the market. Costs can be watched out using the proportion of the assumed contracts in relation to the daily traded volume in the market;
c) Important conclusion might also be that if costs are considered too high in the market, then CCP traders might execute the strategy OTC.
5) For the studied portfolio, Strategy 2 was assumed the best approach to choose for hedging purposes (decreases the riskiness of the original portfolio by 55%), while it cannot be chosen as the general way for every case. The main conclusion is that hedging strategy will depend on the following portfolio parameters: country diversity and the proportions of the different countries bonds in the portfolio, sector split (the proportion of government/corporate bonds in the portfolio), corporates split (proportion of financial to non-financial corporate bonds in the portfolio). Based on listed parameters of the specific case, trader might choose different strategies.
6) The analysis has shown, that if the portfolio is quite diverse in terms of country, sector exposure and maturities of bonds, and therefore it is more efficient to split the original portfolio into baskets and hedge every basket with the relevant instrument: thus, for example, for German government bond basket of long maturity the Bund future will be used. Baskets should be built based on the country, sector and maturity criteria.
7) Better results of Strategy 2 over the results of Strategy 5 show that if there is no good hedging instrument for corporate bonds in the portfolio, then corporate and government bonds should be hedged together in the same country basket. It will increase the effectiveness of the hedge and better decrease riskiness of the portfolio.
8) Strategy 4 has shown that there is a necessity for searching appropriate instruments for the purpose of hedging the corporate bonds in a portfolio. Eurostoxx Corporate Bond Index Future is very illiquid instrument to use it for hedging purposes, while it can become more demanded in the future. The research was the preliminary step to develop a new risk management tool. Based on the reached conclusions of the research, there are recommendations for the tool building in the future:
1) first of all, the BPM tool should be connected to the database and terminals for data gathering when necessary;
2) tool should be able to summarize all the data regarding the defaulted CM’s positions in the bond LG;
3) it is important that tool has the Bloomberg/Reuters connection in order to download additional information regarding bonds in the portfolio (issuer, sector, country), that the current database does not provide;
4) BPM tool should present all the trades information as well as the portfolio analysis in a representative way (charts, graphs, pivot tables, etc.);
5) The term structure as one of the deliverables is crucial for the analysis. BPM tool should be able to provide the term structure of the defaulted CM portfolio: the DMP trader will immediately see when CCP needs to deliver cash/security, of what amount, if CCP needs additional funding, e.g. to approach treasury department;
6) BPM tool should be able to analyze and present the information regarding country, sector, liquidity exposure and split the portfolio into baskets based on the country, sector and maturity criteria. 7) after all the analysis is presented, some hedging logic can be introduced (as a light advise for the trader what to do in this or that case): for example, if portfolio consists of more than certain number of government German bonds, then it is advised to go for Strategy 1, or if the portfolio is quite diverse in terms of countries and there is a higher proportion of government bonds – go for Strategy 2, etc. Implementing all of these points in the tool will definitely make the DMP process for the bond liquidation group much easier and more efficiently.
3.4. Limitations to the research and further steps
Though the analysis has shown a number of options for hedging strategies, there are some limitations to bear in mind. These limitations are out of the scope of the analysis but are important to be taken into consideration while choosing the hedge.
First of all, there are limitations to the scope: it was defined to focus on the market risk only, while other risks (credit risk) are left for further analysis. Most important thing to keep in mind is FX risk. The portfolio of the CM can be very diverse in terms of country and currency exposure. For instance, the GBP bonds are left out of the scope, while Brexit can have significant impact. Further it means that it is necessary to do the research regarding the appropriate instrument to use in case hedge for GB bonds is considered to be necessary. Moreover, the hedge against FX risk involves deeper analysis and other products to use.
Secondly, duration and regression methods were used for hedge ratio computation. The literature review helped to identify other methods (e.g., conversion method) to use for these purposes. Therefore, for future analysis it is important to compare the results using different techniques in order to find the most appropriate one.
Thirdly, the DV01 method was used under the assumption of small interest rates change in the future. It means that if rates change significantly, the technique is no longer worthwhile. In this regard, it is important to include convexity effect for more precise and better estimation in future analysis. Overall, all the limitations found fall under the scope of the analysis while the discussion of them and proposed solutions will build a solid ground for future research and problem analysis.
This research was my first step in Risk Management development during my internship. Further, based on the identified findings and limitations to the research, I am going to continue developing in that area, trying to deal with each of them. This analysis will be used as a base for future research while all the limitations will become new goals to deal with. This research provides the conclusions that can become the starting point for tool development within the DMP section. Reached conclusions build the general idea of how the hedging strategy should be built: what is the logic, what steps should be used, what instruments, etc. Though, many useful conclusions were obtained, the work has significant limitations. The discussed limitations should become the areas to improve for further analysis. Thus, in the future, I will start from adding the currency exposure to the analysis, as it can become one of the most important areas of threat as well.
Sources
Acharya, V. V., Carpenter, J. N. 2000. “Corporate bonds: Valuation, hedging, and optimal call and default policies.” NYU Working Paper S-CDM-00-08
Biankoni, M., Collot, N., and Knepper, G. 2010. “Securities Lending & Repo markets: A practical guide.” CACEIS Reference Paper.
Board, F. 2012. “Securities Lending and Repos: Market Overview and Financial Stability Issues, Interim Report of the FSB Workstream on Securities Lending and Repos. Financial Stability Board Consultative Document.
http://www.fsb.org/wp-content/uploads/r_120427.pdf
Bottazzi J., Luque, J. 2012). “Securities market theory: Possession, repo and rehypothecation.” Journal of Economic Theory 147, 477-500.
Bretscher, L., Schmid, L., and Vedolin, A. 2016. “Interest Rate Uncertainty, Hedging, and Real Activity.” http://ewfs.org/wp-content/uploads/2016/02/2016_01_16_IRS_MainFile_withNames.pdf
Chida, H. 2006. “Hedging with Bond Futures—A Way to Prepare for Rising Interest Rates.” NLI Research
Institute. https://www.nli-research.co.jp/en/report/detail/id=51435?site=nli
Choudhry, M. 2011. “Global Repo Markets: Instruments and Applications. John Wiley & Sons.
Choudhry, M. 2004. “Using Bond Futures Contracts for Trading and Hedging.” John Wiley & Sons, 2-17. Comotto, R. 2009. “Understanding Repo and the Repo Markets.” Euroclear Bank SA 3, 15-37.
Duffie, D. 1996. “Special Repo Rates.” Journal of Finance 51, 199-216.
Ewerhart, C., and Tapking, J. 2008. Repo markets, counterparty risk, and the 2007/2008 liquidity crisis. ECB
Working Paper 909, 48
Eurex Repo. 2018. Repo Market. Accessed December 10-22. http://www.eurexrepo.com/repo-en/markets/euro-repo-market
Grieves, R., and Marcus, A. J. 2005. “Delivery Options and Treasury-Bond Futures Hedge Ratios.” Journal of
Derivatives 13(2), 70.
Kakumanu, K., Nelken, I., & Choudhry, M. 2005. “The ‘HedgeRepo’concept: Using credit derivatives as repo collateral.” Derivatives Use, Trading & Regulation 11, 37-57.
Kolb, R., and Chiang, R. 1982. “Duration, immunization, and hedging with interest rate futures.” Journal of
Financial Research, 5(2), 161-170.
Kuberek, R., and Pefley, N. 1983. “Hedging corporate debt with US treasury bond futures.” Journal of Futures
Markets 3(4), 345-353.
Pepić, M. 2014. “Managing Interest Rate Risk with Interest Rate Futures.” National Bank of Serbia, 201-217. Rosati, S., Wende, W., and Haene, P. 2010. “Strengthening repo clearing and settlement arrangements.” Bank