M
ASTERS IN
FINANCE
M
ASTER
’
S
F
INAL
W
ORK
P
ROJECT
H
OW AND HOW FREQUENTLY SHOULD PORTFOLIOS BE
REBALANCED
?
F
ÁBIO
R
OBERTO
M
ATIAS
C
OTRIM
M
ASTERS IN
FINANCE
M
ASTER
’
S
F
INAL
W
ORK
P
ROJECT
H
OW AND HOW FREQUENTLY SHOULD PORTFOLIOS BE
REBALANCED
?
F
ÁBIO
R
OBERTO
M
ATIAS
C
OTRIM
SUPERVISOR:
R
AQUELM.
G
ASPARiii
Abstract
Throughout the years, academics, consulting groups and investment companies have tried to study the relevance and the performance of portfolio rebalancing strategies. Many have found that the difference between doing it or not is negligible, as costs had impact in the return after rebalance.
Most of the literature on rebalancing has, however, focus on two asset (risk and risk-free) analysis. In this work, we study the existence of three assets instead: a risky stock; a risky (corporate) bond; and a risk-free asset. We perform an empirical analysis of the European market and test several rebalancing strategies.
We conclude that the optimal rebalancing depends on the investor’s risk preference, but in general it enhances the portfolio’s return and performance.
Key words: Portfolio Management; Rebalancing; Calendar; Threshold; Margin;
Homogeneous portfolio; Tangent portfolio; Performance.
iv
Resumo
Durante anos, académicos, consultores e empresas de investimento têm tentado estudar a relevância e o desempenho de estratégias de rebalanceamento de carteiras de títulos. Alguns descobriram que a diferença entre rebalancear ou não rebalancear é insignificante, já que os custos envolvidos tiveram impacto no retorno depois do rebalanceamento.
A maior parte da literatura sobre rebalanceamento foca, no entanto, numa análise considerando dois ativos (com e sem risco). Neste projeto, estudamos a existência de três ativos em vez da abordagem convencional: ações com risco; obrigações (corporativas) com risco; e um ativo sem risco. Conduzimos uma análise empírica do mercado Europeu e testamos várias estratégias de rebalanceamento.
Concluímos que o rebalanceamento ótimo depende das preferências de risco do investidor, mas em geral melhora os retornos obtidos e também o seu desempenho.
Palavras-chave: Gestão de carteira; Rebalanceamento; Calendário; Limite;
Margem; Carteira homogénea; Carteira tangente. Desempenho.
v
Acknowledgment
This Master’s Final Work is a junction of a lot of effort and contributions given
throughout the writing process.
First I would like to express my gratitude to my parents and family for their big effort and continuous support given to me in order to pursuit my goals. I know that sometimes it was hard but this project would not exist if you were not here for me.
I am also thankful to my Master’s Final Work Supervisor, Professor Doctor
Raquel M. Gaspar for her support, motivation and guidance. Her importance and contribution were huge in all stages of this project, keeping this research on track. Furthermore, I would like to give a special thanks to José Elgenedy for his support, motivation, opinions and contributions for this research, surely important in moments where hope seemed lost; Nuno Pinto and Ângela Santos, mostly for their constant motivation, writing support and patience, especially when things were not going as expected. Thank you for your constant help.
Last but not least, I say thank you to André Machado, David Iria, Diana Rita, Diana Almeida, Marisa Elias, Nuno Mendes, Paulo Rôlo da Silva, Patricia Barbosa and
my Master’s colleagues for their useful advices and motivation. Thank you all for
standing by me at every moment. Without you to give me strength, this thesis would not be possible.
vi
Contents
Abstract ... iii
Resumo ... iv
Acknowledgment ... v
List of Tables ... viii
List of Figures ... x
1. Introduction ... 1
2. Literature Review... 4
3. Data and Methodology ... 8
3.1 Data ... 8
3.2 Methodology ... 9
3.2.1 Portfolios ... 9
3.2.2Rebalancing Strategies ... 10
3.2.3Performance analysis ... 11
4. Results ... 13
4.1 Buy-and-Hold Strategy ... 13
4.2 Rebalancing Strategies ... 14
4.2.1 Calendar Rebalancing ... 15
4.2.2 Threshold Rebalancing ... 16
4.2.3 Margin Rebalancing ... 18
vii
4.4 Performance evaluation ... 21
4.5 Comparison with previous studies ... 24
5. Conclusions ... 26
6. References ... 28
7. Appendix ... 30
Appendix A – Composition of the Tangent Portfolio ... 30
Appendix B – Annualized Return, Risk and Sharpe of the portfolios analyzed... 32
Appendix C – Descriptive Statistics of the portfolios analyzed ... 33
viii
List of Tables
Table I - Descriptive Statistics of Return on Stocks and Bonds in Europe, 2005-2015 ... 9
Table II - Results of the Buy-and-Hold Strategy – 2006 – 2015 ... 14
Table III - Results of the Calendar Rebalancing Strategy - 2006 - 2015 ... 15
Table IV - Results of the Threshold Rebalancing Strategy - 2006 – 2015 ... 17
Table V - Results of the Margin Rebalancing Strategy for Homogeneous and Tangent Portfolios - 2006 – 2015 ... 19
Table VI - Best Strategies for Risk Averse Investors ... 22
Table VII - Best Strategies for Risk Neutral Investors ... 22
Table VIII - Best Strategies for Risk Seeker Investors ... 23
Table IX - Historical VaR's from 2005 until 2015 for a 95% and 90% confidence level ... 24
Table X - Portfolio's Annualized Return, Risk and Sharpe for each strategy - 2006-2015 ... 32
Table XI - Descriptive Statistics of the composition of the portfolio for the Buy-and-Hold Strategy ... 33
Table XII - Descriptive Statistics of the composition of the portfolio for the Annual Calendar Rebalancing Strategy ... 33
Table XIII - Descriptive Statistics of the composition of the portfolio for the Semiannual Calendar Rebalancing Strategy... 34
Table XIV - Descriptive Statistics of the composition of the portfolio for the Quarter Calendar Rebalancing Strategy ... 34
ix
x
List of Figures
Figure I - Cumulative performance of the Buy-and-Hold strategy 2006 - 2015 ... 13
Figure II - Cumulative performance of the Threshold strategy for the Homogeneous portfolio 2006 – 2015 ... 17
Figure III - Number of transactions involved in Threshold Rebalancing ... 20
Figure IV - Number of transactions involved in Margin Rebalancing ... 21
1
1.
Introduction
Portfolio rebalancing is a topic of interest for portfolio managers as well as for investors.
From the point-of-view of an investor, this incurs in a high importance since their main goal is to achieve the best possible performance with the portfolio. If by chance the
investor’s risk tolerance or investment strategy has changed, portfolio rebalancing
readjusts the weightings of each security to fulfill the new conditions. Essentially, it will help the investor to stick to his investing plan, whichever direction the market takes. The road to invest successfully begins with the portfolio composition, a strategic choice of assets as well as its proportions in the portfolio as it also determine the level of
risk the investment’s holder is willing to take. The day after, the portfolio will not have
the same composition. Most likely, it will have drifted from its original position, whether positively or negatively. Unless this drift is caused by an abrupt market movement, portfolios slowly drift away and after a while their composition may no longer be suitable, as it does not take into account the recent market fluctuations.
Therefore, for investors who believe that passive management1 performs better, those drifts will not be subject of concern. On contrary, the ones who think that active portfolio management is a strategic move towards the improvement of its performance, rebalancing turns out to be a good way to do it.
This work aims to contribute to the existing literature with an application of concepts of portfolio rebalancing and try to answer to the starting question: How and how frequently should portfolios be rebalanced?”
1 A management style whereby long-term investments are made and it is not affected by short-term
2
Existing studies about portfolio rebalancing suggest that the difference between portfolio rebalancing and passive management, without any intervention, is minimal (see Jaconetti et al. 2010). Some have also studied the cost of rebalancing and its implications in the overall portfolio’s return and concluded that a very active portfolio management,
i.e rebalancing, might turn the portfolio to underperform the passive strategy. (Fama and French 2010)
This work contributes to the literature in the following aspects: 1. Aims at the European Market;
2. Three-asset portfolio composition; 3. A new rebalancing strategy.
First, this work is aimed to the European market. The empirical work that was used as foundation has its attention to the United States of America market and in this work it will be addressed the European case. (Dayanandan and Lam, 2015; Arnott and Lovell, 1989,1993).
Second, they only consider two asset classes – stocks and government bonds – and they use as proxy the benchmark stock index and long term interest rate as the return for the Government Bonds. In this work, it is analyzed a portfolio with two asset classes but 3 instruments: Corporate Bonds, Stocks and Government Bonds. These are represented by its benchmark indexes and the main advantage of including the Corporate Bonds part is that it gives a certain balance to the portfolio’s risk, as well as it diversifies
a little bit more the portfolio. In terms of methodology, the focus in on the creation of a three-asset portfolios, rebalanced according to time or calendar only and threshold rebalancing strategies.
3
the drifts from the portfolio components (like it is done in threshold rebalancing), it analyses the drift of the cumulative portfolio return. When the cumulative return has reached its imposed limit, the portfolio is rebalanced.
4
2.
Literature Review
When it comes to portfolio management, the first decision to make remains on which asset class to include or exclude from the portfolio. This decision is crucial as it is the first step to clarify the risk profile of the investment and according to literature Beebower et al. (1991; 1995) and Almadi et al. (2014), claim that a tactical asset allocation may be able to explain fund performance in the long run and seems to generate higher average returns. Although initial allocation of assets matters a lot, due to market fluctuations or specific events, the defined allocation will fluctuate and can drift away from it a while. Consider, for instance, a portfolio composed by 50% stocks and 50% bonds, an increase in the value of the stocks will increase its proportion on the portfolio but the bond’s proportion will decrease. This fluctuation will accentuate the exposure to
a specific asset class and the risk associated will be higher.
Another aspect to be concerned about is what kind of restrictions the manager faces. The risk profile of the client should be taken into account, since it may be useful to decide where to invest. If the objective is to maximize returns regardless the risk, it should be selected a 100% equity portfolio (Jaconetti et al. 2010). Changes in wealth, changes in time horizon or changes in taxes or regulatory requirements may become barriers or
potentially swell the possible portfolio’s performance.
5
assess the importance of portfolio rebalancing. Dayanandan and Lam (2015) study a 20-year period, from 1983 to 2012, creating a hypothetical portfolio composed by stocks and bonds of U.S.A. They found evidence that rebalancing after 2 years is more profitable than a buy-and-hold strategy. When considering a 15% threshold rebalancing, the difference in the arithmetic mean returns is higher (33 basis points for a 50% stocks and 50% bonds portfolio. Arnott and Lovell (1993) sustain the conclusion that in their analysis period, a calendar rebalancing is more profitable than a drifting portfolio, i.e buy-and-hold portfolio, considering both monthly and quarterly periods. Rebalancing to range or
threshold rebalancing achieves the same conclusion. Even when subtracting a 1% trading
cost to returns, it is more benefic to rebalance the Homogeneous portfolio composed by stocks and bonds. In general, rebalancing portfolios may be useful when considering the risk profile of the investor.
Smith Barney (2003) shows in its paper that trying to avoid risk may end up increasing it, as many investors failed to establish a rebalancing policy during the bull market of the 90’s in U.S.A. According to the same author, several years of increasing equity prices left their portfolios composed mainly by large capitalization stocks. The result was the expansion of their losses in the subsequent bear market. Throughout the
author’s article results, they found that rebalancing tends to reduce portfolio volatility, as
it decreases the exposure to specific asset classes.
6
has its costs and considering a real portfolio moving high amounts of money it is a thing to take into account, as well as capital gain taxes and dividend taxes.
Indeed, there are several studies regarding the performance of active versus passive management of portfolios2. Greenhill (2014) conducts a study about the cost effectiveness of both strategies using 36 active and 36 passive funds and concludes that from that sample, active fund costs were almost 100 basis points higher than passive funds, as their turnover ratio3 was higher than 100%. Those portfolio management types are also influenced by market conditions and derived costs, as after costs, according to Duarte (2012), all active fund management styles have destroyed value. This leads the conclusion that, for the case of Portuguese fund managers, active management seems to be worthless, comparing with the passive management.
Rebalancing portfolio strategies have been classified into three types: (1) calendar rebalancing; (2) threshold or contingent rebalancing; and (3) buy-and-hold. (see, for instance, Bearce and Overway (2015) and Perold and Sharpe (1995)).
Calendar rebalancing strategies are the ones in which after a pre-determined period, the portfolio is needed to be rebalanced. These can be understood as “active calendar rebalancing”, like on a daily or weekly basis, or as “passive calendar
rebalancing”, like on a quarterly, semiannually or annually basis.
With threshold rebalancing strategies, the portfolio is rebalanced whenever the assets drift away from its acceptable proportion. Boundaries are stablished, so for instance if in a portfolio composed by 50/50 stocks and bonds, if the stocks proportion shifts 5p.p,
2 Active management is used by investors or portfolio managers that do not believe that the markets are
efficient and try to exploit those market inefficiencies in order to take advantage of short-term opportunities to profit. Passive management is used when investors or portfolio managers think that the markets are efficient and the best way to invest is to replicate an index or invest in index funds.
3 Turnover ratio is the percentage of portfolio’s components that have been “turned over” or replaced for other assets in a given period. A turnover of 100% means that all of the portfolio’s components were traded
7
10p.p or 15p.p from the initial level, a rebalancing action is needed. This rebalancing can be a complete or only until the target boundary is reached. If a 50/50 portfolio drifts to a 66/34 portfolio, a complete action leads the portfolio to the initial 50/50 and a not complete action, in case of a 10p.p boundary, leads the portfolio to a 60/40 composition. A buy-and-hold strategy is in its sense the passive strategy, you buy a 50/50 portfolio and you let it float until the maturity of your investment.
Most empirical studies point out the benefits of rebalancing a portfolio. Lee (2008) concludes in her research that a non-rebalancing portfolio experiences lower returns than any of the rebalanced portfolios. Between February 1996 and December 2004, the portfolio that was managed with threshold rebalancing strategies had a better net arithmetic average return.
Regarding portfolio performance measures, there is a lot of improvement in the financial literature through these years. As Monteiro (2011) states in his work, the ones
more popular are the Sharpe Ratio, Treynor’s Ratio and Jensen’s alpha. The first two
measures give the excess return per unit of risk but Treynor’s Ratio uses the systematic
risk instead of the portfolio’s risk. Jensen’s alpha takes the CAPM model into account
and informs us if the average return of the portfolio is above or below the predicted from the CAPM.
8
3.
Data and Methodology
In this chapter it is presented the main data and the methodology used in order to study if portfolios should or not be rebalanced and, if so, its frequency. As it was said before, this study will focus on the European market and also include a third asset in the portfolio subject to analysis. Furthermore, it is included another rebalancing strategy with the intention to see if this performs better than the conventional way of doing it or not. The methodology is divided in three key aspects: the portfolio composition; the rebalancing strategies; and the performance evaluation of those portfolios.
3.1 Data
In this study we consider a hypothetical portfolio composed by two types of risky assets (stocks and bonds) and a risk free asset. The investment period is from 2006 until 2015 and we focus on the euro-zone.
In order to represent the three assets in the portfolio, as it is done in other papers about portfolio rebalancing (see (Dayanandan and Lam, 2015), it is considered as proxy for the stock part of the portfolio the Euro Stoxx 50. Regarding the risky bond part of the portfolio, the Iboxx Euro Corporate index is used as proxy. Nonetheless, the risk-free asset included uses as proxy the 10-year euro area yield curve.
9
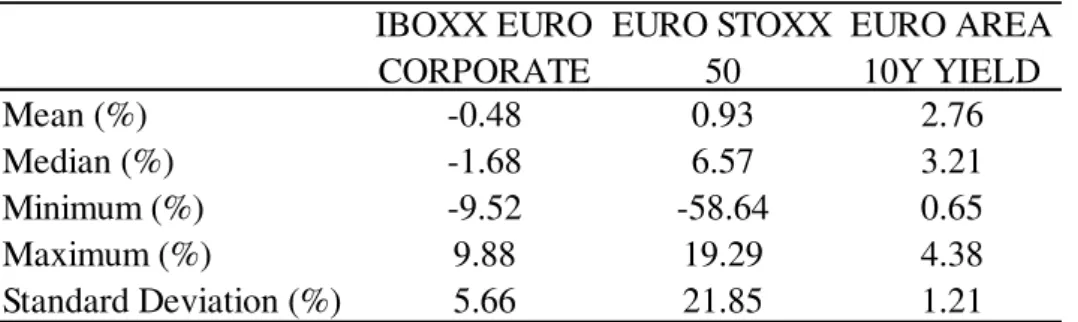
Table I - Descriptive Statistics of Return on Stocks and Bonds in Europe, 2005-2015
Table I reports the return on stocks (represented by EuroStoxx 50), yields on 10-year Euro area bonds and corporate bonds (based on Iboxx Euro Corporate) for 10 10-years (2005-2015). In the period of analysis, the return on government bonds was considerably higher than the return in stocks and corporate bonds. On the other hand, the variation in return (standard deviation) is higher for stocks than for securities, since the risk profile of this type of securities is riskier.
3.2 Methodology
In this project we conduct the analysis under the conventional way that is seen on existing literature and also improve it by analyzing other portfolios. The portfolio composition, the rebalance method and the performance analysis are presented below. The limitations imposed in the study were the following:
a) Tax and labor costs are not considered;
b) Risk tolerance of the investor does not change overtime; c) Transaction costs are not considered.
3.2.1 Portfolios
This study takes €1 million as the initial wealth to invest in several combinations
of the assets, as follows:
Mean (%) -0.48 0.93 2.76 Median (%) -1.68 6.57 3.21 Minimum (%) -9.52 -58.64 0.65 Maximum (%) 9.88 19.29 4.38 Standard Deviation (%) 5.66 21.85 1.21
IBOXX EURO CORPORATE
EURO STOXX 50
10
Fixed weight portfolios as seen in the literature about the topic (weights from left to right: corporate bonds; stocks; risk free asset):
- 0 / 50 / 50 - 50 / 0 / 50 - 50 / 50 / 50 - 20 / 40 / 40 - 40 / 20 / 40 - 40 / 40 / 20
Homogeneous portfolio, composed with equal weights for the three assets. Tangent Markowitz portfolio, computed at each rebalance moment. In order
to obtain the Tangent portfolio, the short-sell is restricted since it provides results that are unreal. It is used the Modern Portfolio Theory developed by Markowitz (Markowitz 1952, 1991) for the following optimization problem, using Microsoft Excel to perform all computations:
max 𝜃 =𝑅̅̅̅̅−𝑟𝑝 𝑓
𝜎𝑝 , 𝑠𝑡 ∑ 𝑥𝑖 = 1
𝑁
𝑖=1 (1)
3.2.2 Rebalancing Strategies
The methodology used to rebalance is based on empirical studies about rebalancing strategies. The rebalancing occurred considering the portfolio’s generated cash-flows4.
Calendar rebalancing occurs at specific moments of the year, whether it is
quarterly, semiannually or annually.
4For instance, suppose a hypothetical €100 portfolio composed by €50 in asset 1 (50%) and €50 in asset 2 (50%). If
one decides to rebalance and the portfolio is valued in €130, €70 in asset 1 (53,85%) and €60 in asset 2 (46,15%), the
procedure to rebalance should be decrease and increase the proportions of asset 1 and 2, respectively. Thus, the portfolio
remains as €130, each asset being valued as €65 (50%). Hence, the rebalance methodology should be buying the asset
11
Threshold rebalancing is done under the assumption that each asset weight
has an allowed value to drift from the original position (5%, 10% and 15% are studied) If it hits these values, a rebalance occurs to the original position or, in case of the Tangent portfolio, it is optimized again.
Margin rebalancing, as far as the research was done, it is not covered in the
existing literature. Taking threshold rebalancing as an anchor, the asset’s weights are not the ones that are allowed to drift but the portfolio cumulative value itself. This method considers the advantage of calendar rebalancing – no need for constant monitoring – and the advantage of threshold rebalancing
–letting the portfolio “breathe” and only be rebalanced when its allowed drift
limit is hit.
For this strategy are considered annually and semiannually 10%,15% and 20% portfolio value drifts.
To assess the return of the portfolios it is computed the cumulative returns and then they are annualized. The portfolio risk is obtained using the following formula:
𝜎𝑝 = √∑ 𝑥𝑖2𝜎𝑖2 + ∑ ∑𝑁𝑗=1𝑥𝑖 𝑖≠𝑗 𝑥𝑗𝜎𝑖,𝑗 𝑁
𝑖=1 𝑁
𝑖=1 (2)
Where 𝑥𝑖 and 𝑥𝑗 are the weights for the assets, 𝜎𝑖 are the respective return’s risk and the
𝜎𝑖,𝑗 is the covariance between returns.
3.2.3 Performance analysis
The portfolio’s performance in each strategy is evaluated using a risk
12
of return per unit of risk. Thus, the use of Sharpe Ratio comes from the papers analyzed and its consistency in usage to assess how portfolios worked (Dayanandan and Lam, 2015) The risk-free rate used is the euro area 10-year bond yield, since according to Damodaran (1999), in order to be a risk-free asset, there can be no default risk nor reinvestment risk and if the analysis remains on a long term basis, the rate should be the long term government bond rate (Almadi et al. 2004). Also because the euro area 10-year bond yield reflects all the triple A rated sovereign bonds from the euro-area. The 10-year period is due to the time length of this study.
It is also mentioned the transactions involved and the best strategies for cases adapted to the three types of risk profile of an investor: (i) averse if aims to minimize the portfolio’s risk; (ii) neutral if does not care about risk, only return; (iii) lover if the goal
is to maximize portfolio’s risk.
13
4.
Results
In this chapter are presented the results obtained according to the methodology used and explained before.
First it is presented the results for the passive strategy, i.e buy-and-hold strategy. Afterwards are presented the two conventional rebalancing strategies, i.e, calendar and threshold rebalancing and then the developed strategy called margin rebalancing.
Second, the number of transactions involved to have an idea of how much trade portfolios had and to enhance the importance of considering costs when choosing a rebalancing strategy.
Third, we do a performance analysis of portfolios recurring to a risk adjusted measure that is Sharpe Ratio and also to historical VaR in order to address an estimate of investment loss.
4.1 Buy-and-Hold Strategy
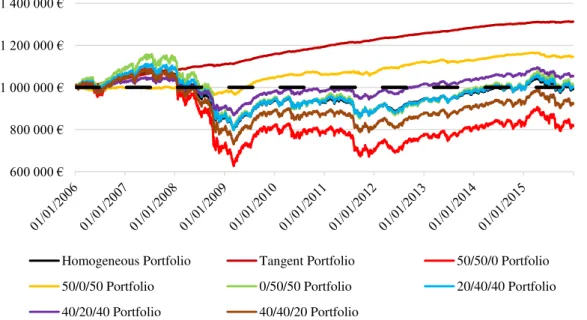
Figure I - Cumulative performance of the Buy-and-Hold strategy 2006 - 2015
600 000 € 800 000 € 1 000 000 € 1 200 000 € 1 400 000 €
Homogeneous Portfolio Tangent Portfolio 50/50/0 Portfolio
50/0/50 Portfolio 0/50/50 Portfolio 20/40/40 Portfolio
14
Figure I shows the performance in terms of value of the portfolios that are object of study. It can be seen that there are two separate crucial periods – pre and post 2007 subprime crisis. All portfolios are generating cash during the first three years of analysis,
especially portfolios that are highly exposed to the stock part. Euro Stoxx 50 at the beginning of 2008 had increased approximately 43%, leaving portfolios composed in part by stocks to be the ones with higher cumulative value in this period. As noticed in the figure, 40/20/40 and 50/0/50 portfolio are the ones with lower cumulative value. After the 2008 crash, all portfolios lost value except the Tangent, since in the beginning it was composed by 0.73% Corporate Bonds, 3.97% Stocks and 95.3% risk free asset. Thus, this results in the inversion of the results previously said, as portfolios with low exposure to stock had been able to recover, instead of portfolios highly exposed to stocks.
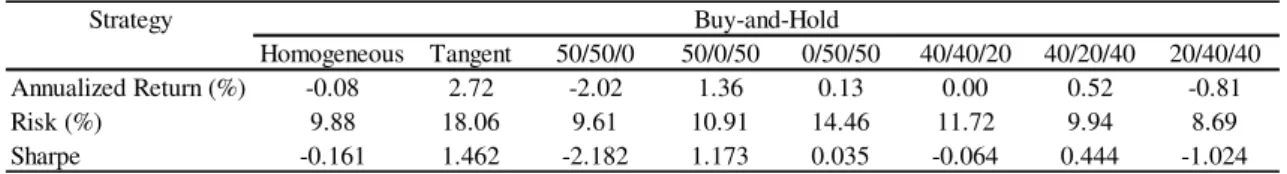
Table II - Results of the Buy-and-Hold Strategy – 2006 – 2015
Table II shows the results for the passive strategy and complements the Figure I. At the end of 2015, half of the portfolios had a better performance when compared to the risk free asset as the Tangent performed better, yet with higher risk.
4.2 Rebalancing Strategies
Here are presented the results of rebalancing the several portfolios studied. The sub points correspond to each rebalancing strategy analyzed.
Strategy
Homogeneous Tangent 50/50/0 50/0/50 0/50/50 40/40/20 40/20/40 20/40/40 Annualized Return (%) -0.08 2.72 -2.02 1.36 0.13 0.00 0.52 -0.81
Risk (%) 9.88 18.06 9.61 10.91 14.46 11.72 9.94 8.69
15 4.2.1 Calendar Rebalancing
Calendar rebalancing consists in a fixed periodic revision and re-allocation of the
assets that the portfolio consists of. Any period could be considered for this strategy and from daily to annually, the point is that at that specific time, one rebalances, regardless of
how the portfolio’s allocation has drifted.
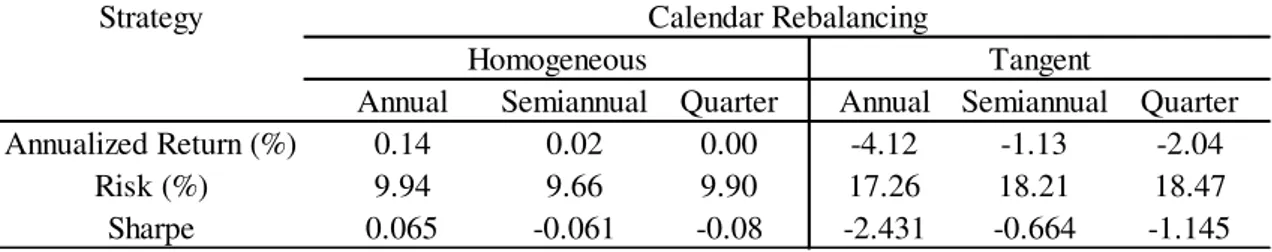
Table III compares results for the Tangent and Homogeneous portfolios during the investment period and shows that the Homogeneous generated on average positive returns but when it comes to its performance, only when rebalanced annually it was positive. Nevertheless, compared with the buy-and-hold strategy (Table II), whatever it is the time period considered, rebalance has increased portfolio’s performance and return.
Table III - Results of the Calendar Rebalancing Strategy - 2006 - 2015
However, the Tangent portfolio surprisingly had a worse performance. This can be explained by the composition of the Tangent portfolios at each time it was rebalanced. Every year, semester and quarter, was calculated the optimum asset allocation and after 2008, the optimum allocation was investing 100% in the risk free asset (Appendix A) . As the portfolio value had been lost due to the exposition to stocks, the recovery was slow.
Thus, if one considers the Homogeneous portfolio to invest in this period, rebalancing becomes a good decision in what concerns portfolio management, instead of
Strategy
Annual Semiannual Quarter Annual Semiannual Quarter
Annualized Return (%) 0.14 0.02 0.00 -4.12 -1.13 -2.04
Risk (%) 9.94 9.66 9.90 17.26 18.21 18.47
Sharpe 0.065 -0.061 -0.08 -2.431 -0.664 -1.145
Homogeneous Tangent
16
the Tangent portfolio, which strategy at this point should be buy-and-hold, or in other words, the passive strategy.
4.2.2 Threshold Rebalancing
17
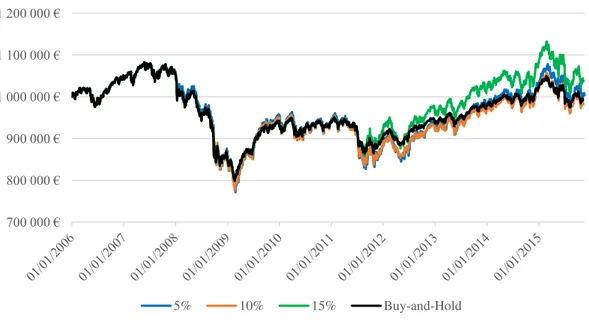
Figure II - Cumulative performance of the Threshold strategy for the Homogeneous portfolio 2006 – 2015
In what concerns the Tangent portfolio, its composition did not allow the portfolio to be rebalanced, so its performance was the same as the passive strategy. Furthermore, portfolios exposed to the stock part were rebalanced more often and, from Table IV, those portfolios had a worse performance when comparing their annualized returns with portfolios which have a low or zero exposure to stocks.
Table IV - Results of the Threshold Rebalancing Strategy - 2006 – 2015
When considering a threshold rebalancing strategy, the investor must be aware that it requires daily monitoring, which investors can either perform themselves or pay an advisor to do for them (Jaconetti et al. 2010).
700 000 € 800 000 € 900 000 € 1 000 000 € 1 100 000 € 1 200 000 €
5% 10% 15% Buy-and-Hold
Risk (%) 9.56 18.06 11.19 10.00 14.69 11.65 8.86 10.05 Sharpe -0.038 1.462 -1.628 1.209 0.098 -0.018 0.460 -0.728
Risk (%) 9.64 18.06 11.84 10.91 14.43 11.51 8.76 9.86 Sharpe -0.261 1.462 -1.701 1.173 0.462 0.157 0.435 -0.919
Risk (%) 9.64 18.06 11.84 10.91 14.43 11.51 8.76 9.86 Sharpe 0.274 1.462 -1.254 1.173 -0.016 0.129 0.444 -0.448
0.04 0.04 0.04 0.04 1.36
-0.18 2.72 -1.94
0.37 2.72 0.04 0.04
0/50/50 40/40/20 40/20/40 20/40/40
0.04 2.72 -1.74 1.29 0.22 0.06 0.48 -0.65 Portfolios Homogeneous Tangent 50/50/0 50/0/50
18 4.2.3 Margin Rebalancing
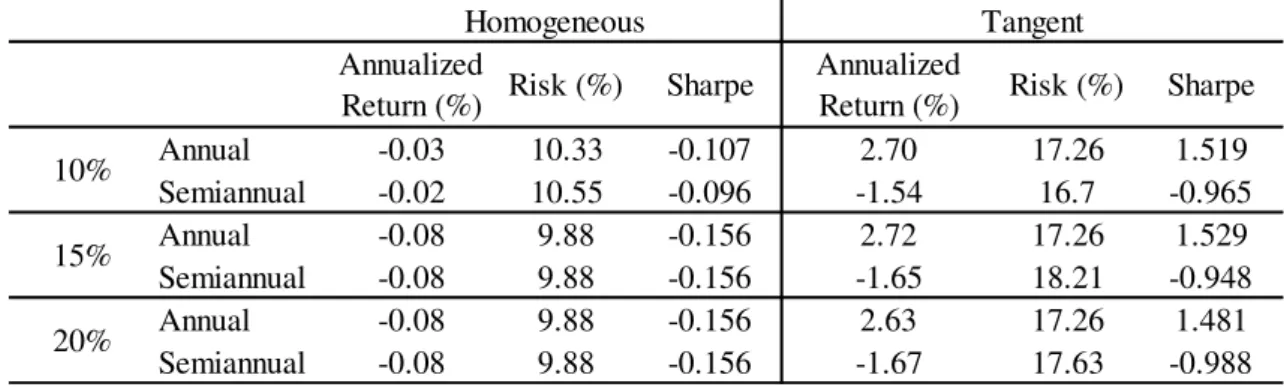
After considering the results of Calendar and Threshold Rebalancing, curiosity might tell why portfolios cannot be rebalanced according to its cumulative value. Considering the advantage of calendar rebalancing in a lack of need of monitoring the portfolio on a daily basis (except a daily rebalance policy) and the advantage of threshold rebalancing of letting the portfolio “breathe” and be rebalanced only when it hits the drift limit, the margin rebalancing gathers this two advantages and applies it to portfolio rebalancing. Like a margin call, when the portfolio has hit a predetermined threshold or drift limit on its total value in a specific and predetermined time period, it is rebalanced.5 Considering the annual margin rebalancing, according to Tables II and V, a 10% margin to the portfolio value improved the performance of both Homogeneous and Tangent portfolio. Comparing its annualized returns, this rebalance strategy had a positive effect on the behavior of the portfolio, allowing it to capture market movements but also restraining its losses. However, if it is considered a semiannual margin rebalancing, although the Homogeneous performs better, its annualized return stills negative. A 15% and a 20% drift limit had the same performance as the passive strategy since the
portfolio’s value did not hit the threshold imposed.
19
Table V - Results of the Margin Rebalancing Strategy for Homogeneous and Tangent Portfolios - 2006 – 2015
Moreover, the Tangent portfolio, unlike the threshold rebalancing, had rebalance moments. As the drift is imposed to the value of the whole portfolio, the need of rebalance occurs because its value had increased more than 10% at the moment it needed to rebalance if the annual margin rebalancing is considered. Since the composition of the Tangent portfolios computed, as shown in Appendix B, in general the behavior of the portfolio was to grow. If it is considered the semiannual margin rebalancing, then due to the primary composition of the Tangent Portfolio, the exposure to stocks allowed the portfolio to lose value and, at the moment it was rebalanced, the composition of the portfolio didn´t allow the portfolio to recover its lost value.
In general, margin rebalancing led the portfolios to improve their performances, especially those which had been highly exposed to stocks, concluding that despite the increase in the portfolio’s volatility, the ability to achieve higher returns turn this strategy,
in overall, to be a successful when it comes to portfolio rebalancing.
4.3 Transactions involved
Considering the results previously shown, it is relevant to highlight the transactions involved in the rebalancing strategies. Even though the transaction costs are not considered by assumption, their impact would be substantial. calendar rebalancing,
Annual -0.03 10.33 -0.107 2.70 17.26 1.519
Semiannual -0.02 10.55 -0.096 -1.54 16.7 -0.965
Annual -0.08 9.88 -0.156 2.72 17.26 1.529
Semiannual -0.08 9.88 -0.156 -1.65 18.21 -0.948
Annual -0.08 9.88 -0.156 2.63 17.26 1.481
Semiannual -0.08 9.88 -0.156 -1.67 17.63 -0.988
20% 15% 10%
Homogeneous Tangent
Annualized
Return (%) Risk (%) Sharpe Annualized
20
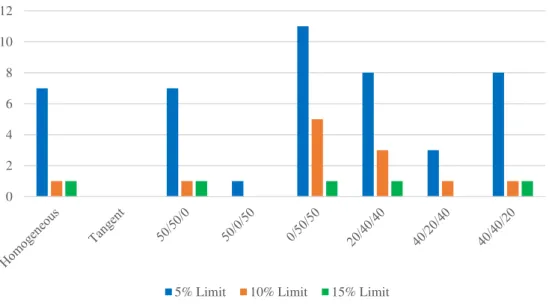
by its definition implies a defined number of transactions. So, there are 9, 19 and 39 transactions in annual, semiannual and quarter rebalance, all equal in each strategy. In what concerns to threshold rebalancing, according to Figure III, the number of transactions seems to be related to the threshold limit, as well as to the exposure to the stock market. Due to the composition of the Tangent portfolio at 2006, it will never hit the 5% limit, so there is no rebalance for 5, 10 and 15%. The number of transactions involved was influenced by the 2008´s subprime crisis, especially for the 0/50/50 portfolio, where rebalancing occurred more frequently because of the limit imposed.
Figure III - Number of transactions involved in Threshold Rebalancing
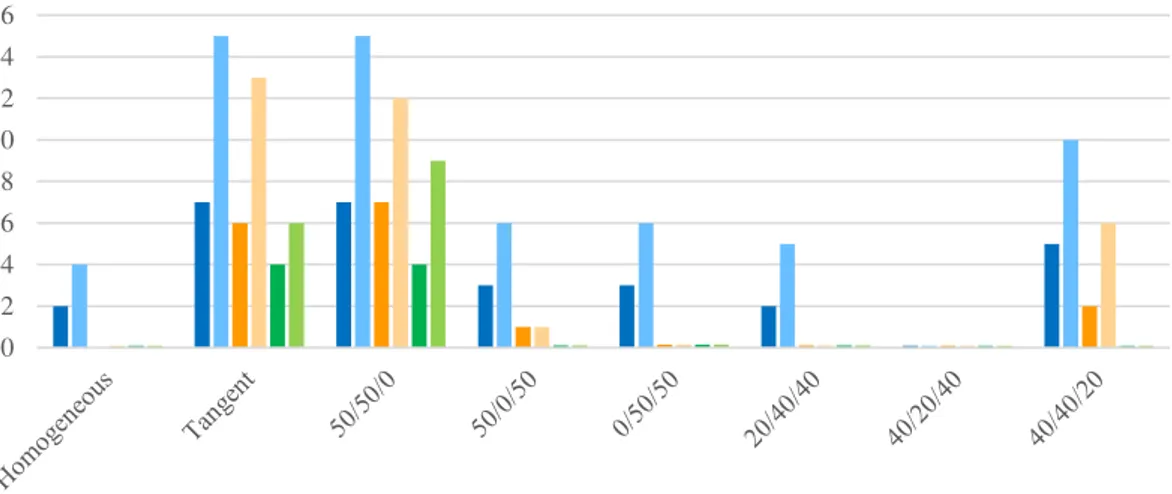
In addition, margin rebalancing, which strategy relies on the rebalance of a portfolio when its value hits the upper or lower limit imposed at a specific time period, follows the same conclusions as threshold rebalancing, excluding the Tangent portfolio, as shown in Figure IV. Lower limits imposed make portfolios more susceptible to rebalance, as well as shorter periods to consider, as semiannual margin rebalances occur more than annual ones. Tangent portfolios are rebalanced under this strategy since the focus is not in individual weights but in the portfolio value in general.
0 2 4 6 8 10 12
21
Figure IV - Number of transactions involved in Margin Rebalancing
Thus, if one considers the costs of rebalancing, strategies which considers shorter periods to rebalance or are susceptible to risky asset classes tend to be less profitable. It will depend on the costs assumed to rebalance, either fixed or floating costs and bigger the investment, bigger the costs that might be associated.
4.4 Performance evaluation
Even though one of the assumptions for this project was that the risk tolerance was not changeable overtime, it is interesting to analyze which strategy fits the interest of the investor.
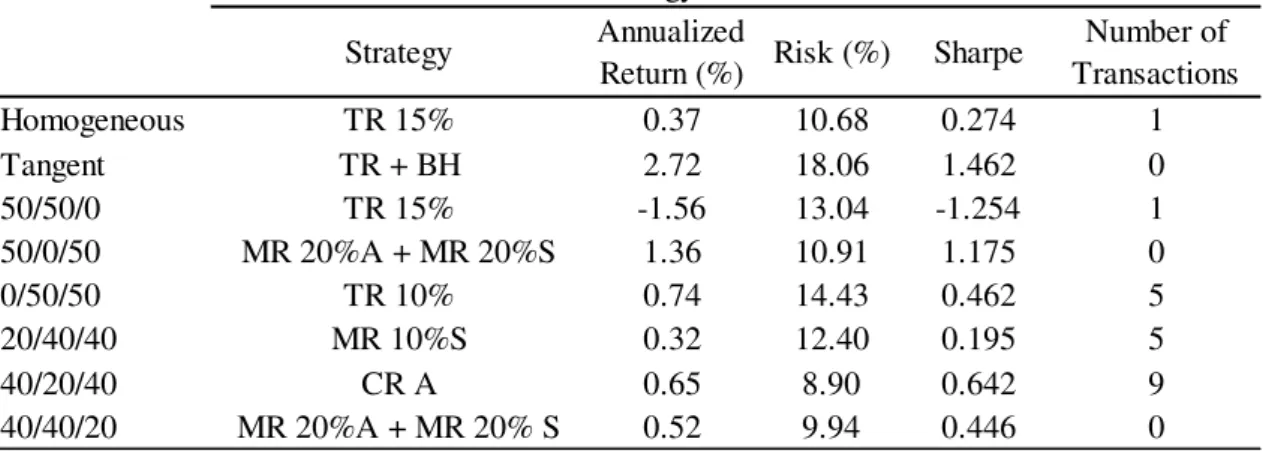
If the investor is risk averse, he will choose the portfolio which minimizes risk. Table VI shows the set of strategies that minimize risk for each portfolio composition studied. The best strategy is the buy-and-hold strategy for a portfolio composed by 40% corporate bonds, 40% stocks and 20% risk free asset even though the annualized return is negative. For instance, if we consider the lowest risk which provides a positive annualized return, the best strategy would be the semiannual margin rebalancing, which gives a 0.56% annualized return, despite of 19 rebalances needed.
0 2 4 6 8 10 12 14 16
22
Table VI - Best Strategies for Risk Averse Investors
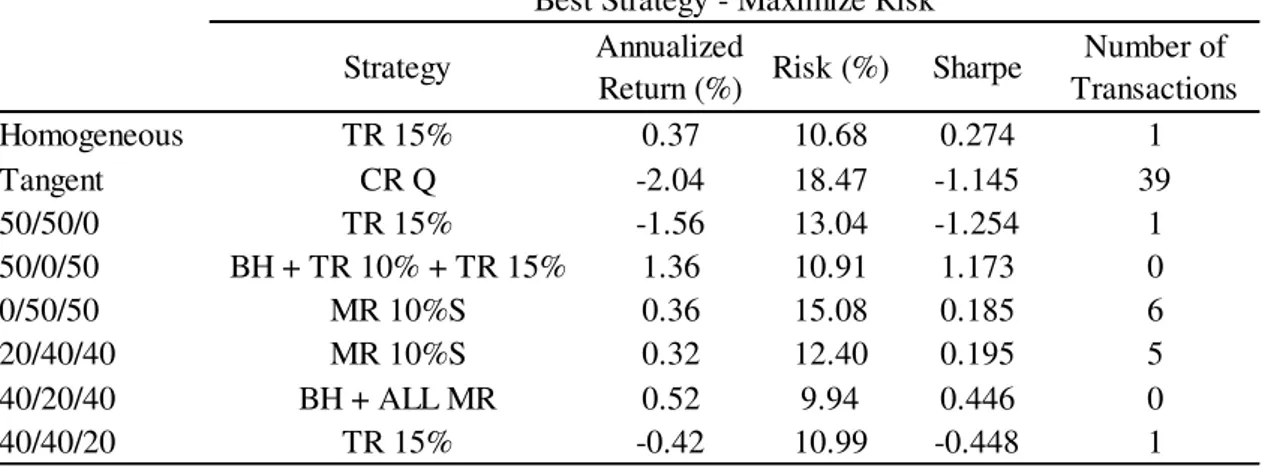
Table VII refers to risk neutral investors, whose concern about risk is null, letting their beliefs for the highest return portfolio. The portfolio and strategy that turns this objective attainable is the Tangent portfolio, under the passive strategy or the threshold rebalancing (as referred before, since the portfolio initial composition is highly composed
by risk free asset, the threshold limits needed to rebalance are not attained).
Table VII - Best Strategies for Risk Neutral Investors
Finally, Table VIII aims at portfolio strategies that maximize risk – risk seeker investors who are willing to accept more risk if it gives more return – and as it can be seen, the Tangent portfolio gives the highest risk, 18.47%, if it is rebalanced every quarter. Although it gives the highest risk opportunity, if he restricts this choice to a
Homogeneous TR 5% 0.04 9.56 -0.038 7
Tangent MR 10%S -1.54 16.70 -0.965 15
50/50/0 BH -2.02 9.61 -2.182 0
50/0/50 CR Q 1.25 9.36 1.252 39
0/50/50 TR 10% 0.74 14.43 0.462 0
20/40/40 TR 10% 0.26 11.51 0.157 5
40/20/40 CR S 0.56 8.75 0.553 19
40/40/20 BH -0.81 8.69 -1.024 0
Best Strategy - Minimize Risk
Strategy Annualized
Return (%) Risk (%) Sharpe
Number of Transactions
Homogeneous TR 15% 0.37 10.68 0.274 1
Tangent TR + BH 2.72 18.06 1.462 0
50/50/0 TR 15% -1.56 13.04 -1.254 1
50/0/50 MR 20%A + MR 20%S 1.36 10.91 1.175 0
0/50/50 TR 10% 0.74 14.43 0.462 5
20/40/40 MR 10%S 0.32 12.40 0.195 5
40/20/40 CR A 0.65 8.90 0.642 9
40/40/20 MR 20%A + MR 20% S 0.52 9.94 0.446 0
Best Strategy - Maximize Return
Number of Transactions Sharpe
Risk (%) Annualized
23
positive return, then the 0/50/50 portfolio is the one to be chosen, which rebalancing strategy passes by rebalancing every semester if the portfolio value hits plus or minus 10% from its original value.
Table VIII - Best Strategies for Risk Seeker Investors
Concluding, as we consider those three risk profiles, it is difficult to choose a strategy that stands. If the Homogeneous portfolio is taken into account, then the portfolio
should be rebalanced according to individual asset’s drift limits – threshold rebalancing
– and if the Tangent portfolio is considered, depends on the risk profile of the investor to choose which strategy fits better.
Nevertheless, considering the number of transactions might be an aid when it comes to the rebalancing strategy. If costs were considered and given high importance, calendar rebalancing might not be considered as the preferable strategy if its return is not
worth it.
It is also interesting to address the question of how much loss could result the chosen strategy and for that point, it is computed the historical VaR. This measure turns out to be widely considered among financial investments for risk management purposes. Historical VaR results from sorting the daily returns of the portfolio across all the period of study and we can see through Table IX that, in overall, the Tangent portfolio experiences a lower VaR for both 5% and 10% significance level. This means that for
Homogeneous TR 15% 0.37 10.68 0.274 1
Tangent CR Q -2.04 18.47 -1.145 39
50/50/0 TR 15% -1.56 13.04 -1.254 1
50/0/50 BH + TR 10% + TR 15% 1.36 10.91 1.173 0
0/50/50 MR 10%S 0.36 15.08 0.185 6
20/40/40 MR 10%S 0.32 12.40 0.195 5
40/20/40 BH + ALL MR 0.52 9.94 0.446 0
40/40/20 TR 15% -0.42 10.99 -0.448 1
Best Strategy - Maximize Risk
Strategy Annualized
Return (%) Risk (%) Sharpe
24
those significance levels, the Tangent portfolio seems to expect lower daily losses. We can also see that for the Homogeneous portfolio, rebalancing does not have a positive effect on VaR for the two conventional strategies. If one considers the 95% confidence interval, the effect of margin rebalancing on the Homogeneous portfolio has led it to a decrease in its VaR. With the buy-and-hold strategy, under a 5% confidence level, the expected worst daily loss will not exceed 0.615%, rather than the annual and semiannual margin rebalancing for 15% and 20%, which value decreases for 0.585%. Given this results, it seems that portfolio rebalancing may decrease its VaR. Nevertheless, one should consider the implications of this measure into conclusions, as it is simply a non-parametric measure and assumes the past will repeat itself.
Table IX - Historical VaR's from 2005 until 2015 for a 95% and 90% confidence level
4.5 Comparison with previous studies
Taking into consideration the results obtained from this study it is possible to compare results with previous studies. Although those are addressed to the U.S.A market, the results from the strategies are the ones which deserves comparison.
Strategy Homogeneous Tangent Homogeneous Tangent
Buy-and-hold -0.615 -0.415 -0.048 -0.030
-0.733 -0.515 -0.558 -0.042
-0.758 -0.518 -1.221 -0.488
-0.773 -0.522 -1.156 -0.410
-0.811 -0.572 -0.048 -0.030
-0.747 -0.528 -0.048 -0.030
-0.765 -0.528 -0.048 -0.030
Annual -0.782 -0.545 -0.029 -0.006
Semiannual -0.786 -0.557 -0.778 -0.351
Annual -0.585 -0.408 -0.035 -0.014
Semiannual -0.585 -0.408 -0.950 -0.436
Annual -0.585 -0.408 -0.042 -0.022
Semiannual -0.585 -0.408 -0.950 -0.436
Calendar Rebalancing
95% Confidence level
Historical VaR (%)
Annual Semiannual
Quarter
90% Confidence level
25
In their study, Arnott and Lovell (1993) concluded that rebalancing enhances both average return and performance, being calendar rebalancing the strategy that improves the most the portfolio in comparison with the passive strategy.
A more recent study conducted by Dayanandan and Lam (2015) show that even though in some cases the return is not bigger when considering rebalancing versus the
passive strategy, in most cases it improved the portfolio’s performance6 as the risk
associated after rebalancing was considerably lower.
The presented results seem to be in line with those mentioned above. However, these results are more visible for a 40/20/40 portfolio, as with calendar and threshold rebalancing its annualized return, risk and performance has improved. Yet, it is not clear
that a portfolio rebalancing strategy will enhance the portfolio management since the results take into consideration historical periods with high volatility in financial markets.
26
5. Conclusions, Limitations and Future research topics
Every investor is different, and the results of any rebalancing method will depend in large part on those differences (Smith Barney 2003). Every rebalancing strategy will depend not only in the fluctuation of the assets included in the portfolio but also in the willingness of the investor to seek for risk. One thing that is common among the existing studies about portfolio rebalancing is that it provides an opportunity to control its volatility and stabilize its performance. The results obtained show that it is possible to reduce risk by rebalancing, providing a “shield force” against abrupt market movements,
like the subprime crisis in 2007 whose effects were reflected in the stock market in 2008. However, the decision on the best way to rebalance a portfolio is more difficult to obtain consensus. According with the results obtained, it may depend on the investor’s risk tolerance to decide whether a calendar or a threshold strategy. For instance, if one considers the 40/20/40 strategy, if an investor were risk averse, he would prefer a semiannual calendar rebalancing strategy but, on the contrary, if he was risk seeker, he
would prefer the passive strategy or any of the Margin rebalancing strategies presented before.
The results presented do not answer clearly to the starting question - How and how frequently should portfolios be rebalanced? – but show that rebalancing may enhance
portfolio’s performance as well as its returns. This conclusion should be taken carefully
since it is not considering the impact of transaction costs or taxes. If they were considered, as Figures III and IV show, some rebalancing strategies might be worthless comparing with the Buy-and-hold strategy, as the cost associated would be high enough that investors would see those opportunities as a bad investment strategy.
27
time period analysis, which had its impact as the study is aimed at an European level and the existing data concerning the European triple-A bond rates given by the European Central Bank led this analysis to a simple 10-year period; and the inability to do Short selling and study its effects on rebalancing was also a restriction.
For further research it is recommended to study the effects of rebalancing on portfolios composed by specific assets, as this study was limited to consider indexes as proxy for the asset classes. It would be also interesting develop this topic by considering costs as part of portfolio rebalancing. As it is shown in this study, rebalancing needs transactions and this means additional costs, especially when considering a calendar rebalancing strategy.
28
6. References
Almadi, H., David, R., & Anil , S. (Summer 2014). Return Predictability and Dynamic Asset Allocation: How Often Should Investors Rebalance? Journal of Portfolio Management, 40(4), 16-27.
Arnott, R., & Lovell, R. (1989). Monitoring and Rebalancing the Potfolio. First Quadrant Corporation(2), 1-12.
Arnott, R., & Lovell, R. (1993). Rebalancing: Why? When? How often? The Journal of Investing, 5-10.
Bearce, J., & Overway, C. (2015). Rebalancing Multi-asset portfolios.
Beebower, G., Brinson, G., & Hood, R. (1986). Determinants of Portfolio Performance. Financial Analysts Journal, 44(2), 39-44.
Beebower, G., Singer, B., & Brinson, G. (1991). Determinants of Portfolio Performance II: An Update. Financial Analysts Journal, 47(3), 40-48.
Damodaran, A. (1999). Estimating Risk Free Rates. Stern School of Business, New York.
Dayanandan, A., & Minh, L. (2015). Portfolio Rebalancing - Hype or Hope? The Journal of Business Inquiry , 14(2), 79-92.
Duarte, L. (2012). Gestão Ativa e Desempenho de Fundos de Ações Portugueses. Universidade de Lisboa - Lisbon School of Business and Economics, Lisbon. Fama, E., & French, K. (2010). Luck versus Skill in the Cross-Section of Mutual Fund
Returns. The Journal of Finance, 65(5), 1915-47.
Félix, J. (2011). Potenciais vantagens da gestão activa de uma carteira constituída pelo Índice CAC-40. Universidade Técnica de Lisboa - Instituto Superior de
29
Greenhill, T. (2014). Active vs. Passive Portfolio Management. Senior Capstone Project.
Jaconetti, C., Kinniry Jr., F., & Zilbering, Y. (2010). Best practices for portfolio rebalancing. Vanguard.
Lee, M. (2008). Rebalancing and Returns. Dimensional Fund Advisors.
Markowitz, H. (1952). Portfolio Selection. The Journal of Finance, 7(1), 77-91.
Markowitz, H. (1991). Foundations of Portfolio Theory. Journal of Finance, 46(2), 469-477.
Monteiro, P. (2011). Comparação entre a gestão ativa e passiva de uma carteira de ações com base no IBEX 35. Universidade Técnica de Lisboa - Instituto
Superior de Economia e Gestão, Lisboa, Portugal.
Perold, A., & Sharpe, W. (1995). Dynamic Strategies for Asset Allocation. Financial Analysts Journal, 149-160.
Smith Barney. (2003). The Art of Rebalancing - How to Tell When Your Portfolio Needs a Tune-up.
30
7. Appendix
Appendix A
–
Composition of the Tangent Portfolio
Figure V - Tangent Portfolio Compositions
(a) Annual rebalance
(b) Semiannual rebalance 0,00%
20,00% 40,00% 60,00% 80,00% 100,00%
2006 2007 2008 2009 2010 2011 2012 2013 2014 2015
IBOXX EURO CORPORATE EURO STOXX 50 EURO AREA 10Y YIELD
0,00% 20,00% 40,00% 60,00% 80,00% 100,00%
31
(c) Quarterly rebalance
0% 10% 20% 30% 40% 50% 60% 70% 80% 90% 100%
2006
- Q12006- Q32007- Q12007- Q32008- Q12008- Q32009- Q12009- Q32010- Q12010- Q32011- Q12011- Q32012- Q12012- Q32013- Q12013- Q32014- Q12014- Q32015- Q12015- Q3
32
Appendix B – Annualized Return, Risk and Sharpe of the portfolios analyzed
Table X - Portfolio's Annualized Return, Risk and Sharpe for each strategy - 2006-2015
Annual Semiannual Annual Semiannual Annual Semiannual
Return (%) -0.08 0.14 0.02 0.00 0.04 -0.18 0.37 -0.03 -0.02 -0.08 -0.08 -0.08 -0.08
Risk (%) 9.88 9.94 9.66 9.90 9.56 9.64 9.64 10.33 10.55 9.88 9.88 9.88 9.88
Sharpe -0.161 0.065 -0.061 -0.080 -0.038 -0.261 0.274 -0.107 -0.096 -0.156 -0.156 -0.156 -0.156
Return (%) 2.72 -4.12 -1.13 -2.04 2.72 2.72 2.72 2.70 -1.54 2.72 -1.65 2.63 -1.67
Risk (%) 18.06 17.26 18.21 18.47 18.06 18.06 18.06 17.26 16.70 17.26 18.21 17.26 17.63
Sharpe 1.462 -2.431 -0.664 -1.145 1.462 1.462 1.462 1.519 -0.965 1.529 -0.948 1.481 -0.988
Return (%) -2.02 -1.59 -1.69 -1.71 -1.74 -1.94 -1.56 -1.94 -1.80 -1.94 -1.84 -1.96 -1.91
Risk (%) 9.61 11.66 11.07 11.62 11.19 11.84 11.84 11.66 11.07 11.66 11.66 12.32 0.00
Sharpe -2.182 -1.431 -1.592 -1.539 -1.628 -1.701 -1.254 -1.733 -1.698 -1.733 -1.648 -1.653 -1.613
Return (%) 1.36 1.28 1.25 1.25 1.29 1.36 1.36 1.32 1.32 1.33 1.33 1.36 1.36
Risk (%) 10.91 9.57 9.42 9.36 10.00 10.91 10.91 9.57 9.42 9.57 9.57 10.91 10.91
Sharpe 1.173 1.260 1.249 1.252 1.209 1.173 1.173 1.304 1.323 1.306 1.306 1.175 1.175
Return (%) 0.13 0.35 0.15 0.13 0.22 0.74 0.05 0.34 0.36 0.13 0.13 0.13 0.13
Risk (%) 14.46 14.62 14.53 14.69 14.69 14.43 14.43 14.98 15.08 14.46 14.46 14.46 14.46
Sharpe 0.035 0.185 0.053 0.038 0.098 0.462 -0.016 0.176 0.185 0.035 0.035 0.035 0.035
Return (%) 0.00 0.23 0.08 0.06 0.06 0.26 0.23 0.05 0.32 0.00 0.00 0.00 0.00
Risk (%) 11.72 11.82 11.58 11.81 11.65 11.51 11.51 12.21 12.40 11.72 11.72 11.72 11.72
Sharpe -0.064 0.132 0.004 -0.014 -0.018 0.157 0.129 -0.024 0.195 -0.063 -0.063 -0.063 -0.063
Return (%) 0.52 0.65 0.56 0.55 0.48 0.46 0.52 0.52 0.52 0.52 0.52 0.52 0.52
Risk (%) 9.94 8.90 8.75 8.77 8.86 8.76 8.76 9.94 9.94 9.94 9.94 9.94 9.94
Sharpe 0.444 0.642 0.553 0.535 0.460 0.435 0.444 0.446 0.446 0.446 0.446 0.446 0.446
Return (%) -0.81 -0.52 -0.64 -0.67 -0.65 -0.83 -0.42 0.52 0.52 0.52 0.52 0.52 0.52
Risk (%) 8.69 10.02 9.58 10.03 10.05 9.86 9.86 9.94 9.94 9.94 9.94 9.94 9.94
Sharpe -1.024 -0.595 -0.751 -0.741 -0.728 -0.919 -0.448 0.446 0.446 0.446 0.446 0.446 0.446
40/40/20
15% 20%
Homogeneous
Tangent
50/50/0
Strategy Threshold Rebalancing Margin Rebalancing
Annual Semiannual Quarter
5% Limit 10% Limit 15% Limit 10% Buy-and-Hold Calendar Rebalancing
50/0/50
0/50/50
20/40/40
33
Appendix C – Descriptive Statistics of the portfolios analyzed
Table XI - Descriptive Statistics of the composition of the portfolio for the Buy-and-Hold Strategy
Table XII - Descriptive Statistics of the composition of the portfolio for the Annual Calendar Rebalancing Strategy
Mean (%) 32.17 0.58 55.79 43.64 0 19.18 36.98 40.75 Median (%) 32.45 0.55 57.88 42.53 0 19.37 36.91 41.55 Minimum (%) 28.32 0.51 42.42 40.59 0 16.49 34.94 34.05 Maximum (%) 34.56 0.73 66.41 50.04 0 20.89 40.01 45.46 Standard Deviation (%) 1.39 0.05 6.22 2.30 0 0.98 0.86 2.75 Mean (%) 26.01 2.61 44.21 0 38.21 30.94 15.08 32.69 Median (%) 23.70 2.20 42.12 0 35.16 28.31 13.44 30.32 Minimum (%) 17.48 1.49 33.59 0 26.72 21.14 9.58 23.00 Maximum (%) 38.69 4.68 57.58 0 54.27 45.13 23.98 46.28 Standard Deviation (%) 5.93 0.94 6.22 0 7.98 6.81 4.04 6.36 Mean (%) 41.82 96.81 0 56.36 61.79 49.88 47.94 26.55 Median (%) 43.73 97.25 0 57.47 64.84 52.24 49.75 27.99 Minimum (%) 32.55 94.68 0 49.96 45.73 38.03 39.76 19.44 Maximum (%) 48.30 97.97 0 59.41 73.28 58.04 53.20 31.84 Standard Deviation (%) 4.80 0.98 0 2.30 7.98 6.01 4.03 3.74 EUROSTOXX
50
EURO AREA 10Y YIELD
Buy-and-Hold
Portfolio Homogeneous Tangent 50/50/0 50/0/50 0/50/50 20/40/40 40/20/40 40/40/20
IBOXX CORPORATE
BOND
Mean (%) 33.40 1.14 50.62 49.65 0 20.06 39.92 40.24 Median (%) 33.46 0.00 49.93 49.75 0 20.09 40.13 40.05 Minimum (%) 30.50 0.00 45.44 46.15 0 17.99 37.28 36.55 Maximum (%) 37.59 7.24 66.23 51.75 0 23.15 41.86 47.96 Standard Deviation (%) 1.32 2.24 3.30 1.04 0 0.95 1.03 1.94 Mean (%) 32.69 14.86 49.38 0 49.03 39.23 19.58 39.33 Median (%) 33.44 0.00 50.07 0 50.06 40.14 20.08 40.11 Minimum (%) 19.16 0.00 33.77 0 30.71 23.60 10.60 24.45 Maximum (%) 37.60 100.00 54.56 0 54.74 44.58 23.15 44.52 Standard Deviation (%) 2.93 31.26 3.30 0 3.68 3.28 2.03 3.18 Mean (%) 33.90 84.00 0 50.35 50.97 40.72 40.51 20.43 Median (%) 33.41 99.67 0 50.25 49.94 40.05 40.16 20.05 Minimum (%) 31.08 0.00 0 48.25 45.26 36.86 38.00 18.40 Maximum (%) 43.24 100.00 0 53.85 69.29 53.25 47.83 27.59 Standard Deviation (%) 1.90 30.80 0 1.04 3.68 2.53 1.57 1.42 IBOXX CORPORATE BOND EUROSTOXX 50 EURO AREA 10Y YIELD
Calendar Rebalancing - Annual
34
Table XIII - Descriptive Statistics of the composition of the portfolio for the Semiannual Calendar Rebalancing Strategy
Table XIV - Descriptive Statistics of the composition of the portfolio for the Quarter Calendar Rebalancing Strategy
Mean (%) 33.38 3.19 50.27 49.90 0 20.04 39.99 40.11 Median (%) 33.29 0.00 49.93 49.99 0 19.97 40.00 39.95 Minimum (%) 31.12 0.00 45.44 47.71 0 18.43 38.10 37.08 Maximum (%) 36.80 47.09 60.48 51.13 0 22.55 42.23 45.59 Standard Deviation (%) 1.04 9.90 2.60 0.61 0 0.75 0.74 1.56 Mean (%) 33.09 33.21 49.73 0 49.63 39.71 19.85 39.74 Median (%) 33.38 0.68 50.07 0 50.05 40.05 20.03 40.05 Minimum (%) 23.90 0.00 39.52 0 37.68 29.24 13.57 29.78 Maximum (%) 37.60 100.00 54.56 0 54.74 44.58 23.15 44.52 Standard Deviation (%) 2.38 45.33 2.60 0 2.89 2.63 1.68 2.55 Mean (%) 33.53 63.60 0 50.10 50.37 40.25 40.16 20.15 Median (%) 33.30 98.07 0 50.01 49.95 39.96 40.00 19.98 Minimum (%) 30.80 0.00 0 48.87 45.26 36.68 37.82 18.20 Maximum (%) 39.53 100.00 0 52.29 62.32 48.38 44.89 24.63 Standard Deviation (%) 1.44 46.83 0 0.61 2.89 1.95 1.16 1.05 EURO AREA
10Y YIELD
Calendar Rebalancing - Semiannual
Portfolio Homogeneous Tangent 50/50/0 50/0/50 0/50/50 20/40/40 40/20/40 40/40/20
IBOXX CORPORATE
BOND
EUROSTOXX 50
Mean (%) 33.38 0.51 50.17 49.97 0 20.04 40.02 40.08 Median (%) 33.24 0.00 49.81 50.00 0 19.94 39.96 39.87 Minimum (%) 31.53 0.00 45.97 48.62 0 18.71 38.57 37.40 Maximum (%) 36.80 9.08 58.87 51.46 0 22.55 42.23 45.29 Standard Deviation (%) 0.82 1.89 2.00 0.38 0 0.59 0.57 1.22 Mean (%) 33.20 30.67 49.83 0 49.80 39.84 19.92 39.85 Median (%) 33.48 0.00 50.19 0 50.17 40.16 20.10 40.16 Minimum (%) 25.68 0.00 41.13 0 40.59 31.46 14.73 31.62 Maximum (%) 37.14 100.00 54.03 0 54.72 44.25 22.81 43.96 Standard Deviation (%) 1.81 45.55 2.00 0 2.17 2.00 1.28 1.94 Mean (%) 33.43 68.82 0 50.03 50.20 40.13 40.07 20.07 Median (%) 33.26 99.88 0 50.00 49.83 39.90 39.97 19.95 Minimum (%) 30.73 0.00 0 48.54 45.28 36.62 37.73 18.16 Maximum (%) 37.62 100.00 0 51.38 59.41 46.07 43.17 23.17 Standard Deviation (%) 1.05 45.25 0 0.38 2.17 1.44 0.83 0.76 IBOXX CORPORATE BOND EUROSTOXX 50 EURO AREA 10Y YIELD
Calendar Rebalancing - Quarter
35
Table XV - Descriptive Statistics of the composition of the portfolio for the 5% Threshold Rebalancing Strategy
Table XVI - Descriptive Statistics of the composition of the portfolio for the 10% Threshold Rebalancing Strategy
Mean (%) 32.60 0.59 49.34 47.58 0 19.57 39.69 39.23 Median (%) 32.66 0.55 49.38 47.42 0 19.70 39.93 39.27 Minimum (%) 28.95 0.51 44.88 44.89 0 16.83 34.98 35.28 Maximum (%) 35.76 25.00 55.90 50.21 0 21.75 42.08 43.70 Standard Deviation (%) 0.97 0.48 2.14 0.97 0 0.76 1.45 1.17 Mean (%) 34.59 2.62 50.66 0 51.16 40.51 20.13 41.26 Median (%) 34.84 2.20 50.62 0 51.36 40.36 20.48 41.27 Minimum (%) 27.37 1.49 44.10 0 43.67 34.31 14.74 34.23 Maximum (%) 38.39 25.00 55.12 0 55.23 45.36 23.98 45.26 Standard Deviation (%) 2.00 1.04 2.14 0 1.94 2.09 1.95 1.70 Mean (%) 32.81 96.80 0 52.42 48.84 39.92 40.18 19.50 Median (%) 32.74 97.25 0 52.58 48.64 39.97 40.25 19.51 Minimum (%) 30.02 50.00 0 49.79 44.77 35.75 37.29 17.45 Maximum (%) 38.69 97.97 0 55.11 56.33 44.77 44.30 23.72 Standard Deviation (%) 1.41 1.34 0 0.97 1.94 1.49 1.31 0.94 EURO AREA
10Y YIELD
50/50/0 50/0/50
Portfolio 0/50/50 20/40/40 40/20/40 40/40/20
Threshold Rebalancing - 5% Limit Homogeneous Tangent IBOXX CORPORATE BOND EUROSTOXX 50
Mean (%) 33.58 0.59 48.80 43.64 0 19.38 40.12 39.68 Median (%) 34.16 0.55 48.33 42.53 0 19.20 40.92 39.85 Minimum (%) 28.32 0.51 42.42 40.59 0 16.49 34.94 34.05 Maximum (%) 37.55 25.00 60.08 50.04 0 23.10 43.09 45.20 Standard Deviation (%) 2.22 0.48 3.13 2.30 0 1.55 2.21 2.36 Mean (%) 31.94 2.62 51.20 0 51.15 40.77 19.06 39.85 Median (%) 31.91 2.20 51.67 0 51.45 40.59 19.02 40.16 Minimum (%) 24.48 1.49 39.92 0 38.72 29.86 13.98 29.77 Maximum (%) 38.69 25.00 57.58 0 60.11 50.11 23.98 46.28 Standard Deviation (%) 3.01 1.04 3.13 0 4.07 3.83 2.13 3.02 Mean (%) 34.48 96.80 0 56.36 48.85 39.85 40.82 20.47 Median (%) 34.11 97.25 0 57.47 48.55 39.87 40.58 20.14 Minimum (%) 31.61 50.00 0 49.96 39.89 32.89 37.94 18.12 Maximum (%) 43.59 97.97 0 59.41 61.28 50.42 50.03 28.60 Standard Deviation (%) 1.66 1.34 0 2.30 4.07 2.80 1.64 1.48 IBOXX CORPORATE BOND EUROSTOXX 50 EURO AREA 10Y YIELD 40/40/20 Threshold Rebalancing - 10% Limit
36
Table XVII - Descriptive Statistics of the composition of the portfolio for the 15% Threshold Rebalancing Strategy
Table XVIII - Descriptive Statistics of the composition of the portfolio for the Margin 10% Annual Rebalancing Strategy
Mean (%) 31.32 0.59 49.12 43.64 0 18.90 36.98 37.22 Median (%) 31.65 0.55 47.21 42.53 0 18.88 36.91 36.85 Minimum (%) 28.27 0.51 39.31 40.59 0 16.49 34.94 33.96 Maximum (%) 34.27 25.00 65.18 50.04 0 21.48 40.01 44.03 Standard Deviation (%) 1.45 0.48 6.27 2.30 0 1.00 0.86 1.86 Mean (%) 33.13 2.62 50.88 0 48.90 41.96 15.08 43.69 Median (%) 35.33 2.20 52.79 0 49.42 42.93 13.44 44.60 Minimum (%) 18.31 1.49 34.82 0 34.91 24.50 9.58 24.76 Maximum (%) 43.95 25.00 60.69 0 54.27 47.87 23.98 49.89 Standard Deviation (%) 6.64 1.04 6.27 0 3.19 3.90 4.04 4.04 Mean (%) 35.55 96.80 0 56.36 51.10 39.14 47.94 19.09 Median (%) 33.26 97.25 0 57.47 50.58 38.78 49.75 18.51 Minimum (%) 27.59 50.00 0 49.96 45.73 33.97 39.76 15.79 Maximum (%) 47.64 97.97 0 59.41 65.09 55.48 53.20 31.21 Standard Deviation (%) 5.64 1.34 0 2.30 3.19 3.66 4.03 2.68 EURO AREA
10Y YIELD
Threshold Rebalancing - 15% Limit
Portfolio Homogeneous Tangent 50/50/0 50/0/50 0/50/50 20/40/40 40/20/40 40/40/20
IBOXX CORPORATE
BOND
EUROSTOXX 50
Mean (%) 32.45 1.63 49.50 45.95 0 19.37 36.99 38.82 Median (%) 32.49 0.62 49.52 45.73 0 19.38 36.92 38.83 Minimum (%) 28.29 0.00 42.47 40.60 0 16.46 34.90 34.00 Maximum (%) 36.90 7.24 59.73 50.78 0 22.62 40.01 44.71 Standard Deviation (%) 1.85 2.27 3.09 3.30 0 1.32 0.86 2.31 Mean (%) 34.49 1.17 50.50 0 50.76 41.15 15.08 40.84 Median (%) 34.52 0.00 50.48 0 51.55 41.39 13.45 41.05 Minimum (%) 22.11 0.00 40.27 0 30.71 26.45 9.58 28.55 Maximum (%) 41.67 4.68 57.53 0 59.61 49.05 23.96 47.46 Standard Deviation (%) 3.33 1.82 3.09 0 4.70 3.73 4.04 3.32 Mean (%) 33.07 97.20 0 54.05 49.24 39.48 47.93 20.33 Median (%) 32.80 96.34 0 54.27 48.45 39.17 49.73 19.93 Minimum (%) 28.24 92.76 0 49.22 40.39 33.24 39.76 17.50 Maximum (%) 45.07 100.00 0 59.40 69.29 53.93 53.26 29.10 Standard Deviation (%) 2.72 2.48 0 3.30 4.70 3.28 4.03 1.76
Margin Rebalance - 10% Annual
Portfolio Homogeneous Tangent 50/50/0 50/0/50 0/50/50 20/40/40 40/20/40 40/40/20
37
Table XIX - Descriptive Statistics of the composition of the portfolio for the Margin 10% Semiannual Rebalancing Strategy
Table XX - Descriptive Statistics of the composition of the portfolio for the Margin 15% Annual Rebalancing Strategy
Mean (%) 31.76 12.07 49.28 46.01 0.00 19.36 36.99 38.61 Median (%) 31.89 0.00 49.10 45.73 0.00 19.42 36.92 38.58 Minimum (%) 28.29 0.00 42.47 40.60 0.00 16.71 34.90 34.00 Maximum (%) 35.91 47.06 60.48 50.55 0.00 22.63 40.01 45.29 Standard Deviation (%) 1.64 17.96 3.10 3.35 0.00 1.19 0.86 2.15 Mean (%) 35.40 24.41 50.72 0.00 51.39 41.40 15.08 41.28 Median (%) 35.58 0.19 50.90 0.00 51.99 41.92 13.45 41.57 Minimum (%) 22.11 0.00 39.52 0.00 30.71 22.94 9.58 28.55 Maximum (%) 43.10 100.00 57.53 0.00 60.74 50.42 23.96 47.74 Standard Deviation (%) 3.51 35.06 3.10 0.00 4.96 4.69 4.04 3.30 Mean (%) 32.84 63.52 0.00 53.99 48.61 39.24 47.93 20.11 Median (%) 32.49 95.37 0.00 54.27 48.01 38.74 49.73 19.82 Minimum (%) 27.86 0.00 0.00 49.45 39.26 32.59 39.76 17.08 Maximum (%) 45.07 100.00 0.00 59.40 69.29 54.43 53.26 29.10 Standard Deviation (%) 2.82 46.65 0.00 3.35 4.96 3.67 4.03 1.85
Margin Rebalance - 10% Semiannual
Portfolio Homogeneous Tangent 50/50/0 50/0/50 0/50/50 20/40/40 40/20/40 40/40/20
IBOXX CORPORATE BOND EUROSTOXX 50 EURO AREA 10Y YIELD
Mean (%) 32.20 1.31 49.50 44.40 0 19.18 36.99 38.88 Median (%) 32.49 0.57 49.52 43.32 0 19.38 36.92 39.06 Minimum (%) 28.29 0.00 42.47 40.60 0 16.46 34.90 34.00 Maximum (%) 34.60 7.24 59.73 50.26 0 20.90 40.01 45.44 Standard Deviation (%) 1.39 2.17 3.09 2.82 0 0.98 0.86 2.34 Mean (%) 25.99 1.42 50.50 0.00 38 30.94 15.08 41.28 Median (%) 23.70 0.00 50.48 0 35.16 28.31 13.45 41.23 Minimum (%) 17.47 0.00 40.27 0 26.72 21.14 9.58 28.55 Maximum (%) 38.65 4.68 57.53 0 54.27 45.14 23.96 48.53 Standard Deviation (%) 5.92 1.78 3.09 0 7.98 6.81 4.04 3.50 Mean (%) 41.80 97.27 0.00 55.60 62 49.87 47.93 19.84 Median (%) 43.70 97.03 0 56.68 64.84 52.23 49.73 19.62 Minimum (%) 32.56 92.76 0 49.74 45.73 38.04 39.76 16.44 Maximum (%) 48.35 100.00 0 59.40 73.28 58.07 53.26 29.10 Standard Deviation (%) 4.79 2.43 0 2.82 7.98 6.01 4.03 2.01
Margin Rebalance - 15% Annual
Portfolio Homogeneous Tangent 50/50/0 50/0/50 0/50/50 20/40/40 40/20/40 40/40/20
38
Table XXI - Descriptive Statistics of the composition of the portfolio for the Margin 15% Semiannual Rebalancing Strategy
Table XXII - Descriptive Statistics of the composition of the portfolio for the Margin 20% Annual Rebalancing Strategy
Mean (%) 32.20 14.10 49.10 44.40 0 19.18 36.99 38.26 Median (%) 32.49 0.00 48.92 43.32 0 19.38 36.92 38.22 Minimum (%) 28.29 0.00 42.47 40.60 0 16.46 34.90 34.00 Maximum (%) 34.60 56.37 59.73 50.26 0 20.90 40.01 44.09 Standard Deviation (%) 1.39 19.73 3.04 2.82 0 0.98 0.86 1.86 Mean (%) 25.99 26.91 50.90 0 38 30.94 15.08 41.79 Median (%) 23.70 0.76 51.08 0 35 28.31 13.45 42.28 Minimum (%) 17.47 0.00 40.27 0 27 21.14 9.58 28.55 Maximum (%) 38.65 100.00 57.53 0 54 45.14 23.96 47.74 Standard Deviation (%) 5.92 34.86 3.04 0 8 6.81 4.04 3.04 Mean (%) 41.80 58.99 0 55.60 62 49.87 47.93 19.95 Median (%) 43.70 95.37 0 56.68 65 52.23 49.73 19.58 Minimum (%) 32.56 0.00 0 49.74 46 38.04 39.76 17.08 Maximum (%) 48.35 100.00 0 59.40 73 58.07 53.26 29.10 Standard Deviation (%) 4.79 48.08 0 2.82 8 6.01 4.03 1.90
Margin Rebalance - 15% Semiannual
Portfolio Homogeneous Tangent 50/50/0 50/0/50 0/50/50 20/40/40 40/20/40 40/40/20
IBOXX CORPORATE BOND EUROSTOXX 50 EURO AREA 10Y YIELD
Mean (%) 32.20 1.43 48.64 43.65 0 19.18 36.99 40.76 Median (%) 32.49 0.58 48.75 42.55 0 19.38 36.92 41.57 Minimum (%) 28.29 0.00 42.47 40.60 0 16.46 34.90 34.00 Maximum (%) 34.60 7.24 59.73 50.04 0 20.90 40.01 45.47 Standard Deviation (%) 1.39 2.11 3.32 2.30 0 0.98 0.86 2.75 Mean (%) 25.99 1.84 51.36 0 38 30.94 15.08 32.69 Median (%) 23.70 2.10 51.25 0 35 28.31 13.45 30.31 Minimum (%) 17.47 0.00 40.27 0 27 21.14 9.58 22.99 Maximum (%) 38.65 4.68 57.53 0 54 45.14 23.96 46.25 Standard Deviation (%) 5.92 1.64 3.32 0 8 6.81 4.04 6.36 Mean (%) 41.80 96.73 0 56.35 62 49.87 47.93 26.55 Median (%) 43.70 96.99 0 57.45 65 52.23 49.73 27.97 Minimum (%) 32.56 92.76 0 49.96 46 38.04 39.76 19.45 Maximum (%) 48.35 100.00 0 59.40 73 58.07 53.26 31.89 Standard Deviation (%) 4.79 2.03 0 2.30 8 6.01 4.03 3.74
Margin Rebalance - 20% Annual
Portfolio Homogeneous Tangent 50/50/0 50/0/50 0/50/50 20/40/40 40/20/40 40/40/20
39
Table XXIII - Descriptive Statistics of the composition of the portfolio for the Margin 20% Semiannual Rebalancing
Mean (%) 32.20 15.16 48.20 43.65 0 19.18 36.99 40.76 Median (%) 32.49 4.98 47.93 42.55 0 19.38 36.92 41.57 Minimum (%) 28.29 0.00 42.42 40.60 0 16.46 34.90 34.00 Maximum (%) 34.60 56.37 59.73 50.04 0 20.90 40.01 45.47 Standard Deviation (%) 1.39 19.04 3.22 2.30 0 0.98 0.86 2.75 Mean (%) 25.99 26.80 51.80 0 38 30.94 15.08 32.69 Median (%) 23.70 0.02 52.07 0 35 28.31 13.45 30.31 Minimum (%) 17.47 0.00 40.27 0 27 21.14 9.58 22.99 Maximum (%) 38.65 100.00 57.58 0 54 45.14 23.96 46.25 Standard Deviation (%) 5.92 35.02 3.22 0 8 6.81 4.04 6.36 Mean (%) 41.80 58.04 0 56.35 62 49.87 47.93 26.55 Median (%) 43.70 94.95 0 57.45 65 52.23 49.73 27.97 Minimum (%) 32.56 0.00 0 49.96 46 38.04 39.76 19.45 Maximum (%) 48.35 100.00 0 59.40 73 58.07 53.26 31.89 Standard Deviation (%) 4.79 47.38 0 2.30 8 6.01 4.03 3.74 IBOXX
CORPORATE BOND
EUROSTOXX 50
EURO AREA 10Y YIELD
Margin Rebalance - 20% Semiannual
40
Appendix D –Historical VaR’s for portfolios from 2006 until 2015
Table XXIV - Historical Var's for portfolios from 2006 until 2015 for 95% and 90% confidence levels
Historical VaR (%) Annual Semiannual Annual Semiannual Annual Semiannual
95% Confidence level -0.615 -0.733 -0.758 -0.773 -0.811 -0.747 -0.765 -0.782 -0.786 -0.585 -0.585 -0.585 -0.585 90% Confidence level -0.415 -0.515 -0.518 -0.522 -0.572 -0.528 -0.528 -0.545 -0.557 -0.408 -0.408 -0.408 -0.408 95% Confidence level -0.048 -0.558 -1.221 -1.156 -0.048 -0.048 -0.048 -0.029 -0.778 -0.035 -0.950 -0.042 -0.950 90% Confidence level -0.030 -0.042 -0.488 -0.410 -0.030 -0.030 -0.030 -0.006 -0.351 -0.014 -0.436 -0.022 -0.436 95% Confidence level -1.060 -1.125 -1.151 -1.167 -1.188 -1.218 -1.183 -1.165 -1.167 -1.165 -1.181 -1.203 -1.208 90% Confidence level -0.727 -0.790 -0.791 -0.790 -0.836 -0.846 -0.818 -0.809 -0.811 -0.809 -0.811 -0.816 -0.822 95% Confidence level -0.123 -0.139 -0.140 -0.141 -0.133 -0.123 -0.123 -0.127 -0.128 -0.126 -0.126 -0.123 -0.123 90% Confidence level -0.086 -0.098 -0.099 -0.099 -0.094 -0.086 -0.086 -0.088 -0.088 -0.088 -0.088 -0.086 -0.086 95% Confidence level -0.888 -1.130 -1.141 -1.153 -1.189 -1.169 -1.138 -1.145 -1.156 -0.888 -0.888 -0.888 -0.888 90% Confidence level -0.618 -0.804 -0.805 -0.814 -0.842 -0.821 -0.796 -0.819 -0.831 -0.618 -0.618 -0.618 -0.618 95% Confidence level -0.722 -0.886 -0.918 -0.927 -0.942 -0.931 -0.971 -0.928 -0.918 -0.711 -0.711 -0.711 -0.711 90% Confidence level -0.494 -0.624 -0.630 -0.629 -0.665 -0.657 -0.688 -0.655 -0.654 -0.497 -0.497 -0.497 -0.497 95% Confidence level -0.360 -0.436 -0.444 -0.446 -0.481 -0.450 -0.358 -0.345 -0.345 -0.345 -0.345 -0.345 -0.345 90% Confidence level -0.257 -0.304 -0.304 -0.308 -0.333 -0.315 -0.256 -0.231 -0.231 -0.231 -0.231 -0.231 -0.231 95% Confidence level -0.787 -0.889 -0.921 -0.926 -0.987 -0.939 -1.014 -0.921 -0.950 -0.943 -0.958 -0.733 -0.733 90% Confidence level -0.528 -0.621 -0.627 -0.629 -0.684 -0.663 -0.723 -0.649 -0.652 -0.655 -0.660 -0.521 -0.521
20%
Homogeneous
Tangent
Buy-and-Hold Calendar Rebalancing Threshold Rebalancing Margin Rebalancing
Annual Semiannual Quarter
5% Limit 10% Limit
40/20/40
40/40/20
15% Limit
10% 15%
Strategy
50/50/0
50/0/50
0/50/50