A N E P I D E M I O L O G I C A L S T U D Y
O F S Y S T E M I C L U P U S
E R Y T H E M AT O S U S I N P O R T U G A L
,
1970-2001
Tracy Moriarty
Maureen O’Sullivan
J. Gerard Wall
University of Limerick, Plassey Technology Park,purpose of this work was to carry out an analysis of SLE in Portugal, concentrating on such factors as clini-cal presentation, diagnosis information, lupus awareness and supports available to patients. Question-naires developed by the European Lupus Erythematosus Federation were distributed to members of the Portuguese Lupus Support Group (Associação de Doentes com Lúpus) and the results from the 941 re-turned forms were analysed in our group.
The Portuguese patient cohort displayed a characteristic female:male ratio of 11:1 and standard evi-dence of genetic involvement in the development of SLE. Amongst the broad range of symptoms repor-ted, the most common were joint and muscle pains and skin problems of various kinds, which are also characteristic of SLE patient groups. Analysis of the length of time taken for diagnosis revealed that it remai-ned relatively unchanged over the 1970-2001 study period. However, there was a sudden increase in lu-pus awareness in the mid-1990s, which coincided with a major lulu-pus awareness campaign carried out by the Support Group.
Key Words: Systemic Lupus Erythematosus; Diagnosis; Epidemiology.
R E S U M O
O Lúpus Eritematoso Sistémico (LES) é uma doença sistémica autoimune com sintomas muito variáveis. O objectivo deste trabalho foi o de efectuar uma análise do LES em Portugal, concentrando-se em factores como a apresentação clínica, a informação sobre o diagnóstico, conhecimento sobre a doença e apoios disponíveis para os doentes. Foram distribuídos questionários desenvolvidos pela Federação Europeia de LES aos membros da Associação Portuguesa de Doentes com Lúpus e os resultados de 941 formulários preenchidos foram analisados pelo nosso grupo.
A amostra de doentes Portugueses analisada apresentava uma típica relação sexo feminino:masculino de 11:1 e uma evidência de envolvimento genético no desenvolvimento do LES. Entre os sintomas relata-dos, os mais comuns foram dores articulares e musculares e problemas cutâneos de vários tipos, que são também característicos dos doentes com LES. A análise do tempo necessário para estabelecer o diagnós-tico revelou que este manteve-se relativamente inalterado ao longo do período de estudo (1970-2001). No entanto, ocorreu um súbito aumento no conhecimento sobre a doença no meio da década de 1990, que coincidiu com uma importante campanha de informação desenvolvida pela Associação de Doentes com Lúpus.
A R T I G O O R I G I N A L
A N E P I D E M I O L O G I C A L S T U D Y
O F S Y S T E M I C L U P U S E R Y T H E M A T O S U S
I N P O R T U G A L
,
1 9 7 0 - 2 0 0 1Tracy Moriarty
*, Maureen O’Sullivan
**, J. Gerard Wall
***Introduction
Systemic Lupus Erythematosus (SLE) is a systemic autoimmune disease with a female dominance. The ratio of women to men with the disease is 8-10:1 among the general adult population and 5-7:1 among the elderly. It is generally considered a dis-ease of fertile women, between the ages of 20-40 years1. In the United States at least 131,000 indi-viduals have been afflicted with the disease, and in excess of 1,000,000 people worldwide. Various re-ports have also indicated that the incidence of SLE has increased significantly over the past four decades, e.g. from an incidence of 1.15 per 100,000 in 1950-79 to 5.56 per 100,000 in 1980-922. Studies in the U.K report a prevalence of 20-30 per 100,000 which mean that approximately one person in 3,500-5,000 has lupus (UK Lupus Group)3. SLE also shows a marked variation in frequency between different racial groups, however, with the disease considerably more prevalent in African Americans, Latin Americans, Native Americans and Chinese than in Caucasians or Hispanics4-6.
There has been a reduction in the case fatality rate over the past number of decades: the 10-year survival rate is 75-85% with more than 90% of pa-tients surviving more than 5 years7. However, stu-dies in countries with poorer access to medical care can still show 10-year survival rates as low as 60-70%8. The improvement in life expectancy in deve-loped countries has been variously attributed to improved treatment regimes and to greater lupus awareness and the wider range of tests available, al-lowing the early detection of milder forms of the disease7.
The objective of this work was to carry out a
study of SLE patients in Portugal, concentrating on such factors as clinical presentation, diagnosis de-lay, and lupus awareness and supports available to patients.
In 1991 the European Lupus Erythematosus Fe-deration (ELEF) conducted a Europe-wide survey on Lupus. The present work was based on the ques-tionnaire developed by the ELEF for its 1991 study and was carried out at the University of Limerick, Ireland out as a collaborative project involving the Portuguese Association of Patients with Lupus (As-sociação de Doentes com Lúpus). It follows from a similar study carried out in the Republic of Ireland in 1997-9 in association with the Irish Lupus Sup-port Group9,10.
Material and Methods
Study designThe ELEF was formed in 1989 and currently has 16 member organisations, including the Portuguese Association of Patients with Lupus, in 15 member countries. The aims of ELEF are to collect informa-tion on all aspects of lupus and thereby assist in im-proving the knowledge of the disease for lupus pa-tients, and members of the health, welfare and medical professions; to promote awareness of the disease and to assist in the establishment of groups in European countries where they do not exist; to gain representation on any European or Interna-tional body whose interests could be of benefit to members of ELEF; and to encourage and under-take surveys and research projects related to the disease and to publish useful results of any such survey. Since its inception in 1992, the Portuguese support group has provided free psychological counselling, free accommodation in Lisbon and in Oporto for patients travelling for medical care and a national toll free telephone number for informa-tion about lupus and patients’ legal rights. It also provides socio-economic support to patients in
*BSc, Department of Chemical and Environmental Sciences ** BSc PhD, Department of Chemical and Environmental Sciences **BSc PhD, Department of Chemical and Environmental Sciences and Materials and Surface Science Institute, University of Limerick, Plassey Technology Park, Limerick, Ireland
need and has gained exemptions for lupus patients from paying for medication and hospital assistan-ce. Furthermore, a biannual meeting of lupus pa-tients, family members and healthcare workers is organised to provide information and support while radio and television interviews, newspaper and magazine articles, and occasional art exhibi-tions, marathons, seminars and other events are organised throughout the country to raise aware-ness of the condition.
Questionnaires developed by ELEF were dis-tributed to all patients upon joining the Portuguese Lupus Support Group and were returned either by post or to the Support Group offices in Lisbon, Oporto, Alentejo and Azores, on an ongoing basis from 1993-2001. Because identification of respon-dents was not recorded, it was not possible to de-termine the prevalence of the disease or to conduct interviews or consult patient records in order to de-termine whether the sample cohort was represen-tative of the entire disease population. The 941 questionnaires that had been completed and re-turned by the beginning of this analysis (May 2001) were passed to the group at the University of Li-merick for data analysis. Data analysis was carried out using Microsoft Excel statistics software and Minitab 13 for Windows. The Student’s t test was used for statistical evaluation of differences of mean values, with P values of 0.05 or less conside-red significant.
Questionnaires
A copy of the questionnaire is provided in Appen-dix 1. It consists of eight main sections:
Section 1: General Information
This section gathered general information on the respondent’s age, gender, marital status and num-ber of siblings it also asked whether female pa-tients had been advised against having (further) children.
Section 2: Family History
This group of questions investigated the patient’s family history and determined whether any of the patient’s immediate family had lupus.
Section 3: Medical History
Respondents were asked whether they had ever experienced a range of common lupus symptoms. They were also asked when they had experienced their first lupus symptom(s) and when they were
diagnosed as having lupus.
Section 4: Social History
This section dealt with the psychological effects lupus can have on patients and the difficulties patients can have in explaining their disease to others.
Section 5: Employment
The occupations of respondents were identified; respondents were also asked whether their disease had affected their employment.
Section 6: Lupus Awareness
Here the patient’s awareness of lupus prior to his/her own diagnosis was examined, as well as the various mechanisms that might be used to in-crease lupus awareness.
Section 7: Diet
Respondents were asked about their diets and whether they found any particular foods beneficial to their condition.
Section 8: Diagnosis
This section determined which medical profes-sionals had diagnosed the respondent’s lupus.
Results and discussion
Section 1: General Information
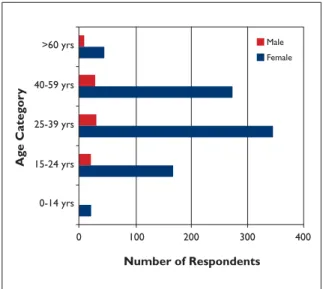
In total, 941 patients responded to the survey, of whom 848 were female and 80 male (13 respon-dents did not specify their gender). This corres-ponds to a female to male ratio of just less than 11:1, which is in agreement with results from other countries: in general, the F:M ratio is estima-ted at 8-10:1 in SLE, though this ratio decreases at lower and higher ages (ratios were 8:1, 13:1, 11:1 and 5:1 in age groups 15-24, 25-39, 40-59 and over 60 years, respectively, in this work).
As we did not attempt to identify additional SLE patients, other than those who responded to the survey, the overall prevalence of the condition in Portugal cannot be estimated. Similarly, the total number of questionnaires distributed was un-known and, thus, the response rate to the survey was not calculated. Respondents to the survey were primarily of Portuguese origin, as expected: 821 of the 835 respondents (> 98%) who specified their country of origin were from Portugal, while
the remainder were from Angola (5 respondents), Mozambique (3), France (2), and Brazil, Holland, Luxembourg or America. Meanwhile, 56% of res-pondents were married, with 34% single, 7% divor-ced and 3% widowed.
The age distributions of female and male res-pondents are shown in Figure 1. In both cases, the highest prevalence of SLE was observed in the 25-39 year age group. This is unsurprising, in women in particular, as SLE occurs most commonly throughout the reproductive years in women. Thus, SLE tends to arise less frequently before pu-berty and after menopause, which is reflected in the Figure.
The Portuguese and Irish surveys differ in this respect, with the largest age groups affected in the latter being 40-59 years of age in both women (44% of cases) and men (45% of cases). This apparent bias towards older patients in the Irish group com-pared to other studied populations could be due simply to older patients being more active in the Support Group – through which the survey respon-dents were identified – though additional work would be necessary to check this.
Section 2: Family History
As SLE is known to have a genetic input, patients were asked whether their parents, siblings or any other relative also suffered from lupus. 3.1% of res-pondents had at least one relative with lupus and, while this may seem low, it should be remembered that the prevalence of lupus in countries such as
Portugal is typically calculated to be in the region of 20-50 cases per 100,000 individuals. Thus, the prevalence of SLE estimated in family members of SLE patients in this work may be as much as 100-fold higher than the prevalence in the general Por-tuguese population. As expected based on the fe-male:male ratio outlined above, more female rela-tives of patients had SLE than males: 0.9% of pa-tients’ fathers, 1.7% of mothers, 1.5% of sisters and 0.3% of patients’ brothers.
Flares in disease activity in SLE have been asso-ciated with increased risks to the mother and foe-tus during pregnancy, and flares in the disease may also be exacerbated by pregnancy. In the Por-tuguese population, 27% of female respondents had been advised against having (more) children due to these adverse effects experienced during pregnancy, whereas 51% of respondents had not been advised against having children (and 22% did not answer the question).
Section 3: Medical History
The symptoms associated with SLE are highly di-verse. In this study, painful joints, aching muscles and sensitive skin were the three main symptoms affecting both female and male lupus patients.
A number of symptoms were found to be sig-nificantly (P ≥ 0.05) more prominent in females than in males: swollen and painful lymph glands, anaemia and frequent headaches (Table I). Con-versely, male lupus patients suffered slightly more than females from various skin rashes.
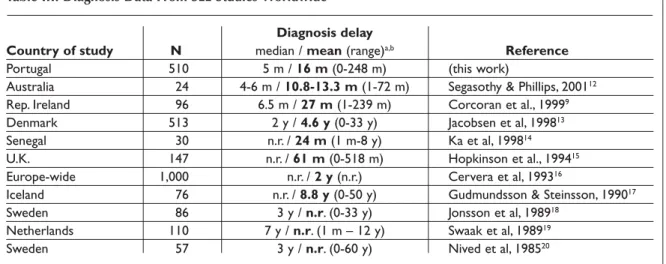
Diagnosis of SLE is traditionally difficult, due largely to the diversity of symptoms with which different patients present. Therefore, we studied the average length of time taken for diagnosis of Portuguese SLE patients over the period 1970-2001 and compared this to diagnosis delay reported in the scientific literarature for other populations (Ta-bles II and III). We defined the length of time taken to diagnose SLE as the time between onset of the disease (based on patients’ recollection of their first symptom attributable to SLE) and their diag-nosis with SLE. The response to this part of the questionnaire was approximately 60%, and this re-latively low response rate was most likely due to difficulties amongst respondents in recalling the precise month of occurrence of sometimes distant events. Due to the fact that respondents were not identified in questionnaires, it was not possible to determine whether the ~60% of respondents who provided the relevant information in this section
T R A C Y M O R I A R T Y E C O L. >60 yrs 40-59 yrs 25-39 yrs 15-24 yrs 0-14 yrs 0 100 200 300 400 Male Female Number of Respondents Ag e Categ or y
were representative of the entire cohort but an analysis of responders and non-responders re-vealed no significant differences between the two groups in terms of age or sex (data not shown).
While a progressive decline was originally ob-served in mean diagnosis times from the pre–1970s to 2001 (the year in which the study was comple-ted), it is clear that many patients whose disease began in 2001 are likely to still not have been diagnosed, whereas there are presumably far fewer such patients still undiagnosed from the 1970s or 1980s (as more time has elapsed in which their di-sease might have been identified). We therefore at-tempted to «normalise» the average diagnosis times for all decades to take this bias into account (Table II). Thus, data were analysed after a fixed in-terval had elapsed at the end of each decade rather than from a single, common time point in order to
eliminate bias and more accurately investigate trends in diagnosis times throughout the study pe-riod. Therefore, the period 1970-9 was analysed based on the data available in December 1981, 1980-9 from December 1991, and January 1990-May 1999 from 1990-May 2001, when the survey was completed. In this analysis, patients with disease onset prior to 1970 were excluded due to their small numbers, while the normalisation procedure did not allow us to calculate data for patients with on-set of SLE in 2000 or 2001. Therefore, diagnosis fi-gures are given for 1970-99 only.
Here, statistical analysis revealed that the de-crease in the normalised mean (“average”) diag-nosis time is not significant, while only minor de-creases and inde-creases are seen in the percentages of patients diagnosed in less than 3 months and greater than 12 months, respectively, over the same period. Thus, while diagnosis times for SLE appear to have shortened over the past 30 years in Portu-gal – which, if true, could be attributable to an im-proved awareness of lupus amongst patients and clinicians and/or to advances in diagnostic tests to identify the disease – the improvement remains so small that rigorous statistical analysis cannot con-firm that an improvement has occurred.
The issue of SLE diagnosis times decreasing re-mains controversial in general, with evidence reported for and against in various populations around the world. A number of these studies are summarised in Table III.
In a direct comparison between Portugal and Ireland (data not shown), the most notable diffe-rence between the two populations was observed in the 1970s: in Ireland, the mean diagnosis time for diagnosis was 103 months, compared with 41 months in Portugal. Furthermore, diagnosis took longer than 12 months for 82% of Irish but only 28% of Portuguese patients with disease onset in this decade. By the 1990s, however, diagnosis of the condition was similar in Portugal and Ireland, with, in this case, a statistically significant im-provement in diagnosis in Ireland over the inves-tigation period9.
Diagnosis times were generally shorter in Por-tugal than in other studies, which may be related to the age of the patient group surveyed. SLE is of-ten more difficult to recognise in older patients, due to being obscured by other medical com-plaints. Analysis of the diagnosis data shown in Table III revealed that the Portuguese patient co-hort had an average age of 36.2 years, which was
Table I. Prevalence of Symptoms in Male and Female Respondents
% %
Symptom Females Males
Painful joints 83 76
Persistent aching muscles 70 67
Sensitive skin 69 61
Numb fingers and toes 60 50
Hair loss 60 49
Puffiness of the hands and feet 60 42
Skin eruptions 55 54
Frequent headaches 54 25
Rashes after being in the sun 49 52
Persistent dryness and
grittiness of the mouth 48 40
Bad reaction to insect bites 41 37
Night sweats 40 39
Recurring flu-like symptoms 40 36
Anaemia 39 22
Persistent dryness and
grittiness of the eyes 38 31
Mouth ulcers 33 14
Swollen/Painful lymph glands 32 19
Protein in urine or kidney
inflammation 28 17
High blood pressure 26 26
Rashes lasting longer than
one month 25 30
Allergies to drugs 23 14
the youngest in any of the studies shown11. This is most likely due to patient retrieval being based ex-clusively on Support Group records in this inves-tigation, while in many of the other studies pa-tients were identified using hospital records, which may identify predominantly older patients who are more likely to be hospitalised due to lupus or un-related health problems.
Section 4: Social History
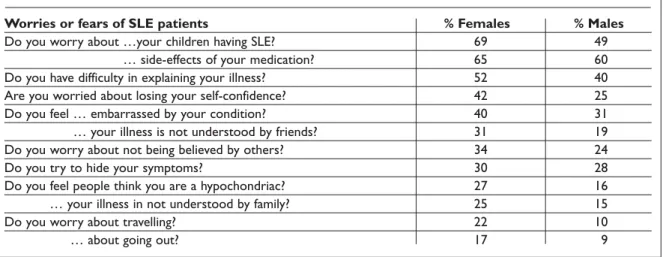
SLE can be exacerbated by stress and is often as-sociated with depression, which can be caused by a variety of factors – including, for example, other people’s lack of understanding of a patient’s illness. In questioning about their worries about SLE, the most widespread fear among female patients was of their children getting lupus (Table IV).
Men were most worried about the side effects of their medication but concerns about their children having lupus also featured strongly. A large propor-tion of both female and male respondents felt that their families and friends provided a good support
network in understanding the disease. Table IV shows that female and male patients showed gene-rally similar responses to these questions but that women with lupus suffer more from these charac-teristic psychological effects of SLE.
Section 5: Employment
SLE can have a detrimental effect on patients’ em-ployment due to the debilitating nature of the disease. 43% of the respondents to the survey were in full-time employment and 6% were employed part-time. Housewives constituted 17% of respon-dents and sturespon-dents 15%, with just 8% unemployed. Respondents’ occupations were diverse, with nur-ses and doctors, lawyers, hairdressers, television producers, travel agents and computer program-mers included amongst those listed. Difficulties in deciphering and translating replies meant that it was not possible to compare occupations prior to and subsequent to diagnosis.
Respondents were also questioned about their employer’s attitude to their illness as it is thought
T R A C Y M O R I A R T Y E C O L.
Table III. Diagnosis Data From SLE Studies Worldwide11
Diagnosis delay
Country of study N median / mean (range)a,b Reference
Portugal 510 5 m / 16 m (0-248 m) (this work)
Australia 24 4-6 m / 10.8-13.3 m (1-72 m) Segasothy & Phillips, 200112
Rep. Ireland 96 6.5 m / 27 m (1-239 m) Corcoran et al., 19999
Denmark 513 2 y / 4.6 y (0-33 y) Jacobsen et al, 199813
Senegal 30 n.r. / 24 m (1 m-8 y) Ka et al, 199814
U.K. 147 n.r. / 61 m (0-518 m) Hopkinson et al., 199415
Europe-wide 1,000 n.r. / 2 y (n.r.) Cervera et al, 199316
Iceland 76 n.r. / 8.8 y (0-50 y) Gudmundsson & Steinsson, 199017
Sweden 86 3 y / n.r. (0-33 y) Jonsson et al, 198918
Netherlands 110 7 y / n.r. (1 m – 12 y) Swaak et al, 198919
Sweden 57 3 y / n.r. (0-60 y) Nived et al, 198520
N = number of patients in study, m = month, y = year, n.r. = not reported;
bdiagnosis delay is given in months or years, according to the units in which it was reported in each study.
Table II. Detailed Analysis of Diagnosis Times11
Time period (N)a meanb (‘normalised’)b median Q1, Q2, Q3a <3 monthsc >12 monthsc
1970-9 (21) 41.1± 15.6 14.3 ± 4.8 10 2, 5.5, 13 38.9 27.8
1980-9 (94) 34.5 ± 5.5 13.3 ± 2.8 5 1, 3, 13 41.6 26.0
1990-9 (395) 10.2 ± 0.8 10.2 ± 0.8 5 2, 5, 12 42.3 23.0
aabbreviations: N = number of respondents, Q1 = 1stquartile, Q3 = 3rdquartile;bmeans are expressed ± the standard error of the mean;cpercentage of
that lack of understanding of SLE, particularly on an employer’s part, can lead to problems for pa-tients in the workplace. 47% of papa-tients did not be-lieve that their illness had affected their employer’s attitude, however, compared to 18% who thought otherwise, and 35% who did not reply.
Section 6: Lupus Awareness
Increased lupus awareness in the population is generally thought to have a positive effect on SLE patients, both in terms of earlier diagnosis due to faster recognition of the condition and to increased ease of social interactions. In this work, we asked SLE patients about their awareness of the disease prior to their own diagnosis, using them as a rough indicator of disease awareness in the general Por-tuguese population.
It should be noted here that the genetic predis-position for SLE means that respondents are them-selves more likely to have a family member with the condition and, thus, to have a somewhat higher awareness of the disease than the general popula-tion. Nevertheless, analysis of the trend in pre-diagnosis disease awareness over the period 1979-2001 shows a very interesting increase, with a ma-jor increase in awareness of SLE having occurred between 1994 and 1995 (Table V ). This corres-ponded with a major lupus awareness campaign carried out by the Portuguese Lupus Support Group in May 1994, which utilised television, ra-dio, newspapers and advertising on billboards and public transport to raise awareness of the condi-tion. This campaign appears to have been extreme-ly successful in raising the profile of SLE, based at
least on our analysis of disease awareness, and it would be interesting to determine if this increased awareness is maintained and has an effect on im-proving disease recognition and, thus, shortening disease diagnosis times in Portugal over the years to come.
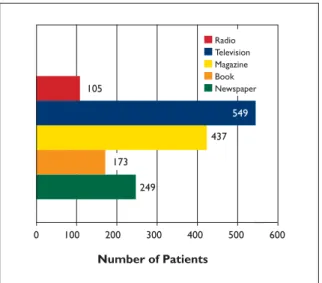
We also investigated the sources of respondents’ information on SLE and found that most comes from television and magazines (Figure 2). These questions were concerned with information found by lupus patients in the media after their own diag-nosis and, thus, do not necessarily demonstrate the effectiveness of the different forms of media in communicating lupus information to the general population. The data in Portugal differ slightly from those found in Ireland, where television was also the most common source of information but radio featured much more strongly than in the Por-tuguese patient group9.
Table IV. Common Fears of SLE Patients
Worries or fears of SLE patients % Females % Males
Do you worry about …your children having SLE? 69 49
Do you worry about … side-effects of your medication? 65 60
Do you have difficulty in explaining your illness? 52 40
Are you worried about losing your self-confidence? 42 25
Do you feel … embarrassed by your condition? 40 31
Do you feel … your illness is not understood by friends? 31 19
Do you worry about not being believed by others? 34 24
Do you try to hide your symptoms? 30 28
Do you feel people think you are a hypochondriac? 27 16
… your illness in not understood by family? 25 15
Do you worry about travelling? 22 10
… about going out? 17 9
Table V. Detailed Analysis of Increase in Lupus Awareness
Time period % Respondents (N)
1970-9 6.1 (33) 1980-9 10.7 (131) 1990-9 37.0 (568) [of which: 1990-3 11.0 (145) 1994 29.5 (44) 1995-9 47.9 (379)] 2000-1 47.8 (82)
Section 7: Diet
Respondents were asked whether they felt that any particular foods affected their condition. 57% replied that their diet caused neither an improve-ment nor a deterioration in their disease activity, whereas 23% thought that various foods could af-fect disease severity. When asked what types of diets are found to be beneficial, the most common answers were «normal», «healthy» and «balanced». More specific examples of beneficial diets or food-stuffs that were provided by individual respon-dents included a broad range of items, including vegetarian, fat-free and salt-free diets, as well as grilled foods, stews, cereals, yoghurts, salads and greens, fruits and vegetables.
Section 8: Diagnosis
The medical practitioners who most frequently diagnosed respondents’ SLE were rheumatologists, followed by dermatologists and general practi-tioners (Figure 3). This coincides with the fact that painful joints and skin problems were amongst the most common disease symptoms reported by pa-tients (Table I). In the category of «Others», the most common practitioners were internal medici-ne (36%), medici-nephrologists (16%), haematologists (6%) and neurologists, cardiologists and paedia-tricians (3% each).
In Ireland the clinicians involved in the diagno-sis of SLE follow a similar trend to that observed in Portugal, with rheumatologists again diagnosing the greatest highest number of patients, followed by dermatologists and general practitioners9.
Acknowledgements
The authors would like to thank Dr Rosa Maria Gon-çalves and Ana Tam for administering the questionnaires and for all their help in carrying out this work. Thanks are also due to all members of Associação de Doentes com Lúpus for their time and effort in filling out the questionnaires. MO’S was funded by the CES Depart-ment, University of Limerick and Enterprise Ireland Science and Technology Development Agency grant BR/1997/095.
References
1. Kiss E, Bhattoa HP, Bettembuk P, Balogy A and Szege-di G. Pregnancy in women with systemic lupus ery-thematosus. Eur J Obstetrics Gynecol and Reproduc-tive Biol 2002; 101: 129-34.
2. Blatt NB and Glick GD. Anti-DNA autoantibodies and systemic lupus erythematosus. Pharmacol & Therap 1999; 83: 125-39.
3. Hopkinson ND, Doherty M and Powell RJ. The preva-lence and incidence of systemic lupus erythemato-sus in Nottingham, U.K., 1989-1990. Br J Rheumatol 1993; 32: 110-5.
4. Peschken CA and Esdaile JM. Systemic lupus erythe-matosus in North American Indians: a population based study. J Rheumatol 2000; 27: 1884-91.
5. Hopkinson ND. Epidemiology of systemic lupus ery-thematosus. Ann Rheum Dis 1992; 51: 1292-4. 6. Wang F, Wang CL, Tan CT and Manivasagar M.
Sys-temic lupus erythematosus in Malaysia: a study of 539 patients and comparison of prevalence and di-sease expression in different racial and gender groups. Lupus 1997; 6: 248-53.
7. Uramoto KM, Michet CJ Jr, Thumboo J, Sunku J, O’-Fallon WM and Gabriel SE. Trends in the incidence
T R A C Y M O R I A R T Y E C O L. 0 100 200 300 400 500 105 437 549 249 600 Radio Television Magazine Book Newspaper Number of Patients 173
Figure 2. Sources of respondents’ information on SLE.
350 300 250 202 274 255 297 200 100 150 50 0 Number of Respondents G. P. Rheumatologist Dermatologist Other
and mortality of systemic lupus erythematosus, 1950-1992. Arthritis Rheum 1999; 42: 46-50.
8. Ruiz-Irastorza G, Khamastha MA, Castellino G and Hughes GRV. Systemic lupus erythematosus. Lancet 2001; 357: 1027-32.
9. Corcoran D, O’Sullivan M and Wall JG. Clinical spec-trum and diagnosis of systemic lupus erythematosus in the Republic of Ireland. Med Sci Res 1999; 27: 769--71.
10. Corcoran D and Wall JG. Lupus support and aware-ness in the Republic of Ireland. Irish Med J 2000; 93: 54-5.
11. Moriarty T, O’Sullivan M, Tam A, Gonçalves RM and Wall JG. Systemic lupus erythematosus in Portugal: Diagnosis and disease awareness from 1970-2001. Eur J Epidemiol 2003; 18: 995-9.
12. Segasothy M, Phillips PA. Systemic lupus erythemato-sus in Aborigines and Caucasians in central Australia: a comparative study. Lupus 2001;10:439-44.
13. Jacobsen S, Petersen J, Ullman S, et al. A multicentre study of 513 Danish patients with systemic lupus ery-thematosus. I. Disease manifestations and analyses of clinical subsets. Clin Rheumatol 1998; 17: 468-77. 14. Ka MM, Diallo S, Kane A, et al.Systemic lupus
erythe-matosus and lupus syndromes in Senegal. Rev Rheum.[Engl. Ed.] 1998; 65: 471-6.
15. Hopkinson ND, Doherty M, Powell RJ. Clinical fea-tures and race-specific incidence/ prevalence rates of systemic lupus erythematosus in a geographically
complete cohort of patients. Ann Rheum Dis 1994; 53: 675-80.
16. Cervera R, Khamasta MA, Font J, et al. Systemic lupus erythematosus: clinical and immunologic patterns of disease expression in a cohort of 1,000 patients. Medicine 1993; 72: 113-24.
17. Gudmundsson S and Steinsson K. Systemic lupus erythematosus in Iceland 1975 through 1984. A na-tionwide epidemiological study in an unselected population. J Rheumatol 1990; 17: 1162-7.
18. Jonsson H, Nived O, Sturfelt G. Outcome in systemic lupus erythematosus: a prospective study of patients from a defined population. Medicine 1989; 68:141-50. 19. Swaak AJG, Nossent JC, Bronsveld W, van Rooyen A et
al. Systemic lupus erythematosus. I. Outcome and survival: Dutch experience with 110 patients studied prospectively. Ann Rheum Dis 1989; 48: 447-54. 20. Nived O, Sturfelt G and Wollheim F. Systemic lupus
erythematosus in an adult population in southern Sweden: incidence, prevalence and validity of ARA revised classification criteria. Brit J Rheumatol 1985; 24: 147-54.
Endereço para correspondência
Tel: -353-61-202296 E-mail: [email protected]
APPENDIX 1:
EUROPEAN LUPUS ERYTHEMATOSUS FEDERATION (ELEF)
Section 1 General information
1.1 Age:
1.2 Sex:
1.3 Marital status:
(Tick one of the following:)
Single Married Divorced Widowed 1.4 Number of brothers:
1.5 Number of sisters:
1.6 Have you been advised against having any more children? (Y/N) 1.7 Country of origin:
Section 2 Family history
2.1 Does your father suffer from Lupus? (Y/N)
2.2 Does your mother suffer from Lupus? (Y/N)
2.4 Does a sister suffer from Lupus? (Y/N) 2.5 Does any other close relative suffer from Lupus? (Y/N)
If so, how is this person related to you? 2.6 How many children have you?
Section 3 Medical history
Do you suffer from:
3.1 Rashes lasting for over one month (not sunburn)? (Y/N)
3.2 Rashes after being out in the sun? (Y/N)
3.3 Skin eruptions? (Y/N)
3.4 Sensitive skin? (Y/N)
3.5 Mouth ulcers (lasting over 2 weeks) (Y/N)
3.6 Hair loss? (Y/N)
3.7 Persistent dryness and grittiness of eyes? (Y/N)
3.8 Persistent dryness of the mouth? (Y/N)
3.9 Frequent headaches? (Y/N)
3.10 Swollen or painful lymph glands? (Y/N)
3.11 Recurring ‘flu-like’ symptoms (Y/N)
3.12 Night sweats? (Y/N)
3.13 High blood pressure? (Y/N)
3.14 Convulsions, epileptic fits, fainting? (Y/N)
3.15 Anaemia? (Y/N)
3.16 Protein in urine or kidney inflammation? (Y/N) 3.17 Allergies to food? (see question 7.00 Diet) (Y/N)
3.18 Allergies to drugs? (Y/N)
3.19 Bad reaction to insect bites? (Y/N)
3.20 Persistent aching muscles? (Y/N)
3.21 Painful joints? (Y/N)
3.22 Puffiness of hands and feet? (Y/N)
3.23 Numb fingers or toes? (Y/N)
3.24 When did you first have Lupus symptoms? Month: Year: 3.25 When were you first diagnosed as having Lupus? Month: Year:
Section 4 Social history
Do you fear or worry about:
4.1 Your medication your medication having side effects? (Y/N)
4.2 Your children getting Lupus? (Y/N)
4.3 Going out? (Y/N)
4.4 Travelling (Y/N)
4.5 Losing self-confidence? (Y/N)
4.6 Not being believed by others? (Y/N)
4.7 Do you feel people think you a hypochondriac? (Y/N)
4.8 Do you feel that your illness is understood by your family? (Y/N)
4.9 Do you feel that your illness is understoo...by your friends? (Y/N)
4.10 Do you feel embarrassed by your illness? (Y/N) 4.11 Do you have difficulty explaining your illness? (Y/N)
4.12 Do you try to hide your symptoms? (Y/N)
Section 5 Employment Are you: 5.1 A student? 5.2 A housewife? 5.3 Employed full-time? 5.4 Employed part-time? 5.5 Unemployed? 5.6 Retired?
If you are working at the present time: 5.7 What is your occupation?
5.8 What was your occupation when you were diagnosed?
5.9 Has your disease affected your employer’s attitude? (Y/N) 5.10 If no longer working, what was your occupation when diagnosed?
Section 6 Lupus awareness
6.1 Had you ever heard of lupus before you were diagnosed? (Y/N) 6.2 Have you ever seen Lupus mentioned:
In a newspaper? (Y/N)
In a magazine? (Y/N)
On television? (Y/N)
On radio? (Y/N)
Section 7 Diet
7.1 Do certain foods affect your disease? (Y/N)
7.2 What type of diet do you find helpful to you?
Section 8 Diagnosis
8.1 Who diagnosed your disease: General Practitioner? Rheumatologist? Dermatologist?