Agronomy 2020, 10, 268; doi:10.3390/agronomy10020268 www.mdpi.com/journal/agronomy Article
Effects of Post‐Anthesis Heat Waves on the Grain
Quality of Seven European Wheat Varieties
Diana Tomás, Wanda Viegas and Manuela Silva * Linking Landscape, Environment, Agriculture and Food (LEAF), Instituto Superior de Agronomia, Universidade de Lisboa, 1349‐017 Lisboa, Portugal; [email protected] (D.T.); [email protected] (W.V.) * Correspondence: [email protected]; Tel: +351‐213653457 Received: 09 January 2020; Accepted: 11 February 2020; Published: 13 February 2020 Abstract: Wheat is undoubtedly one of the most important crops worldwide and it is essential to study how the distinct varieties answer to heat waves associated with climatic changes, in order to design adequate wheat breeding strategies. To assess high temperature (HT) impact in wheat grain characteristics, seven commercial varieties, which have been recommended for production in Portugal, were submitted for one‐week HT treatment ten days after anthesis. Firstly, predicted grain technological quality was determined by giving high scores for all varieties studied, based on the allelic compositions of genes encoding high molecular weight glutenins, granule‐bound starch synthase and puroindolines. The effects of HT on transcription levels of those genes were, for the first time, evaluated in distinct wheat genotypes, in comparison with control plants. Finally, protein fraction content in mature grains were also estimated in untreated and treated plants. Immature grains from plants, maintained in control conditions, showed significant intervarietal differences in transcription levels of genes associated with grain quality traits, a variability that was significantly reduced in grains from HT treated plants. On the other hand, the influence of HT in mature grain protein‐fractions and in gliadin/glutenin ratios revealed intervarietal diversity, even with opposite effects in some varieties. The present study, therefore, discloses marked variability in parameters associated with flour quality between the wheat varieties analyzed, which are differentially affected by HT treatments, similar to heat waves frequently observed in climate change scenarios.Keywords: Bread wheat; heat waves; quality related genes; genetic and transcription diversity; grain protein fractions
1. Introduction
Hexaploid wheat (Triticum aestivum L.) is the third most produced cereal worldwide and provides nearly 20% of the world’s daily food supply based on calorie intake [1]. Wheat aptitude in producing unique food products, like bread depends on grain quality, and determined by parameters, such as protein and starch composition, grain hardness and flour color. Wheat grain storage proteins are classified into three main classes, based on their solubility: Albumins, globulins and prolamins. Albumins and globulins constitute 10 to 22% of total flour protein and have high nutritional value although minor importance in baking quality [2]. On the other hand, prolamins comprise monomeric gliadins and polymeric glutenins, responsible for wheat dough extensibility, and elasticity, respectively, and their ratio is associated with parameters, like dough resistance and loaf volume. Glutenins are crucial for the establishment of interchain disulphide bonds to form the gluten matrix, a protein network that entrains air bubbles during dough fermentation and confers elasticity to the dough. Glutenins account for 30–40% of the total grain protein and are classified as high molecular weight (HMW) and low molecular weight (LMW). Although, HMW constitutes only
7% to 15% of gluten proteins, they are the most determinant for gluten characteristics, as their allelic diversity has been strongly related to variations in breadmaking quality [3].
The starch fraction, comprising about 70% of wheat grain total dry matter also greatly affects end‐use quality and the nutritional value of wheat products. Starch comprises two macromolecules, amylose and amylopectin, and its biosynthesis requires the coordinated activities of several enzymes. Granule‐bound Starch Synthase I (GBSSI), also called waxy protein, is a key enzyme in amylose synthesis in the endosperm tissue [4]. Hard or soft wheat kernel textures are also determinants for milling properties and wheat end‐use quality, since soft wheat kernels result in finer flour suitable for cookies, cakes and pastries, while hard wheats are used in breads leavened by yeast. Grain hardness is mostly controlled by Puroindolines A and B [5].
A significant decrease in wheat productivity is expected due to climate changes and temperature stress in Europe [6]. Wheat grain yield, as well as flour technological and nutritional qualities, although genetically determined, are also strongly modulated by environmental conditions. Several studies demonstrated that high temperature stress, during grain filling accelerates, and compresses key events during wheat grain development, like storage protein and starch synthesis in endosperm [7,8]. Altogether, it is presently consensual that high temperature has great impact on grain composition, and expression patterns of key quality‐related genes at an early stage of seed development [9–14]. Heat waves, defined by the World Meteorological Organization as five or more consecutive days of heat in which the daily maximum temperature is at least 5 °C higher than the average maximum temperature[15], have been recently predicted to be particularly frequent and severe in Portugal [16]. In the present work, the impact of heat waves, particularly frequent in Southern Portugal wheat fields during grain filling, was comparatively assessed in seven varieties recommended for use in Portugal in relation to the transcription levels of genes associated with grain technological characteristics and grain protein fractions relative content. 2. Materials and Methods 2.1. Plant Material and High Temperature Treatments In this work, the seven bread wheat (Triticum aestivum L., 2n = 6x = 42, AABBDD) commercial varieties were used, which were recommended to be used in Portugal, based on phenological, agronomic and technological traits [17]. These seven varieties were Almansor, Antequera, Bancal, Estero, Nabão, Pata Negra. While, Roxo and Chinese spring genotypes was also used as reference lines for allelic composition analysis. The seeds used in this work were obtained after two years of controlled propagation of material, gently supplied by INRB/INIAV Portugal (National Institute of Biological Resources) and ANSEME, Portugal (National Association of Seed Producers and Traders), Portugal. Twenty seeds from each commercial variety were germinated and grown in controlled conditions with 16h light 25 °C/8h dark 20 °C and three‐week old plants were then transferred to soil pots and maintained in greenhouse conditions. Fresh young leaves of 1‐month‐old plants were collected and stored at −80 °C for DNA extraction to be used in allelic composition identification. When the first anther was observed (anthesis) in the first spike, the plants were transferred to growth chambers with controlled conditions with 16h light at 25 °C/8 h dark at 20 °C. Ten days after anthesis (daa) subsets of ten plants were submitted to two different growth conditions for one week. While ten control plants were maintained in 16h light at 25 °C/8 h dark at 20 °C, ten other plants were submitted during seven days to a daily high temperature (HT) treatment, simulating an heat wave. This treatment consisted in a gradual increase of temperature, at the end of the dark period, from 20 to 40 °C during 6 h, followed by an exposure to 40 °C for 4 h during daylight period and a subsequent gradual decrease to 20 °C during 6 h. In the last day of the treatment, immediately after the period of 4 h at higher temperature (40 °C for treated plants and 25 °C for control) two immature grains from the middle of each first spike of each plant were collected and stored at −80 °C for posterior RNA extraction. After treatments plants were again transferred to greenhouse and maintained until the end of lifecycle. All further analysis in mature grains were restricted to seeds from the first spike to guarantee identical developmental stage during HT treatments.
2.2. Genetic Variability Analysis
DNA was extracted using the Citogene® DNA Cell&Tissue Kit (Citomed, Lisbon, Portugal) and
its concentration and integrity were evaluated in microplate reader Synergy HT (Biotek, Winooski, Vermont) using the software Gen5TM (Biotek, Winooski, Vermont). For the identification of allelic composition of genes encoding High Molecular Weight Glutenin Subunits (HMW‐GS), Waxy and Puroindolines, specific primers and PCR amplification conditions were used (primers and references in Supporting information S1 Table). PCR mixture included 1x PCR buffer, 1.5 mM MgCl2, 0.25 mM dNTP’s, 1 mM each primer, 0.5 U Taq polymerase and 50 ng DNA template in a total volume of 20 microliter. PCR products were separated in agarose gel electrophoresis detected with ethidium bromide and photographed using a Bio‐Rad GEL DOC 2000 (Bio‐Rad Laboratories, Inc., Hercules, California). For each sequence and variety studied, at least three individual plants were analyzed in three technical replicates each. 2.3. Comparative Transcription Analysis The total RNA was individually extracted from immature grains collected from five plants of each condition (control and heat treated) immediately after the one week HT period (17 daa), using the Spectrumᵀᴹ Plant Total RNA Kit (Sigma‐Aldrich, Inc, St.Louis, Missouri), and following manufacturer’s instructions. After RNA concentrations and integrity verification executed as described above, 2μg of total RNA was used for RQ1 RNase‐Free DNase digestion (Promega, USA) and first strand cDNA synthesis using RevertAid H Minus Reverse Transcriptase with Oligo(dT)18 primer (Thermo Fisher Scientific Inc, Waltham, Massachusetts). Quantitative Real‐time PCR (RT‐ qPCR) was performed using BIO‐RAD IQ5 Multicolor Real‐Time PCR detection System with the
SsoFastTM EvaGreen® Supermix (Bio‐Rad Laboratories, Inc., Hercules, California, CA, USA). Each
20μL PCR mix consisted in 5μL SsoFast EvaGreen supermix, 1μL of forward and reverse gene‐ specific primers (10nM each) and 1μL of cDNA (1:20 dilution). PCR amplification conditions followed those established in the reference of each primer pair, presented in Supporting information (S2 Table) and monitored via intercalation of Eva‐Green. In all quantification experiments, four endogenous reference genes with stable expression across a wide range of developmental and environmental conditions [18] were used: ADP‐ribosylation factor, Ubiquinol‐cytochrome C reductase iron‐sulfur subunit, Superoxide dismutase [Cu‐Zn] and Glyceraldehyde 3‐phosphate dehydrogenase. Each run was completed with a melting curve analysis and PCR products separation by electrophoresis, as previously described to confirm single amplification products. Quantification analysis was performed using threshold cycles (Ct), equilibrated with mean of the four housekeeping genes previously tested for transcription stability under HT conditions, to calculate ∆Ct (∆Ct = Ct gene of interest − Ct mean of reference genes). The measured gene transcription levels (ΔCt) obtained for the seven varieties studied were fitted to a linear model (ANOVA with one factor with fixed effects) and analyzed through multiple means comparison test (Tukey test). The individual effect of HT treatment in each variety in relation to the control was evaluated using a t test. Models were fitted in R using aov and Tukey.HSD functions. Differences were considered significant for p‐value < 0,05. For each gene and variety studied, five individual plants were analyzed in three technical replicates each.
2.4. Protein Fractions Quantification
Mature grains from the first spike of control and high temperature treated plants from each variety were grounded individually using Cryomill (Retsch GmbH, Haan, Germany) and protein fractions were then separated accordingly with modified Osborne method [19]. This procedure is based in the successive extraction of different fractions (albumins, globulins, gliadins and glutenins), according to their solubility in water or in 0,5N sodium chloride aqueous solution, 70% ethanol and 50% 1‐propanol + 1% dithiothreitol (DTT), respectively. Each fraction was obtained in the supernatant, after 30 min of vigorous shaking, followed by centrifugation for 5min at 8000g.
Comparative quantification of protein extracts was spectrophotometrically performed in triplicates for each extract through Bradford method [20], using Bradford Protein Assay Dye Reagent
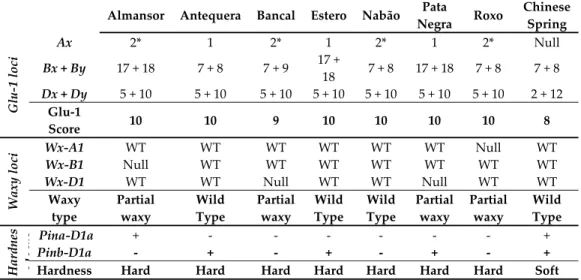
Concentrate (Bio‐Rad Laboratories, Inc., Hercules, California) and measured at 595nm after 10min incubation. 3. Results and Discussion 3.1. Genomic Analysis Revealed High Similarity on Genes Related with Grain Quality In order to support intervarietal comparisons of transcriptional patterns of genes associated with grain quality parameters, an initial evaluation of predicted breadmaking values of the seven varieties analyzed was performed, based on allelic characterization (Table 1) estimated using specific primers (Supporting information S1 Table). The inbred line Chinese Spring was used as reference due to its well established allelic composition. At least three distinct plants from each variety were analyzed and no intravarietal variability was detected for any loci.
Table 1. High Molecular Weight glutenin subunits, waxy and puroindolines allelic composition and
correspondent predicted flour technological characteristics.
Almansor Antequera Bancal Estero Nabão Pata
Negra Roxo Chinese Spring Glu ‐1 loci Ax 2* 1 2* 1 2* 1 2* Null Bx + By 17 + 18 7 + 8 7 + 9 17 + 18 7 + 8 17 + 18 7 + 8 7 + 8 Dx + Dy 5 + 10 5 + 10 5 + 10 5 + 10 5 + 10 5 + 10 5 + 10 2 + 12 Glu‐1 Score 10 10 9 10 10 10 10 8 Waxy loci Wx‐A1 WT WT WT WT WT WT Null WT Wx‐B1 Null WT WT WT WT WT WT WT Wx‐D1 WT WT Null WT WT Null WT WT Waxy type Partial waxy Wild Type Partial waxy Wild Type Wild Type Partial waxy Partial waxy Wild Type Hardnes slocus Pina‐D1a + ‐ ‐ ‐ ‐ ‐ ‐ + Pinb‐D1a ‐ + ‐ + ‐ + ‐ +
Hardness Hard Hard Hard Hard Hard Hard Hard Soft
Glu‐1 loci: Numbers correspond to the allele present in each subunit (x and y) of each Glu‐1 locus (Glu‐A1, Glu‐B1 and Glu‐D1) for each variety. The resulting score ranges between 1 and 10, corresponding higher values to better predicted breadmaking quality accordingly to Payne et al. [21]. Waxy locy: WT and Null indicates the presence of the wild‐type or mutated allele form, respectively, in each encoding waxy locus. Waxy type results from the combination of wild and null alleles, related with the expected flour amylose content. Hardness locus: (+) Indicates the presence and (‐) the absence of wild‐type alleles, Pina‐D1a or Pinb‐D1a. Hardness is the expected endosperm texture, accordingly to the allelic combination [5]. HMW glutenin subunits are encoded by Glu‐1 genes located in the long arms of homoeologous chromosomes 1A, 1B and 1D (named Glu‐A1, Glu‐B1, and Glu‐D1, respectively). Each HMW glutenin locus harbors two adjacent genes coding for x‐type and y‐type subunits with high and low molecular weights, respectively. The subunits encoded by the Glu‐D1 have a predominant effect on technological properties of bread wheat and the Glu‐D1d allele with 1Dx5 and 1Dy10 subunits, previously associated with stronger dough and superior end‐use quality [21], was detected in all varieties studied.
Concerning Glu‐A1 locus, only Glu‐Ax gene is usually active since Glu‐Ay‐type is silent in common wheat [reviewed in 21]. Ax1 and Ax2* subunits (Glu‐A1a and Glu‐A1b alleles, respectively) which are positively correlated with better breadmaking quality [21], are differentially present in the varieties here analyzed since Ax2* was identified in Almansor, Bancal, Nabão and Roxo while Ax1 was detected in the other three varieties.
The Bx7 + By8, Bx7 + By9, Bx17 + By18 subunits pairs encoded by genes located on locus Glu‐B1 (Glu‐B1b, Glu‐B1c and Glu‐B1i alleles, respectively) were also correlated with superior end‐use quality [reviewed in 21]. The analysis of this locus disclosed however some intervarietal diversity as Almansor, Estero and Pata Negra present Bx17 + By18 subunits, whereas Antequera, Nabão and Roxo are characterized by Bx7 + By8 subunits and Bancal by subunits Bx7 + By9. The first two combinations are related with better breadmaking quality while the Bx7 + By9 subunit combination confers intermediate quality characteristics for bread production [22].
According to Payne et al. [21] Glu‐1 quality scores, relating HMW subunits with quality evaluated through Sedimentation test (SDS), most varieties analyzed presented the maximum value of 10, excepting Bancal with a Glu‐1 score of 9, due to the subunit pair Bx7 + By9 encoded by Glu‐B1 locus.
Since amylose content is very relevant for wheat grain technological characteristics and nutritional value, genotypes are usually classified according with the prediction of amylose content based on the presence of mutations on waxy genes. GBSSI encoding genes are located on Waxy loci (wx) on chromosomes 7A (wx‐A1), 4A (wx‐B1) and 7D (wx‐D1) and in wild type wheats the three waxy genes coding Waxy proteins are present, in partial waxy one or two are absent (Types 2 to 7) and in waxy none of the proteins are present (type 8) [23]. The analysis of genes coding Waxy proteins revealed wild type genotypes (Wx‐A1a, Wx‐B1a and Wx‐D1a) for varieties Antequera, Estero and Nabão and partial waxy genotypes for the other varieties with one null allele, resulting in the loss of one GBSSI enzyme isoform (types 2, 3 or 4, depending on which locus has the null allele, Table 1). Since the absence of Wx‐A1 or Wx‐D1 proteins is not relevant for grain amylose content, the starch characteristics of the varieties analyzed are predicted to be very similar, except Almansor, which has Wx‐B1 locus null allele, associated with lower amylose content [23]. However, it was very interesting to identify type 4 varieties, as Bancal and Pata Negra, since the absence of the Wx‐D1 protein is rare in germplasm collections [reviewed in 7], exposing their putative importance in breeding programs oriented to select waxy or partial waxy wheats with applications in industry. Grain texture (hardness or softness of the grain) is an important attribute of breadmaking quality mainly controlled by two Puroindoline‐D1 genes, Pina and Pinb. Soft kernel texture is only associated with wild type alleles of both Puroindoline genes (Pina‐D1a and Pinb‐D1a), while mutations or deletions in their coding regions result in hard textured grain more apt for bread production [5]. To predict the grain texture of the varieties studied, we used primer pairs that are designed to detect the wild type alleles. Pina‐D1a allele was detected only in Almansor and Pinb‐D1a allele was observed in Antequera, Estero and Pata Negra whereas both wild type alleles were absent in Bancal, Nabão and Roxo. Therefore, all varieties studied correspond to hard grain phenotype usually associated with superior breadmaking quality. Overall the present study revealed intervarietal similarity in the predicted grain quality based on the allelic composition of genes associated with the most important technological traits. The transcription levels of those genes were further evaluated in immature grains, collected immediately after HT treatment period, in both treated and untreated plants.
3.2. Transcription Levels of Flour Quality Related Genes in Immature Grains Vary between Wheat Varieties The allelic composition and the transcription levels of glutenin genes are associated with dough properties [22]. Thus, transcriptional levels of genes associated with wheat grain quality were evaluated in five plants per variety 17 daa ‐ milk stage kernel, when carbohydrates and proteins are deposited [24]. RT‐qPCR was performed for the five active HMW‐GS genes (Ax, Bx, By, Dx, Dy), for both puroindoline genes (Pina and Pinb), as well as for gene encoding Granule bound starch synthesis (GBSSI). Contrary to the specific primers previously used to discriminate alleles, the primers used to evaluate genes transcription levels were those already well‐established to amplify conserved regions of such genes (S2 Table). All primer pairs used amplified a single product with the expected size in all samples analyzed, independently of the allelic composition.
The quantification of gluten protein genes transcription in control conditions disclosed several differences between varieties (Figure 1). Bancal presents the lower Ax gene expression value,
significantly different from Almansor, Estero, Nabão and Roxo. Regarding Glu‐B1 gene, no significant differences were detected in Bx subunit while By presented a significantly higher expression level in Roxo in comparison with Antequera, Bancal, Nabão and Pata Negra. Transcription levels of Glu‐D1 gene only show significant differences in Dx subunit between Estero and Nabão and no significant differences were detected regarding Dy.
Figure 1. Transcription levels of High Molecular Weight Glutenin Subunits (HMW‐GS) encoding
genes: HMW‐GS Ax (A), HMW‐GS Bx (B), HMW‐GS By (C), HMW‐GS Dx (D), HMW‐GS Dy (E). Dark bars represent control conditions and light bars represent high temperature treatment. Negative ΔCt values result from their marked higher expression in relation to reference genes. Means ± SE from five biological replicates. Different letters (control) and numbers (treatment) indicate significant differences between varieties and (*) show statistical differences between control and treatment values (p < 0,05).
Genomic evaluation of puroindoline genes indicate that all commercial varieties used in this work are expected to possess hard kernel, although differences in Pin genes transcript levels may be responsible for differences in grain texture characteristics [25]. Assessed quantification of Puroindoline a and b genes transcripts in control conditions are summarized in Figure 2a and 2b and the results shown that Pina is significantly more expressed in Almansor in comparison with all other varieties. Whereas, Pinb transcription levels were significantly higher in Almansor and Estero only in comparison with Pata Negra.
Figure 2. Transcription levels of Puroindolines a (a) and b (b) and GBSSI (c) encoding genes. Dark
bars represent control conditions and light bars represent high temperature treatment. Negative ΔCt values result from their marked higher expression in relation to the reference genes. Means ± SE from five biological replicates. Different letters (control) and numbers (treatment) indicate significant differences between varieties and (*) shows statistical differences between control and treatment values (p < 0,05).
Granule Bound Starch Synthase I expression levels, related to amylose synthesis in grains, were additionally evaluated and the results are presented in Figure 2c. No significant differences were identified between varieties in the transcription level of this gene which is in accordance with the similar amylose content predict through the genetic characterization of the varieties studied as wild type and partial waxy types 2, 3 and 4 [23].
Altogether these results clearly show that, although no intervarietal diversity was predicted, based on the allelic composition of grain quality related genes, and significant differences were detected, for the first time, in their transcriptional levels between the seven varieties studied. 3.3. High Temperature Differentially Affects the Transcription of Flour Quality Related Genes in Immature Grains
Predicted increasing temperatures can affect several aspects of wheat production, and high temperature peaks during grain filling phase can be particularly detrimental [reviewed in 26]. Thus, we further evaluated the expression levels of HMW‐GS, GBSSI and puroindolines genes in immature grains of plants exposed to HT during grain filling from the 10th to the 17th daa. The average transcription levels in treated plants of each variety are summarized in Figures 1 (HMW‐GS) and 2 (puroindolines and GBSSI).
Although, the comparative analysis between treated and control plants of each variety seem to reveal differential HT effects in the transcript levels of each of the five HMW‐GS genes analyzed, only in Bancal the increase on HMW‐GS Dy gene transcription level induced by HT treatment is significant. The results obtained show moreover that, after HT treatment, the HMW‐GS genes transcripts levels become similar between varieties, markedly contrasting with the variability previously observed in control plants.
Transcription levels of several starch biosynthetic enzymes were shown to be affected by high temperature exposure from anthesis to maturity, reducing starch content, granule size and distribution and duration of starch accumulation [10]. In the present work, however, the HT treatment, which was restricted to one week during grain filling, only induced a significant increase on GBSSI gene transcription in Roxo variety. Nevertheless, as observed in control plants, no significant differences for GBSSI were observed between varieties after HT. Also, Altenbach et al. [9] and Hurkman et al. [10] detected small changes on the levels of HMW‐GS and GBSS transcripts and
the anticipation of transcripts accumulation period in wheat plants from the variety Butte 86 submitted to high temperatures (37/28 °C). In relation to Pina genes associated to grain hardness, transcripts levels of Almansor after HT maintain significantly higher than the ones observed in the other varieties, as observed in control plants. Also, Antequera, Bancal and Estero keep significantly lower transcription levels in relation to those detected in Roxo. Finally, HT treatment in Antequera, Bancal, Nabão and Roxo induces Pinb gene expression levels significantly superior in relation to Pata Negra, that presented significantly lower value in comparison with all other varieties.
This work showed that a short period of high temperature treatment, similar to a heat wave during grain filling, attenuates the differences between varieties observed in transcription levels of HMW glutenin genes in normal conditions. These results were obtained at the end of HT treatment period, which does not invalidate any differences that may occur during the treatment period and must be further studied. 3.4. Comparative Contents of Protein Fractions in Mature Grains Vary between Varieties and with HT Treatment
Wheat grain protein fractions—albumins, globulins, gliadins and glutenins, determinant for grain quality, were quantified spectrophotometrically using Bradford reagent [20] in mature grains from control and HT treated plants.
It has been previously reported that different environmental conditions during grain filling induce alterations in the time course of grain development, modulating final grain weight, protein and starch contents, as well as gluten protein composition. However, these former studies were based on the evaluation of only one bread wheat variety [9–14]. Our results, obtained in different varieties, disclosed heat response variability in terms of seed storage proteins composition. In fact, comparisons of control and HT treated plants (Figure 3a) revealed significant alterations in Almansor and Antequera, which presented significant differences in globulins and glutenins contents, although with opposite effects, both increasing in Antequera and decreasing in Almansor. In turn, Roxo grains from HT treated plants have significantly higher albumin levels.
Figure 3. Grain protein fractions comparative evaluation. (a) Changes in protein fractions levels in
comparison with plants kept in control conditions. (b) Gliadin/glutenin ratios for control and treated plants. Different letters (control) and numbers (treatment) indicate significant differences between varieties and (*) shows statistical differences between control and treatment values (p < 0,05).
It must be emphasized that flour quality for bread making depends on the balance between gliadins and glutenins for the required equilibrium between dough viscosity and elasticity/strength [27]. The value of the gliadin/glutenin (gli/glu) ratio is, therefore, particularly important, being negatively related with dough development and stability [28]. Antequera and Bancal varieties presented significantly higher gli/glu ratios (2.23 and 2.35, respectively), corresponding to poorer dough stability (Figure 3b). The remaining varieties presented significantly lower ratios ranging from 0.89 and 1. Thus, despite of the similar genomic prediction of high quality for all varieties analyzed, both gene transcription levels and protein fraction content disclosed significant differences between varieties.
Several reports have shown that heat stress induces a decrease in glutenin fraction and a relative increase in gliadins [reviewed in 3]. However, our results demonstrate that HT only induces a significant increase in gli/glu ratio in Almansor while in Antequera an inverse effect was detected. Thus, it is expected a reduction of Almansor technological quality after temperature stress and, in turn, an enhancement in Antequera. Balla et al. [29] reported similar diversity between varieties in gli/glu ratio changes caused by diary 8 h at 35 °C during 15 days, imposed 12 days after anthesis. After HT treatment, Bancal is the only variety with a significant higher gli/glu ratio, being the one with predicted inferior quality regarding dough development, compared with all other varieties. Although, it is clearly a marked intervarietal variability in mature grains composition induced by short HT treatments. These results are not in accordance with transcriptional analysis of HMW immediately after HT treatment. This apparent inconsistency suggests that HT may affect other features of plant development, like grain filling duration and particularly HMW‐GS accumulation period, as previously proposed [9,10].
5. Conclusions
Contrary to most previous works developed using only a single bread wheat variety, submitted in continuous long‐lasting heat stress [9–14], in the present work the impact of heat waves was comparatively assessed in seven bread wheat varieties recommended to be produced in Portugal. Besides the similarity of the allelic composition of genes associated to flour technological qualities of the genotypes analyzed, both transcription and protein fraction content evaluations disclosed considerable diversity in heat stress response of the varieties studied. Transcription patterns variability detected between distinct varieties in control conditions was significantly reduced in HT treated plants. On the other hand, the heat impact on mature grain protein‐fractions content and in gliadin/glutenin ratios revealed higher intervarietal diversity. The novelty of the present work contributes to the development of an integrative portrait of the complexity of plant response to thermal constraints, which are essential for planning breeding programs oriented to face the climatic changes. Moreover, the present work leads to future work focused in the development of methodologies to expeditiously evaluate grain quality traits, with limited grain quantity, in order to consolidate the effects heat waves assessed. Supplementary Materials: The following are available online at www.mdpi.com/xxx/s1, Table S1. Primers used for genomic analysis, Table S2. Primers used for Quantitative Real‐Time PCR gene expression analysis. Author Contributions: Conceptualization, M.S.; methodology, D.T. and M.S.; validation, D.T. and M.S.; formal analysis, D.T.; investigation, D.T.; writing—original draft preparation, D.T.; writing—review and editing, W.V. and M.S.; visualization, D.T.; supervision, M.S.; project administration, M.S.; funding acquisition, M.S. All authors have read and agreed to the published version of the manuscript.
Funding: Diana Tomás was funded by a Fundação para a Ciência e a Tecnologia, Portugal (FCT) doctoral
scholarship (SFRH/BD/93156/2013), Manuela Silva by the FCT Investigator Programme (IF/00834/2014) and the research work was financed by FCT LEAF Unit (Linking Landscape, Environment, Agriculture and Food) (UID/AGR/04129/2013).
Acknowledgments: We would like to thank Eng. José Coutinho (INRB/INIAV Portugal) and Eng. Joana Aleixo
(ANSEME Portugal) for the seeds used in the present study. We must also recognize the support of Mónica Ferreira and Mariana Marques on genetic evaluation and protein fractions analysis, respectively, and to Elsa Gonçalves on statistical analysis.
Conflicts of Interest: The authors declare no conflict of interest. References
1. FAO The Cereal Supply and Demand Brief, http://www.fao.org/worldfoodsituation/csdb/en/.
2. Žilić, S.; Barać, M.; Pešić, M.; Dodig, D.; Ignjatović‐Micić, D. Characterization of proteins from grain of different bread and durum wheat genotypes. Int. J. Mol. Sci. 2011, 12, 5878–5894.
3. Branlard, G.; Dardevet, M.; Saccomano, R.; Lagoutte, F.; Gourdon, J. Genetic diversity of wheat storage proteins and bread wheat quality. Euphytica 2001, 119, 59–67. 4. Guzmán, C.; Alvarez, J.B. Wheat waxy proteins: polymorphism, molecular characterization and effects on starch properties. Theor. Appl. Genet. 2016, 129, 1–16. 5. Morris, C.F. Puroindolines: The molecular genetic basis of wheat grain hardness. Plant Mol. Biol. 2002, 48, 633–647. 6. Semenov, M.A.; Shewry, P.R. Modelling predicts that heat stress, not drought, will increase vulnerability of wheat in Europe. Sci. Rep. 2011, 1, 66. 7. Ashraf, M. Stress‐induced changes in wheat grain composition and quality. Crit. Rev. Food Sci. Nutr. 2014, 54, 1576–1583. 8. Blumenthal, C.S.; Barlow, E.W.R.; Wrigley, C.W. Growth Environment and Wheat Quality: the Effect of Heat Stress on Dough Properties and Gluten Proteins. J. Cereal Sci. 1993, 18, 3–21. 9. Altenbach, S.B.; Kothari, K.M.; Lieu, D. Environmental Conditions During Wheat Grain Development Alter Temporal Regulation of Major Gluten Protein Genes. Cereal Chem. 2002, 79, 279–285. 10. Hurkman, W.J.; McCue, K.F.; Altenbach, S.B.; Korn, A.; Tanaka, C.K.; Kothari, K.M.; Johnson, E.L.; Bechtel, D.B.; Wilson, J.D.; Anderson, O.D.; DuPont, F.M. Effect of temperature on expression of genes encoding enzymes for starch biosynthesis in developing wheat endosperm. Plant Sci. 2003, 164, 873–881. 11. DuPont, F.M.; Hurkman, W.J.; Vensel, W.H.; Chan, R.; Lopez, R.; Tanaka, C.; Altenbach, S.B. Differential accumulation of sulfur‐rich and sulfur‐poor wheat flour proteins is affected by temperature and mineral nutrition during grain development. J. Cereal Sci. 2006, 44, 101–112.
12. DuPont, F.M.; Hurkman, W.J.; Vensel, W.H.; Tanaka, C.; Kothari, K.M.; Chung, O.K.; Altenbach, S.B. Protein accumulation and composition in wheat grains: Effects of mineral nutrients and high temperature.
Eur. J. Agron. 2006, 25, 96–107.
13. Zhang, Y.; Pan, J.; Huang, X.; Guo, D.; Lou, H.; Hou, Z.; Su, M.; Liang, R.; Xie, C.; You, M.; Li, B. Differential effects of a post‐anthesis heat stress on wheat (Triticum aestivum L.) grain proteome determined by iTRAQ.
Sci. Rep. 2017, 7, 1–11.
14. Yang, F.; Jørgensen, A.D.; Li, H.; Søndergaard, I.; Finnie, C.; Svensson, B.; Jiang, D.; Wollenweber, B.; Jacobsen, S. Implications of high‐temperature events and water deficits on protein profiles in wheat (Triticum aestivum L. cv. Vinjett) grain. Proteomics 2011, 11, 1684–1695.
15. Organization, W.‐W. M. Guidelines on the definition and monitoring of extreme weather and climate events‐Draft Version‐first review by TT‐DEWCE; 2015.
16. Cardoso, R.M.; Soares, P.M.M.; Lima, D.C.A.; Miranda, P.M.A. Mean and extreme temperatures in a warming climate : EURO CORDEX and WRF regional climate high‐resolution projections for Portugal.
Clim. Dyn. 2019, 52, 129–157. 17. ANPOC.; INIAV.; IpBeja; Ceres; Germen; Cerealis. Lista de Variedade Recomendadas de Trigo Mole; Lisboa, 2014. 18. Paolacci, A.R.; Tanzarella, O.A.; Porceddu, E.; Ciaffi, M. Identification and validation of reference genes for quantitative RT‐PCR normalization in wheat. BMC Mol. Biol. 2009, 10, 11. 19. Lookhart, G.; Bean, S.R. Separation and Characterization of Wheat Protein Fractions. Cereal Chem. 1995, 72, 527–532.
20. Bradford, M.M. A rapid and sensitive method for the quantitation of microgram quantities of protein utilizing the principle of protein‐dye binding. Anal. Biochem. 1976, 72, 248–254.
21. Payne, P.I.; Nightingale, M.A.; Krattiger, A.F.; Holt, L.M. The relationship between HMW glutenin subunit composition and the bread making quality of British grown wheat varieties. J. Sci. Food Agric. 1987, 40, 51– 65. 22. Rasheed, A.; Xia, X.; Yan, Y.; Appels, R.; Mahmood, T.; He, Z. Wheat seed storage proteins: Advances in molecular genetics, diversity and breeding applications. J. Cereal Sci. 2014, 60, 11–24. 23. Nakamura, T.; Vrinten, P.; Saito, M.; Konda, M. Rapid classification of partial waxy wheats using PCR‐ based markers. Genome 2002, 45, 1150–1156. 24. Bowden, P.; Edwards, J.; Fergson, N.; McNee, T.; Manning, B.; Raoberts, K.; Schipp, A.; Schulze, K.; Wilkins, J. Wheat Growth & Development; White, J.; Edwards, J., Eds.; NSW Department of Primary Industries: Orange, Australia, 2007.
25. Igrejas, G.; Gaborit, T.; Oury, F.‐X.; Chiron, H.; Marion, D.; Branlard, G. Genetic and Environmental Effects on Puroindoline‐a and Puroindoline‐b Content and their Relationship to Technological Properties in French Bread Wheats. J. Cereal Sci. 2001, 34, 37–47.
26. Farooq, M.; Bramley, H.; Palta, J. a.; Siddique, K.H.M. Heat Stress in Wheat during Reproductive and Grain‐ Filling Phases. CRC. Crit. Rev. Plant Sci. 2011, 30, 491–507.
27. Dhaka, V.; Khatkar, B.S. Effects of gliadin/glutenin and HMW‐GS/LMW‐GS ratio on dough rheological properties and breadmaking potential of wheat varieties. J. Food Qual. 2015, 38, 71–82.
28. Barak, S.; Mudgil, D.; Khatkar, B.S. Relationship of gliadin and glutenin proteins with dough rheology, flour pasting and bread making performance of wheat varieties. LWT‐Food Sci. Technol. 2013, 51, 211–217. 29. Balla, K.; Rakszegi, M.; Li, Z.; Békés, F.; Bencze, S.; Veisz, O. Quality of winter wheat in relation to heat and drought shock after anthesis. Czech. J. Food Sci. 2011, 29, 117–128. © 2020 by the authors. Licensee MDPI, Basel, Switzerland. This article is an open access article distributed under the terms and conditions of the Creative Commons Attribution (CC BY) license (http://creativecommons.org/licenses/by/4.0/).