Relatório Final de Estágio
Mestrado Integrado em Medicina Veterinária
Antibiotic effect of Manuka Honey on Staphylococcus
pseudintermedius biofilms
Luís Ferreira Sousa
Orientador
Paulo Martins da Costa Co-Orientadora Rowena Jenkins
Relatório Final de Estágio
Mestrado Integrado em Medicina Veterinária
Antibiotic effect of Manuka Honey on Staphylococcus
pseudintermedius’ biofilms
Luís Ferreira Sousa
Orientador
Paulo Martins da Costa Co-Orientadora Rowena Jenkins
ABSTRACT
Staphylococcus pseudintermedius is a common bacterial pathogen of pets associated with skin
infections, that in 2006 was discovered to be able to infect humans and cause serious health conditions. This zoonotic potential, associated with a capacity to acquire and express antibiotic resistances and, most importantly for this study, the ability to form biofilms, makes it a strong cause for concern in both veterinary and human medicine.
Medical grade manuka honey has been used to treat surface wounds as well as skin infections, with demonstrated antimicrobial effect over Staphylococcus aureus and Pseudomonas
aeroginosa.
With these two premises in mind, the goal of this study was to demonstrate that the same antimicrobial effect would be observable over biofilm-producing S. pseudintermidius, across 20 clinically isolated isolates from dogs. To perform this assessment, three methods of data collection were chosen: crystal violet staining, Live/Dead Staining and Scanning Electron Microscopy. Respectively, these technics were used to measure biomass reduction, viability and morphology.
Our results showed that across all isolates there was a general reduction in biomass and a massive decrease in viability. Unfortunately, we were unable to gather data on the morphology. Nevertheless, we were able to conclude that manuka honey does in fact have antimicrobial properties over S. pseudintermedius, even in the presence of mature biofilms.
ACKNOWLEDGMENTS
During my stay at Swansea University I had the opportunity to work along side a
multidisciplinary team of scientists, from geneticists to microbiologists, allowing me to develop an interesting set of laboratory skills, as well as a deeper dive into the ins and outs of the scientific process. I was able to both assist and perform a variety of tests and methods that now enhance my own research abilities. For a brief period of time I also had the pleasure to work with the University of Cardiff, and the Cardiff Metropolitan University.
While this report will focus on my work with manuka honey and biofilm formation, I’d like to emphasise what will be left out. I’d like to note that I’ve help a fellow colleague on his PhD, by using viability tests with an unknown garlic based compound using resazurin staining, as well as following along with a study on the invasiveness of Campylobacter in chickens.
This opportunity to work on a lab with people from multiple backgrounds in microbiology and biochemistry was very important for my understanding of what goes on the scientific research world. It also put on display what I think is the most important role a veterinary doctor can play in these circumstances: the capacity (hopefully) to integrate what is the cutting edge of science with the actual reality of the clinical world. This is even more true when talking about
microbiology that touches multiple fields, specially in the case of zoonotic organisms, like the one that I focused my time on.
I’d also like to take this opportunity to thank everyone that made my journey possible, both throughout all the years of this degree and in this final stage of it. A thank you to my parents for paying for it and for not sugar coating life, and a thank you to my sister for showing me that success can be often achieved in several different ways.
I also owe a big thank you to my co-coordinator, Rowena, for making my life easy by being amazing at coordinating my experiments and entrusting me with her lab, and to Phil for the role model of how a true scientist works. And both of them for the car rides.
Lastly I have to thank Filipa, for being my life partner during all the trials and tribulations and a source of support and great advice.
C
ONTENTS Abstract ... iiAcknowledgments ... iii
Abbreviations ... v
Introduction ... 2
Clinical Significance of S. pseudintermedius ... 4
The Biofilm Problem ... 5 Manuka Honey and its Antimicrobial Potential ... 7
Methods ... 8
Disruption of S. pseudintermedius biofilms by manuka honey ... 8
Specimen Colony Growth and Biofilm production set up ... 8 Crystal Violet Staining ... 9 Live/Dead (L/D) Staining ... 11 Scanning Electron Microscopy ... 12 Results ... 15
Discussion ... 21
Conclusion ... 23
References ... 24
Table of Tables and Figures ... 27
ABBREVIATIONS
ABS Absorbance
CFU Colony Forming Units
DH2O Deionized Water
g grams
L/D Live/Dead
MHA Mueller-Hinton Agar
MHB Mueller-Hinton Broth
mL millilitres
mm millimetres
MRSA Methicillin Resistant S. aureus
nm namometers
ºC Degrees Celsius
OsO4 osmium tetraoxide
PBS phosphate-buffered saline
SEM Scanning Electron Microscopy
W/V weight per volume
INTRODUCTION
It is known that Staphylococcus pseudintermedius is a common cause of skin infections in dogs (Bannoehr & Guardabassi, 2012). It also has a significant zoonotic potential, first reported in humans in 2006, causing serious opportunistic infections (Hoovels, et al., 2006). This exceptional status among biofilm-associated pathogens is due to the emergence of multidrug-resistance associated with a wide range of virulence factors. During the last decade, there has been an increasing awareness of the potential problems that selection for antimicrobial resistant bacteria among companion animals may cause on human health, due to the increasing utilization of the same antimicrobial substances in human medicine and to the close contact between pets and their human co-habitants (Martins, et al., 2015).
This steady increase in antimicrobial resistance over time propels the search for new compounds and molecules that might be used as therapies for cases where the commonly used antibiotics fail. This comes with a massive problem, because the pharmaceutical industry does not consider the research of new antibiotic molecules to be a profitable path to take. This comes at no surprise when we consider that these treatments are used for short periods of time, are often low cost and their use is restricted by the fact that microbes will become resistant to these new molecules, so using them sparsely is advisable. This means that the economic appeal of this research is virtually non-existent, with 80% of companies abandoning the field (Ventola, 2015).
With that in mind, looking for naturally occurring alternative therapies is extremely important. From historical sources we know that humans have been using natural honey as a form of medicine for more than 8000 years, and with a reported inhibitory effect over more than 60 species of bacteria, fungi and viruses. These effects come from a variety of different substances in its complex chemical composition, from antioxidant power to peptides, organic acids, phenols, enzymes and products of Maillard reactions (Eteraf-Oskouei & Najafi, 2013).
Manuka honey in particular has been shown to inhibit many bacterial pathogens, including
Methicillin Resistant S. aureus, and is successfully used in clinical practice for the treatment of surface wounds and wound dressing (Jenkins, et al., 2011). It has been recognized that manuka honey can act synergistically when combined with antibiotics against S. aureus and P. aeruginosa in vitro. (Cooper & Jenkins, 2012) This specific kind of honey is of great interest because it has the highest known concentration of methylglyoxal, the compound that, as far as we know, is
The research group I had the pleasure of cooperating had already published on the usage and the inhibitory effect of manuka honey over bacteria, like S. aureus and P. aeruginosa, and was working at the time to determine the ability of manuka honey to inhibit S. pseudintermedius growth alone and in combination with antibiotics, as well to determine its capacity to modulate virulence within S. pseudintermedius.
My part in this study was to determine the effectiveness of manuka honey in the reduction of biofilms after their formation, what would have the implications on the capacity to treat chronic infections and possible use for prevention on surgical sites.
Biofilms can be the causes of chronic infections in patients, forcing more aggressive therapies and sometimes even requiring surgery to remove. Most biofilms require treatment with an antibiotic concentration at least four times higher than those used to eliminate planktonic cell infections (Pompilio, et al., 2015).
In order to monitor biofilm disruption and inhibition of growth a variety of methods and techniques can be used to measure bio-mass, viability and total cell count.
Our research group focused on 20 isolates of S. pseudintermedius obtained from infections in cats and dogs with possible zoonotic potential, inferred from their earlier work. We selected crystal violet staining to determine reduction in biomass, fluorescent staining to determine viability and scanning electron microscopy for cell counts and morphology.
CLINICAL SIGNIFICANCE OF
S.
PSEUDINTERMEDIUSS. pseudintermedius is one of the younger members of the Staphylococcus genus, being
described as its own species only in 2005 with the first reported case in humans in 2006 (Hoovels, et al., 2006). Like other members of this group of gram-positive cocci, S. pseudintermedius are capable of producing coagulase, DNAse and beta-haemolysin (Devriese, Vancanneyt, & Baele, 2005).
S. pseudintermedius is now known as one of the leading causes of skin, ear, and post-operative
bacterial infections in pets, specially in dogs, where it is thought to be a presence in the skin of up to 90% of them (Joseph E. Rubin, 2011); in addition, it has been identified in other pets like cats and horses. As in other bacterial skin infections, the symptoms are non-specific, consisting of mainly pustules, scaling, hair loss and redness.
Because of the cohabitation between dogs and humans, zoonotic infections have been reported in increasing numbers over the course of the last decade and it is now known to be able to cause, soft tissue infections, infection of surgical wounds, rhinosinusitis, and catheter-related bacteraemia (Somayaji, et al., 2016).
As these bacteria have been studied it was discovered that, when associated to wounds, S.
pseudintermedius is able to create biofilms. These biofilms make infections much harder to treat.
One potential reason for this increased resistance is the penetration barrier that biofilms may present to antimicrobials. This biofilm production is consistent with the common diseases that they end up causing, generally chronic where treatment is very ineffective, which indicates some level of correlation between them (Pompilio, et al., 2015).
Furthermore, S. pseudintermedius is often difficult to distinguish from S. intermedius and S.
aureus, that as we know is one of the most important hospital infection pathogens, known to be
able to become resistant to a multitude of antibiotics. In this regard, methicillin resistant strains (MRSA) are specially important. This means that there is a high likelihood of S. pseudintermidius having similar capacity to achieve resistance (van Duijkeren, et al., 2011).
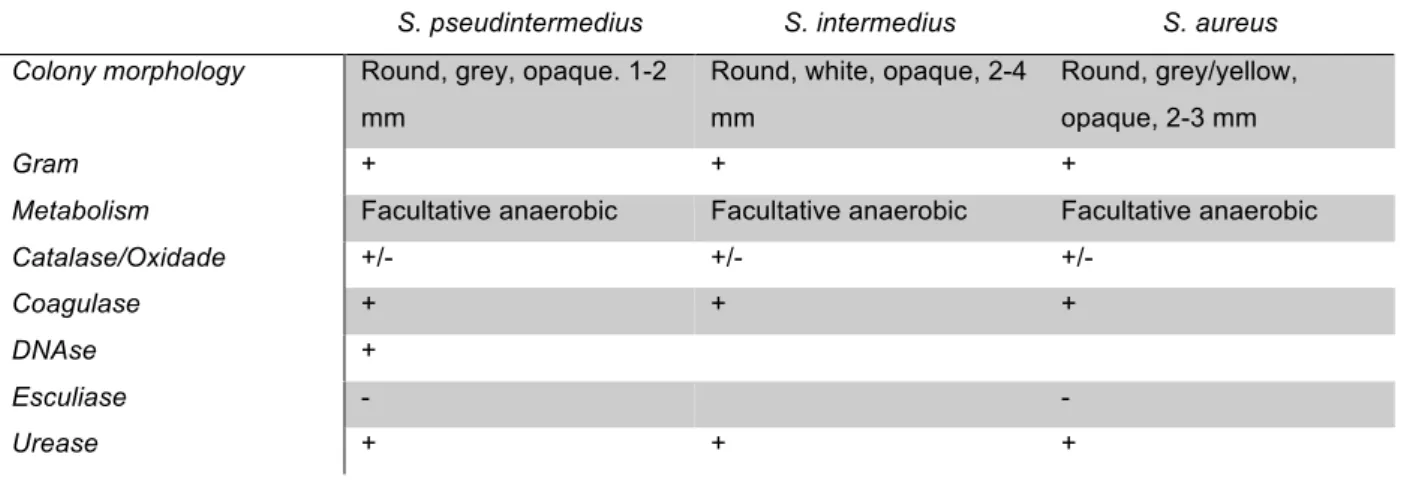
Table 1: Some biochemical characteristics of Staphylococcus coagulase positive species.
S. pseudintermedius S. intermedius S. aureus Colony morphology Round, grey, opaque. 1-2
mm
Round, white, opaque, 2-4 mm
Round, grey/yellow, opaque, 2-3 mm
Gram + + +
Metabolism Facultative anaerobic Facultative anaerobic Facultative anaerobic
Catalase/Oxidade +/- +/- +/-
Coagulase + + +
DNAse +
Esculiase - -
Urease + + +
With such similar biochemical properties, to differentiate between these species, purple agar with maltose is generally used since S. pseudintermedius is negative or weakly positive for this carbohydrate when under aerobic conditions on agar plates (Franklin, 2006; Olsson Ranta, 2004; Persson, 2002; Devriese, 2005).
The Biofilm problem
A biofilm is defined as a community of bacterial cells that become irreversibly attached to biological or environmental surface, producing a matrix of polysaccharide material, but also containing other materials, both biological in nature or gathered from their surroundings (Donlan R. M., 2002). These structures (created by a mechanism of quorum sensing) increase the ability of bacterial cells to survive adverse conditions, creating a physical barrier between the community and the environment, protecting the cells from the host’s immune response and from possible antibiotic therapies. The mechanisms by which a microorganism uses biofilms to acquire antimicrobial resistances can be intrinsic to the particular species or be acquired (e.g. plasmid). The polysaccharide matrix decreases the diffusion rate of antibiotics, both by physically stopping their movement and by reacting with the active substances. Furthermore, cells within biofilms often have lower replication rates, leading to a decreased uptake of antimicrobial compounds by cells. Lastly, the cells biochemical processes are altered within biofilms, affecting the mechanism of action of antimicrobial compounds (Donlan R. M., 2001).
Biofilms also facilitate the creation of nutrient gradients and the genetic exchange (Donlan R. M., 2002). The acquisition of resistances from plasmids in the environment is also a strong factor to be considered, since biofilms make it easier for bacteria to conjugate, both because of environmental stability and because of increased cell contact and proximity (Donlan R. M., 2001).
In the specific case of Staphylococcus infections, genetic testing has showed that species, like S.
aureus and S. epidermidis, have all the necessary genes to create biofilms and perform horizontal
gene transfer while equipped with antimicrobial resistance genes (Águila-Arcos, et al., 2016). All these characteristics of biofilms make them a very important problem in surface hygiene, medical equipment and chronic infections, added to the fact that standard broth micro-dilution techniques to test antimicrobial resistances will not accurately predict their efficiency against biofilms (Donlan R. M., 2001).
M
ANUKAHONEY AND ITS ANTIMICROBIAL POTENTIAL
The manuka bush, also known as the western tea tree is a plant indigenous to New Zealand that was imported from Australia, home to at least other 80 other related species. Manuka honey is, as the name implies, produced by honeybees foraging on the nectar of manuka bushes. For a long time, the exact components responsible for the antibiotic properties were unknown, but we know now that the most likely culprit for most of its effects is methylglyoxal, a by-product of glycolysis (Henle, et al., 2008). Manuka honey demonstrates a antibiotic potential over a wide range of pathogens associated with wound infections, and has shown that effect on both antibiotic susceptible and resistant isolates with comparable efficiency (Cooper, et al., 2002).
In S. aureus, with particular importance in the case of MRSA, the antibiotic effect of manuka honey is linked to the interruption of cell division, where the daughter cells are unable to separate from each other leading to bi-lobed cells with fully formed cross-walls. This is caused by the loss of activity of some autolysins that the bacteria uses to cleave the peptidoglycan in its walls (Henriques A, 2009; Jenkins R E, 2011). Furthermore, manuka honey also appears to down-regulate stress proteins, making the cells more sensitive to environment changes and less capable of adaption to new conditions (Jenkins, et al., 2011). Manuka honey has also been used in MRSA infections to reverse the resistance to oxacillin (Jenkins RE, 2012).
With such a vast array of inhibitory effects, everything indicates that manuka honey is a good candidate for usage in cleaning and also preventing open wound infections, and has already been proved to work on several human patients for conditions like a leg ulcer (Natarajan S & D, 2001), diabetic foot ulcers (Eddy JJ, 2005), maxillofacial wounds (Visaveda, Honeysett, & Danford, 2008) and even paediatric oncology patients (Blaser, et al., 2007).
There is also another factor that we should take into account. Every time a new molecule is introduced and used in clinical therapies, there is a high likelihood of resistances to emerge, with the only real difference being the time that it takes for those resistances to manifest themselves. With such a variety of different antimicrobial effects, targeting such a wide range or biochemical processes, the likelihood that bacteria could become resistant to honey is very low, and as far as current training experiments indicate, there isn’t a selection for honey-resistant mutants (Cooper, et al., 2010).
MATERIALS AND METHODS
DISRUPTION OF
S.
PSEUDINTERMEDIUS BIOFILMS BY MANUKA HONEYSpecimen Colony Growth and Biofilm production set up
To assess the inhibitory effect of manuka honey, 20 clinical isolates of S. pseudintermedius isolated from the skin of dogs from several clinical partners of the University of Swansea and the Cardiff Metropolitan University. For confidentiality reasons, I was not provided with any further detail regarding the clinical case of any of those patients. The isolates are referred to with the letters A, B, C, D, E, F, G, H, I, J, K, L, M, N, O, P, Q, T, U and X.
The materials used for this stage were Mueller-Hinton broth (MHB) and Mueller-Hinton agar (MHA), prepared in the concentrations advised by the manufacturer. Various pipette tips, plastic petri dishes, sterile phosphate buffered saline (PBS), sterile plastic petri dishes, 10ul plastic inoculation loops, 96 well plates, Cryobeads and falcon tubes were also needed.
The bacterial samples used were retrieved from Cryobeads stored at -80ºC.
Honey solutions were prepared using MediHoneyTM manuka honey at 10%, 20%, 30%, 40% and 50% weight per volume (w/v) concentrations. To obtain a 10% w/v manuka honey solution, 10g honey was weighed into a sterile falcon tube then sterile MHB was added up to the 100 ml mark on the tube. The tube was sealed and shaken until the honey was fully mixed in. If it was too hard to dissolve, a warm water bath could be used, but I that was never the case during the experiment. The method used worked on a 3-day timeline. On day one, bacterial isolates were obtained from -80ºC freezer. A sterile plastic pipette tip was used to remove one Cryobead from the container. The bead was carefully rolled on the surface of the MHA plate ensuring the creation of a large inoculum. Once this step finished, a sterile plastic loop was used to streak for single colonies. Alternatively, the bead could have been placed directly into 5mL of sterile MHB rather than a plate, however, if using this technique, the solution should be gram stained or streak onto solid agar after incubation to ensure bacterial purity. Inoculated plates were then incubated at 37ºC for 24-48 hours to ensure a high quantity and quality of growth.
On the second day, the inoculated plates were checked to ensure that the growth was suitable and pure (if necessary single colonies could have been isolated for gram staining to ensure purity of cultures, which we did not deem necessary) and a sterile plastic loop was used to touch 3-4
To ensure accurate preparation of bacterial suspension, spectrophotometry was used. The spectrophotometer was set to 600nm for all samples and it was blanked with a 1cm cuvette containing 1mL of sterile MHB.
Once the machine was set to 0, the optical density of the bacterial suspension was checked and it should be equal to 0.08-0.1 Absorbance (ABS) as this value is equal to a 0.5 McFarland Standard or 10^8 CFU/mL. When the absorbance was low, the concentration was increased by adding additional bacteria via sterile plastic loop. On the other hand, the solution could be further diluted using sterile MHB, if the absorbance was high. This can also be done by further dilution of original inoculum.
For the next step, a 96 well plate was prepared and 100 μL of sterile broth was pipetted in a sterile fashion into the required wells on the plate. Then, 100 μl of the previously prepared 0.5 Macfarlane standard bacterial suspension was inoculated into all wells that were required on the 96 well plate.
A series of wells were left bacteria free to serve as a negative control, these wells were also inoculated last with an additional 100 μL of sterile MHB.
The plates were then left to incubate for 48 hours at 37ºC, with a replacement of media at the 24h mark.
On the third day and once the desired time had passed, the biofilm development was visually confirmed. Wells with biofilm appeared turbid and the negative control wells showed up clear. A multi-channel pipette was used to remove all the liquid from inside the wells of the well plate, making sure that the process was performed in a very careful manner not to compromise the integrity of the biofilm.
Once empty, the wells were carefully washed twice with 200μl of PBS and then all liquid from the wells was removed, washing with it all traces of broth and planktonic cells.
All the biofilms to be tested were then inoculated with solutions containing the desired concentrations of 10%, 20% ,30% ,40% and 50% of honey and sterile MHB.
The first set of wells was kept honey free as a positive control and the last well row was kept bacteria free as a negative control.
Plates were then incubated for 18 to 20 hours at 37ºC (EUCAST, 2003).
Crystal Violet Staining
Cells tend to detach from the well walls as they die and this characteristic can be used for the indirect quantification of cell death and to determine differences in proliferation upon stimulation with antimicrobial compounds. One method to detect maintained adherence and biomass of cells
washing stages of the procedure, reducing the amount of crystal violet in the sample (O'Toole, 2011).
The materials used at this stage were the pre-prepared inoculated 96 well plates, various pipette tips, plastic petri dishes, PBS, 0.1% Crystal Violet solution, (200μl of 20% Crystal Violet and 39.8mL of sterile deionized water (DH2O)), 7% acetic acid (2.8mL of glacial acetic acid and
37.2mL of sterile DH2O), and 99% pure methanol.
At this stage the pre-established biofilm was treated with concentrations of honey and the effects were measured by first removing all planktonic cells and growth media. Using a multi-channel pipette, all the liquid from inside the wells of the well plate was carefully removed, making sure to keep the biofilm integrity. Once empty, each well was carefully washed twice again with 200 μl of PBS using a multi-channel pipette, aspirating all liquid from the wells after washing to remove all traces of broth and planktonic cells. Then, each well was filled with 200 μl of methanol and incubated at room temperature for 30 minutes, this process ensured that the biofilms were fixated to the plate. After that time, we proceeded to remove the residual methanol from each well and allow it to air dry further for 30 minutes. Next, each well was filled with 200 μl of 1% Crystal Violet solution and incubated at room temperature for another 15 minutes, after which the solution was aspirated from all the wells, removing as much as possible. Each well was then washed twice with 200 μl of PBS, aiming to remove as much dye and planktonic cells as possible. If it was necessary, the washing step was repeated up to 3 times. At this point, the biofilm was fixated and less prone to disruption via pipetting, but care was still taken. The last processing stage was to add 200 μl of 7% Glacial acetic acid to each well and then let the plates incubate for 15 minutes at room temperature. The final step was reading the plates on the Nanostar Plate Reader set to a wavelength of 570nm (O'Toole, 2011).
Figure 1. Set up and materials of crystal violet staining.
Live/Dead (L/D) Staining
The kit we used, LIVE/DEAD BacLightTM Bacterial Viability, utilizes mixtures of SYTO® 9
green-fluorescent nucleic acid stain and the red-green-fluorescent nucleic acid stain propidium iodide. These stains differ in their spectral characteristics and in their ability to penetrate healthy bacterial cells making it a good method to differentiate viable cells from dead ones. The SYTO® 9 dye stains all bacteria in a population whether they possess intact membranes or damaged membranes. In opposition, propidium iodide is only capable of penetrating bacteria with damaged membranes, causing a reduction in the SYTO® 9 fluorescence when both dyes are present. Because of these characteristics, an appropriate mixture of the SYTO® 9 and propidium iodide dyes will stain bacteria with intact cell membranes fluorescent green, and bacteria with damaged membranes fluorescent red.
For this stage the materials needed were the staining kit “L7007 LIVE/DEAD® BacLightTM
Bacterial Viability Kit for microscopy”, PBS and 24 well plates that were prepared by following the same method for colony growth as the 96 well plates referred in the first protocol of this chapter, with the addition of a glass slip to the bottom of each well. Using a multi-channel pipette, we started by carefully removing all the liquid from inside the wells of the well plate, in order to keep the biofilm integrity preserved. Once empty, each well was washed twice and very carefully with 1ml of PBS using a single channel pipette, aspirating all liquid from the wells after the washing to
Then, equal volumes of Component A, the SYTO® 9 dye, and Component B, propidium iodide were combined and mixed thoroughly in a microfuge tube. Next, it was supposed to add 3 μL of the dye mixture per mL of the bacterial suspension but, since we were working with biofilm, we added 20 μL to each well, that was enough to cover the slip at the bottom, where the biofilms we were interested in had formed. After mixing thoroughly again, we incubated them at room temperature in the dark for 15 minutes. After that the glass slip was taken out of each well and put it on top of a glass slide, covering it with a glass lamella. Finally, we observed the samples in a fluorescence microscope, taking 5 representative pictures of each of them, at a magnification of 200 times (Molecular Probes, 2004).
Figure 2. Layout of 24-well plates for L/D and SEM
Scanning Electron Microscopy
In scanning electron microscope (SEM), a type of electron microscope is used that produces images of a sample by scanning the surface with a focused beam of electrons. These electrons will interact with the atoms in the sample, producing various signals that contain information about the sample topography and, depending on the method used, even composition. The electron beam is scanned in a raster scan pattern, and the beam's position is combined with the detected signal to produce an image, making it capable of achieving resolutions in the order of 1 nm.
We used conventional high vacuum SEM for our experiment, but low vacuum, wet conditions, variable pressure and environmental SEM, at a wide range of very low or very high temperatures is also possible with the right specialized instruments.
Biological samples however are not very good at reflecting focused electron beams, so a metal, in this case gold, coating is needed to ensure that the sample is able to produce the right kind of electron scatter.
Materials needed for this method were 3% glutaraldehyde at 37ºC, PBS, 1% Osmium tetraoxide (OsO4),1% carbohydrazide, distilled water, a graded series of ethanol at 30%, 50%, 70%, 90%
and 100% and a 24 well plate prepared previously following the same method used for the L/D. Using a multi-channel pipette, we started by carefully removing all the liquid from inside the wells of the well plate, preserving the biofilm integrity. Once empty, each well was washed twice and very carefully with 1 mL of PBS using a single channel pipette, aspirating all liquid from the wells after washing to remove all traces of broth and planktonic cells. At the next step OsO4 was added
to each well, enough to cover the glass slip, and then they were let to incubate at room temperature for 30 minutes. After the desired time had passed, the wells were rinsed slowly with PBS, up to 5 times when required. Carbohydrazide at 1% was then added, and once again they were let to incubate at room temperature for another 30 minutes.
When the previous incubation was done, all the wells were rinsed with distilled water up to 5 times and 1% OsO4 was added and once again left to incubate at room temperature for 30 minutes.
Following the last incubating period, another rinse was needed, using distilled water up to 3 times. The last step before drying was dehydration by progressively increasing ethanol concentrations. With starting concentrations of 30% and increasing it to solutions of 50%, 70%, 90%, and three times 100%, and waiting 3 to 5 minutes between them.
When the sample was properly fixed and dehydrated, it was let to dry. Then the glass slip that had been placed at the bottom of each well was removed, being very careful not to break them because the dehydration processed tended to make them very prone to stuck to the plate, and placed on top of SEM stubs. The SEM stubs were loaded into a sputter and coated with 1-2 nm of a gold-palladium alloy. When the stubs were ready, they were loaded into the microscope itself. The SEM chamber was first vented, and the chamber was allowed to reach nominal pressure indicated by a gauge on screen. The SEM sample compartment was opened and the sample stage was taken out, all the samples were loaded into it (7 samples could be loaded at any given time), and the screws were tightened up to secure the stubs to the stage. If all the 7 stub spaces were used, the centre sample was loaded in first place, because it’s easier to tighten the centre screw, if no other sample is loaded at the time. The sample stage was put back into the sample
Finally, the pumps were turned on and the system allowed to reach vacuum. The microscope was then ready to be used, taking 3 to 5 representative pictures from each stub (Fischer, et al., 2012).
RESULTS
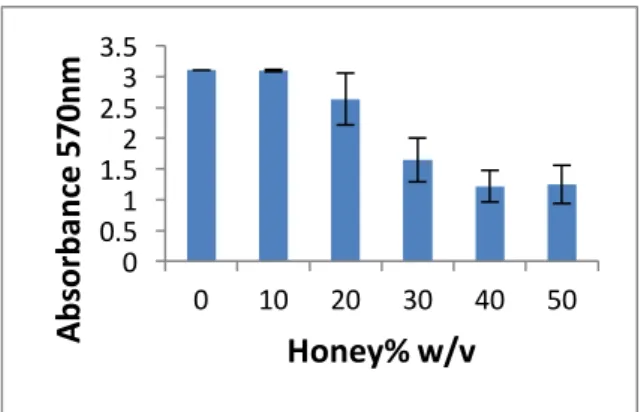
The below graphs show the variance in absorbance as the percentage of w/v of honey increases. This value was proportional to the amount of biomass stained by the crystal violet. All the 20 isolates showed a reduction in biomass, but the strength of the effect was highly dependent on the isolate. The mean reduction for biomass seems to peak at a concentration of 40% of honey, while a 10% honey concentration was actually detrimental to reduction as shown.
Figure 3: Relationship between honey concentration
and absorbance for S. pseudintermedius’ sample A.
Figure 4: Relationship between honey concentration
and absorbance for S. pseudintermedius’ sample B.
Figure 5: Relationship between honey concentration
and absorbance for S. pseudintermedius’ sample C.
Figure 6: Relationship between honey concentration
and absorbance for S. pseudintermedius’ sample D. 0 0.51 1.52 2.53 3.5 0 10 20 30 40 50
Ab
so
rb
an
ce
5
70
nm
Honey% w/v
0 0.51 1.52 2.53 3.5 0 10 20 30 40 50Ab
so
rb
an
ce
5
70
nm
Honey% w/v
0 0.51 1.52 2.53 3.5 0 10 20 30 40 50Ab
so
rb
an
ce
5
70
nm
Honey% w/v
0 0.51 1.52 2.53 3.5 0 10 20 30 40 50Ab
so
rb
an
ce
5
70
nm
Honey% w/v
Figure 7: Relationship between honey concentration
and absorbance for S. pseudintermedius’ sample E.
Figure 8: Relationship between honey concentration
and absorbance for S. pseudintermedius’ sample F.
Figure 9: Relationship between honey concentration
and absorbance for S. pseudintermedius’ sample G.
Figure 10: Relationship between honey concentration
Figure 11: Relationship between honey concentration
and absorbance for S. pseudintermedius’ sample I.
Figure 12: Relationship between honey concentration
and absorbance for S. pseudintermedius’ sample J.
Figure 13: Relationship between honey concentration
and absorbance for S. pseudintermedius’ sample K. 0 0.51 1.52 2.53 3.5 0 10 20 30 40 50
Ab
so
rb
an
ce
5
70
nm
Honey% w/v
0 0.51 1.52 2.53 3.5 0 10 20 30 40 50Ab
so
rb
an
ce
5
70
nm
Honey% w/v
0 0.51 1.52 2.53 3.5 0 10 20 30 40 50Ab
so
rb
an
ce
5
70
nm
Honey% w/v
0 0.51 1.52 2.53 3.5 0 10 20 30 40 50Ab
so
rb
an
ce
5
70
nm
Honey% w/v
0 0.51 1.52 2.53 3.5 0 10 20 30 40 50Ab
so
rb
an
ce
5
70
nm
Honey% w/v
0 0.51 1.52 2.53 3.5 0 10 20 30 40 50Ab
so
rb
an
ce
5
70
nm
Honey% w/v
0 0.51 1.52 2.53 3.5 0 10 20 30 40 50Ab
so
rb
an
ce
5
70
nm
Honey% w/v
0 0.51 1.52 2.53 3.5 0 10 20 30 40 50Ab
so
rb
an
ce
5
70
nm
Honey% w/v
Figure 15: Relationship between honey concentration
and absorbance for S. pseudintermedius’ sample M.
Figure 16: Relationship between honey concentration
and absorbance for S. pseudintermedius’ sample N.
Figure 17: Relationship between honey concentration
and absorbance for S. pseudintermedius’ sample O.
Figure 18: Relationship between honey concentration
and absorbance for S. pseudintermedius’ sample P.
Figure 19: Relationship between honey concentration
and absorbance for S. pseudintermedius’ sample Q.
Figure 20: Relationship between honey concentration
and absorbance for S. pseudintermedius’ sample T.
Figure 21: Relationship between honey concentration
and absorbance for S. pseudintermedius’ sample U.
Figure 22: Relationship between honey concentration
and absorbance for S. pseudintermedius’ sample X. 0 0.51 1.52 2.53 3.5 0 10 20 30 40 50
Ab
so
rb
an
ce
5
70
nm
Honey% w/v
0 0.51 1.52 2.53 3.5 0 10 20 30 40 50Ab
so
rb
an
ce
5
70
nm
Honey% w/v
0 0.51 1.52 2.53 3.5 0 10 20 30 40 50Ab
so
rb
an
ce
5
70
nm
Honey% w/v
0 0.51 1.52 2.53 3.5 0 10 20 30 40 50Ab
so
rb
an
ce
5
70
nm
Honey% w/v
0 0.51 1.52 2.53 3.5 0 10 20 30 40 50Ab
so
rb
an
ce
5
70
nm
Honey% w/v
0 0.51 1.52 2.53 3.5 0 10 20 30 40 50Ab
so
rb
an
ce
5
70
nm
Honey% w/v
0 0.51 1.52 2.53 3.5 0 10 20 30 40 50Ab
so
rb
an
ce
5
70
nm
Honey% w/v
0 0.51 1.52 2.53 3.5 0 10 20 30 40 50Ab
so
rb
an
ce
5
70
nm
Honey% w/v
On average, the reduction in biomass was of -11,16% (which corresponds to an actual increase), 14,25%, 35,37%, 44,22% and 42,86% for honey concentrations of 10%, 20%, 30%, 40% and 50%, respectively. This is illustrated in Figure 23, where the tendency curve was obtain from the averages of all samples using a logarithmic regression.
Figure 23: Average of Biomass Reduction across all 20 isolates
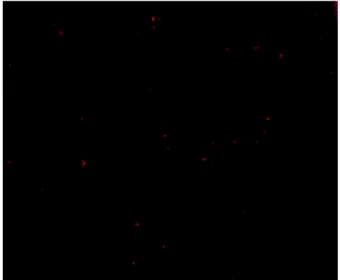
The following images show the results from the L/D staining, where green detonates viable, living bacterial cells, and red represents dead, unviable bacterial cells. The first thing that was easily noted was the decrease in cellularity as the concentration of honey goes up, as well as the reduction in viability. t -20.00 -10.00 0.00 10.00 20.00 30.00 40.00 50.00 60.00 0 10 20 30 40 50 60 Pe rc en ta ge o f r ed uc tio n in b io m as s Percentage of Honey w/v
Mean % Reduction
Using a cell count with the ImageJ (National Institutes of Health) software, we have estimated an average dead percentage of 7%, 27%, 78% and 96% for the 0%, 10%, 30% and 50% honey concentrations respectively. These images were obtained for samples P and T, and are consistent across both of them.
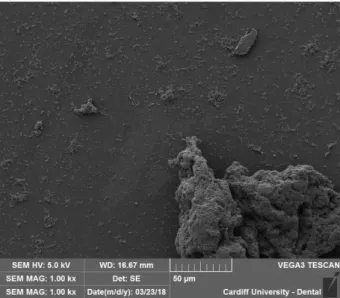
Regarding SEM images, it was possible to detect an important decrease in the number of cells when they were exposed to 30% and 50% honey concentrations, while still finding the same slight increase in biomass (we can’t be sure if those are cells or extracellular matrix at this magnification) under 10% honey solution.
Figure 26: L/D Image of sample P at 30% honey
Other higher magnification images were obtained, but after reviewing them we deemed them not high quality enough to be useful to draw conclusions.
Figure 28: SEM Image of sample T at 0% honey
concentration. Figure 29: SEM Image of sample T at 10% honey concentration.
Figure 30: SEM Image of sample T at 30% honey
DISCUSSION
Results from crystal violet staining assays revealed that even though there was a clear reduction in biomass some other trends were also common. For instance, the increase in biomass that happened at 10% should be better explored, because two possible explanations can be argued: either there is an increase in the extracellular matrix when bacterial cell are under stress, or the bacteria might actually be able to use the honey has a nutrient source while the eventual antibiotic compounds are in lower concentrations.
Crystal violet staining is straightforward to process great quantities of samples but its precision can become a problem because of its inherent ability to stain all forms of biological material, from DNA to proteins. Therefore, other technics of staining, like resazurin, might be advisable in the future. Still, the data provided by crystal violet is very promising, since the general decrease in biomass is still quantifiable and significant, especially when combined with other techniques that were used, namely L/D staining and SEM observation.
Direct observations with L/D staining suggest that the reduction of viable bacterial cells when treated with honey was superior to the one we can infer from crystal violet test alone. Because of restrictions with access to lab equipment and facilities, this staining was only performed on two of the 20 isolates that we had available, chosen because their early results matched the average the closest, therefore doing the same for the rest of the samples would be strongly advisable. Even so, since the results from the two isolates tested were so similar and consistent, even matching the expected increase in biomass but with reduction in viability, it is expected that all the others would also perform the same way, meaning the individual values might be different but the same trend line is expected.
Because the same restrictions regarding lab access were true for the SEM and because this method is even more time consuming than the previous one, only the same two samples were tested. Further problems arose from this technique regarding the focus of the microscope that we were using, that stopped me from being able to acquire pictures with a quality that would allow for any sort detail of the cell samples at higher magnifications, rendering the original idea of evaluating morphology impossible to actually accomplish. Knowing about morphological modifications in cells would have allowed us to predict what is the mean by which the honey is killing them, helping to steer the research that might come next and that being the biggest advantage of this methods and one that we were unable to use.
Lastly, in my opinion, the next step should be performing genetic testing to determine the modulation of virulence that might be occurring during this biofilm disruption since it would paint an even clear picture of the interactions that are occurring.
Also, training tests, where bacteria are expose to increasing concentrations of one specific compound or substance to be tested, might be a good addition to the data, even if all the training tests in other bacterial species so far seem to indicate that they do not develop resistances to
CONCLUSION
At the start of this thesis, I set out to answer question: “Is manuka honey capable of disrupting fully formed S. pseudintermedius’ biofilms, and does it show an antibiotic effect over them.?” In the end, I was able to conclude that the answer is positive. Using the combination of technics we did, and with the scientific reasoning behind them, we can attest the ability manuka honey to, in vitro, disrupt S. pseudointermedius fully formed biofilms, as well as its antibiotic effect, inhibiting both viability and cellular counts, when in concentrations above 10% w/v.
However, even though we were able to prove these capabilities, there are still problems
surrounding it, as we still do not know exactly the mechanisms involved, or the optimal inhibitory concentrations. Furthermore, delivery methods will restrict the actual use of honey in clinical practice because it can not be used everywhere without heavy research into this topic. From a clinical perspective, considering the information available, wound care and surgical infections prevention are the strong suits for the use of these products. Where we would be using another topical antibiotic we can use honey, or a combination of honey with another antibiotic.
Both veterinary and human medicine are fighting an arms race against antibiotic resistances by microorganisms, trying to innovate and create new molecules faster than they can adapt to what we use against them. This is particularly dramatic when a microorganism is able to hop from animals to humans, giving it more opportunity to become resistant and limiting the molecules that we can use in both groups.
All that said, it is good to know that we still have weapons in the war, and that manuka honey is a tool we can add to our toolbox.
REFERENCES
Águila-Arcos, S., Álvarez-Rodríguez, I., Garaiyurrebaso, O., Garbisu, C., Grohmann, E., & Alkorta, I. (October, 2016). “Biofilm-Forming Clinical Staphylococcus Isolates Harbor Horizontal Transfer and Antibiotic Resistance Genes.” Front Microbiol.
Bannoehr, J., & Guardabassi, L. (April, 2012). “Staphylococcus pseudintermedius in the dog: taxonomy, diagnostics, ecology, epidemiology and pathogenicity.” Veterinary
Dermatology, 4, 253-266
Blaser, G., Santos, K., Bode, U., Vetter, H., & Simon, A. (2007). “Effect of medical honey on wounds colonised or infected with MRSA.” J. Wound Care, 8, 325-328
Cooper, R. A., Jenkins, R. L., & Henriques, A. F. (2010). “Absence of resistance to medical grade manuka honey.” Eur. J. Clin. Microbiol. Infect. Dis, 10, 1237-1241
Cooper, R. A., Molan, P. C., & Harding, K. G. (2002). “The sensitivity to honey of Gram-positive cocci of clinical significance isolated from wounds.” J. Appl. Microbiol, 5, 857-863 Cooper, R., & Jenkins, R. (March, 2012). “Synergy between oxacillin and manuka honey
sensitizes methicillin-resistant Staphylococcus aureus to oxacillin.” Journal of
Antimicrobial Chemotherapy, 6, 1405-1407
Devriese, L. A., Vancanneyt, M., & Baele, M. (2005). “Staphylococcus pseudintermedius sp. nov., a coagulase-positive species from animals.” Int J Syst Evol Microbiol, 4, 1569-1573 Donlan, R. M. (October, 2001). “Biofilm Formation: A Clinically Relevant Microbiological Process.”
Clinical Infectious Diseases, 8, 1387-1392
Donlan, R. M. (September, 2002). “Biofilms: Microbial Life on Surfaces.” Emerg Infect Dis, 9, 881-890
Eddy JJ, G. M. (2005). “Topical honey for diabetic foot ulcers.” J. Fam. Pract, 6, 533-535
Eteraf-Oskouei, T., & Najafi, M. (June, 2013). “Traditional and Modern Uses of Natural Honey in Human Diseases: A Review.” Iran J Basic Med Sc, 6, 731-742
EUCAST. (2003). “Determination of minimum inhibitory concentrations (MICs) of antibacterial agents by broth dilution.” Clinical Microbiology and Infection.
Fischer, E. R., Hansen, B. T., Nair, V., Hoyt, F. H., & Dorward, D. W. (May, 2012). “Scanning Electron Microscopy.” Curr Protoc Microbiol.
Franklin, A., Greko, C., Andersson, U. G., & Bengtsson., B. (2006). “MRSA - now also in Swedish dogs.” Sv. Vet. Tim.
Henriques, A., Jenkins, R., Burton, N., & Cooper, R. (2009). “The intracellular effects of manuka honey on Staphylococcus aureus.” Eur. J. Clin. Microbiol. Infect. Dis, 1, 45-50
Hoovels, L. V., Vankeerberghen, A., Boel, A., & Kristien Van Vaerenbergh, a. H. (December, 2006). “First Case of Staphylococcus pseudintermedius Infection in a Human.” JOURNAL
OF CLINICAL MICROBIOLOGY, 12, 4609–4612.
Jenkins RE, C. R. (2012). “Synergy between oxacillin and manuka honey sensitizes methicillin-resistant Staphylococcus aureus to oxacillin.” J. Antimicrob. Chemother, 6, 1405-1407 Jenkins, R., Burton, N., & Cooper, R. (September, 2011). “Manuka honey inhibits cell division in
methicillin-resistant Staphylococcus aureus.” Journal of Antimicrobial Chemotherapy, 11, 2536-2542
Jenkins, R., Burton, N., & Cooper, R. (2011). “The effect of manuka honey on the expression of universal stress protein A in meticillin resistant Staphylococcus aureus.” Int. J.
Antimicrob. Agents, 4, 373-376
Joseph E. Rubin, M. C.-T. (2011). “Prevalence, sites of colonization, and antimicrobial resistance among Staphylococcus pseudintermedius isolated from healthy dogs in Saskatoon, Canada.” J Vet Diagn Invest, 2, 351-354
Martins, L. L., Beça, N., Bessa, L. J., Mendes, Â., Santos, J. T., Matos, A. J., & Costa, P. M. (November, 2015). “Coagulase-Positive Staphylococcus: Prevalence and Antimicrobial Resistance.” Journal of the American Animal Hospital Association, 6, 365-371 Molecular Probes. (2004). LIVE/DEAD® BacLight™ Bacterial Viability Kit.
Natarajan S, W., & D, G. J. (2001). “Healing of an MRSA-colonised hydrowyurea-induced leg ulcer with honey.” J. Dermatol. Treat, 1, 33-36
Olsson Ranta, L. (2004). “Staphylococci as food poisoning - a literature study.” Sv. Vet. Time . O'Toole, G. (2011). “Microtiter Dish Biofilm Formation Assay.” Journal of Visualized
Experiments, 47
Persson, P. W. (2002). “Testing of a new method for detecting Staphylococcus aureus at mastitis.” Sv. Vet. Time.
Pompilio, A., De Nicola, S., Crocetta, V., Guarnieri, S., Vincenzo, S., Carreto, E., & Di Bonaventura, G. (2015). “New insights in Staphylococcus pseudintermedius pathogenicity: antibiotic-resistant biofilm formation by a human wound-associated strain.”
BMC Microbiology, 15, 109
Somayaji, R., Priyantha, M., Rubin, J., & Church, D. (August, 2016). “Human infections due to Staphylococcus pseudintermedius, an emerging zoonosis of canine origin: report of 24 cases.” Diagn Microbiol Infect Dis, 4, 471-476
Ventola, C. L. (April de 2015). “The Antibiotic Resistance Crisis Part 1: Causes and Threats.”
Pharmacy and Therapeutics, 4, 277-283
Visaveda, B., Honeysett, J., & Danford, M. (2008). “Manuka honey dressing: an effective treatment for chronic wound infections.” Br. J. Oral Maxillofac. Surg, 8, 696-697