PERFORMANCE ANALYSIS OF PORTUGUESE EQUITY MUTUAL
FUNDS: INDEXING VS ACTIVE PORTFOLIO MANAGEMENT
Alexandra João Santana Ribeiro
A Dissertation presented in partial fulfillment of the Requirements for the Degree of Master in Finance
Supervisor:
Pedro Leite Inácio, Instituto Superior de Ciências do Trabalho e da Empresa – Instituto Universitário de Lisboa
i
Abstract
The present thesis was done with the objective of analyzing the portfolio management strategies followed by managers of Portuguese Equity Funds, using the PSI Geral as the benchmark. Thus, the quarter returns and compositions of portfolio were used. The market timing ability and the variables that may have influenced tracking error (vs. PSI Geral) were also analyzed.
The main conclusion was that just 1 fund managed to put successfully into practice the active portfolio management, obtaining returns above PSI Geral. The same happened with passive portfolio management, where only 1 fund was able to replicate the benchmark. The other funds opted initially for active or passive strategy but, in the end of the period considered, their performances were below the benchmark, with negative excess returns, even unable to replicate the PSI Geral. It was concluded also that there are several variables that have impact on performance of these funds, and consequently the portfolio management strategy, chosen by manager. These variables are particularly the systematic risk of the fund (beta), the benchmark volatility, percentage of PSI Geral stocks held in portfolio, weight of the stocks in portfolio, number of stocks above of the concentration ratio and number of common stocks between funds and benchmark, above of the concentration ratio.
Keywords: Investment Companies; Performance Appraisal; Mutual Funds; Portfolio Strategies (Indexing vs. Active Management)
ii
Resumo
A presente tese foi elaborada com o objectivo de analisar a estratégia de gestão de carteira seguida pelos gestores dos Fundos de Investimento de Acções Nacionais, usando o PSI Geral como mercado de referência. Assim, foram usados os retornos e as composições trimestrais de carteira. A capacidade de Market Timing, e as variáveis que podem ter influenciado o
Tracking Error (vs. PSI Geral) também foram analisados.
A principal conclusão foi que só um fundo gerido conseguiu com sucesso pôr em prática a gestão activa da carteira, obtendo retornos acima do PSI Geral. O mesmo se passou com a gestão passiva, onde um fundo conseguiu replicar o mercado de referência. Os outros fundos optaram inicialmente por uma gestão activa ou passiva mas no final do período considerado, o seu desempenho ficou abaixo do mercado de referência, com excesso de retornos negativos, nem conseguindo replicar o PSI Geral. Foi também concluído que existem várias variáveis que têm impacto no desempenho destes fundos e consequentemente a estratégia de gestão de carteira escolhida pelo gestor. Estas variáveis são nomeadamente o risco sistemático do fundo (beta), volatilidade do mercado de referência, a percentagem de acções do PSI Geral na carteira, o peso das acções na carteira, número de acções acima do índice de concentração e o número de acções comuns entre o fundo e o mercado de referência, acima do índice de concentração.
Palavras-Chave: Avaliação de Desempenho; Fundos de Investimento; Estratégias de Carteira (Gestão Passiva (Indexing) vs. Gestão Activa)
iii
Executive Summary
A mutual fund is an investment company that pools the money of various investors and buys and manages diversified portfolio securities. This type of investment have become an invaluable tool for a wide range of investors, that have goals to buy securities such as stocks, bonds, money market instruments, a combination of these investments or even other funds. The investors or shareholders buy shares of the mutual fund, representing ownership in all of fund‟s securities and investors share of the mutual fund they buy in direct proportion to the amount of the mutual fund shares they own. The investment management process involves selecting an investment strategy, that is, consistent with investment objectives and investment policy guidelines of the client or institution. Portfolio strategies can be classified as either active or passive. An active portfolio strategy uses available information and forecasting techniques to seek a better performance than a portfolio that is simply broadly diversified. On the contrary, a passive portfolio strategy involves minimal expectation input, and instead relies on diversification matching the performance of benchmark. However, between these extremes of active and passive strategies, several strategies have sprung up that have elements of both.
This thesis has precisely the objective of trying to understand which strategy is followed by manager of the funds and which variables were determinant in how the funds followed the benchmark, during the period considered. The funds that serve the subject of study in this analysis were the Portuguese Equity Funds, considering the period between December 1997 and December 2010. In this period 7 funds were in the market: Banif Acções Portugal,
Barclays Premier Acções Portugal, BPI Portugal, Caixagest Acções Portugal, Espírito Santo Portugal Acções, Millennium Acções Portugal and Santander Acções Portugal. Quarter
returns and the respective compositions of these funds were used and also the respective returns of PSI Geral (as a benchmark), because these funds mainly include domestic stocks (a minimum of 2/3). For achieving the goal of this analysis, the performance of the funds it was measured, using profitability models recognized and utilized in finance world: CAPM, Jensen Measure, Treynor Ratio and Sharpe Ratio. There is another method to determine if the strategy opted by managers was achieved with success, the market timing, because it can
iv
translate the ability of managers to anticipate the movements of benchmark. This ability can be measured with Treynor and Mazuy, and Henriksson and Merton Models. On the other hand, there are two measures that can classify the various types of the portfolio strategies: alpha and tracking error. The alpha is the average of the difference between the fund return and the benchmark return (active return) for a given period, and in this case, for a quarter. So, the tracking error is the standard deviation of the active return, that is, this occurs when risk profile of a fund differs from that of the risk profile of the benchmark. Thus, based in this measure, the other idea in this thesis is identifying which variables have a strong or weak link with how the funds follow the benchmark, and thus verifying which variables have an important impact on the performance that the manager achieved.
Thus using these measures, we concluded that only 2 funds can achieve the initial strategy established. The fund Espírito Santo is one of them because during the period considered, it can get an active portfolio management, with an annualized geometric mean above the benchmark, a positive gamma in the models of the Market timing, demonstrating a capacity in anticipating the movements of the market, a positive average of active returns, a higher tracking error, reflecting the difference between risk profile of fund and benchmark, and a positive information ratio, traducing in good performance. The variable that explains better the value of tracking error is the percentage of PSI Geral stocks used in fund portfolio, but with moderate correlation. The other fund is BPI that chosen and achieved a passive strategy, with annualized geometric mean very close to the benchmark, a beta is approximately 1, indicating that its variation tends to follow perfectly the benchmark, the values of Treynor and Sharpe ratio are very close to benchmark, so the performance of fund BPI was approximate of the PSI Geral, a positive gamma of Market Timing Models, a average of active returns close of 0, tracking error is the lower of all funds and a positive information ratio. It was not possible to identify which variables influence the tracking error, because all have a weak correlation.
The measures for the others funds show that the manager pretended to follow an active or passive strategy but he was not successful, with poor performances. In case of Banif, the manager tried to use the active, which can be seen by tracking error, the highest value. The variables that influence this fund are the benchmark volatility and the weight of stocks in fund. The fund Barclays tried to use the passive strategy, which can be seen through the
v
market timing values and tracking error (lowest value). The percentage of common stocks between funds and PSI Geral above of concentration ratio is the variable that better explains the variation of tracking error. The Caixagest fund has a lower tracking error demonstrated that the manager tried to use the passive strategy. Relatively to the determinants of tracking error, it was not possible to understand which influence it because the correlation is weak. In the case of fund Millennium, through the average of active returns and tracking error, the manager tried to apply the passive strategy and the benchmark volatility was the variable with more impact in tracking error. Finally the fund Santander, presented a large tracking error, so the intention of manager was to use the active strategy and the variable with more impact in tracking error is the benchmark volatility.
With this analysis, it can be understood that particularly the beta of portfolio, benchmark volatility, the percentage of PSI Geral stocks, the weight of stocks, the percentage of PSI
Geral stocks above of concentration ratio and the percentage of common stocks between
funds and PSI Geral above of concentration ratio, have influence in the performance of the funds.
vi
Acknowledgements
I want to thank my supervisor Pedro Leite Inácio for all the suggestions, guiding and time spared by him, from start to the finish of this thesis. The effort made by me in the realization of this thesis was supported by numerous people especially by my parents and sister for the conversations and help. Finally special thanks are due to Ricardo Soares for helpful discussion, ideas and patience.
Index
Contents
1. Introduction ... 1
2. Literature Review ... 2
2.1. Mutual Funds ... 2
2.2. Advantages of Mutual Funds ... 3
2.3. Disadvantages of Mutual Funds ... 6
2.4. The Cost of Investing in Mutual Funds ... 7
2.5. Classification of Mutual Funds... 8
2.6. Equity Funds ... 10
3. Mutual Funds Industry in Portugal ... 14
3.1. Equity Funds ... 20
4. Performance Measures of Mutual Funds ... 23
4.1. Capital Asset Pricing Model (CAPM) ... 24
4.2. Jensen Measure ... 26
4.3. Treynor Measure ... 26
4.4. Sharpe Measure ... 27
5. Market Timing ... 28
6. Investment Policy ... 30
6.1. Passive Portfolio Management ... 30
6.2. Active Portfolio Management ... 31
7. Data Analysis Methodology ... 33
7.1. Assumptions and Data ... 33
7.3. Profitability Measures... 37 7.3.1. CAPM ... 37 7.3.2. Jensen Measure ... 38 7.3.3. Treynor Measure ... 39 7.3.4. Sharpe Measure ... 40 7.4. Market Timing ... 41
7.5. Indexing vs. Active Strategy ... 43
7.6. Determinants of Tracking Error ... 46
8. Conclusion ... 54
9. Bibliography ... 58
Figures Figure 1: The Morningstar stock style grid ... 12
Graphics Graphic 1: Number of Mutual Funds ... 15
Graphic 2: Evolution of Mutual Funds Applications ... 16
Graphic 3: Weight of Equity Funds in Mutual Funds ... 20
Graphic 4: Evolution of Equity Funds Applications ... 21
Graphic 5: Equity Market Performance in 2008 ... 22
Tables Table 1: The Management Company‟s weight of investment applications in domestic equity funds ... 34
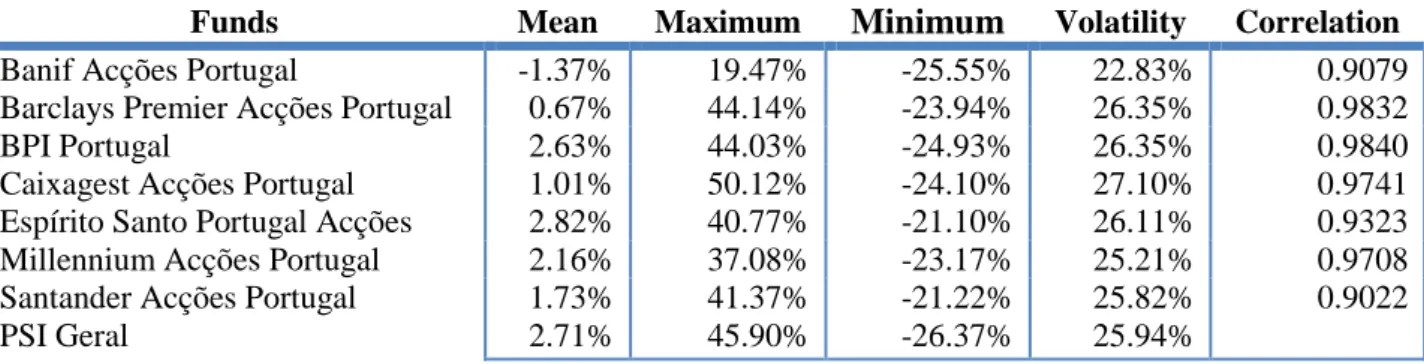
Table 2: Statistical Measures of Portuguese Equity Funds ... 35
Table 4: Parameters of CAPM ... 38
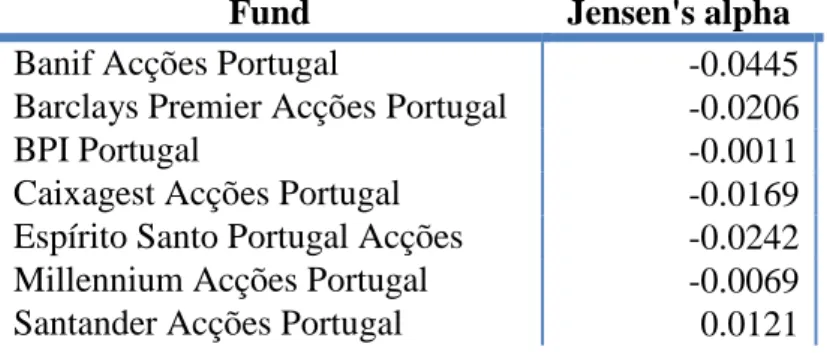
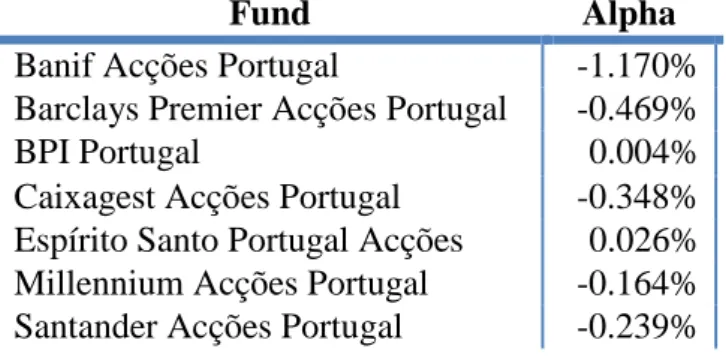
Table 5: The Jensen‟s alpha for Portuguese Equity Funds ... 39
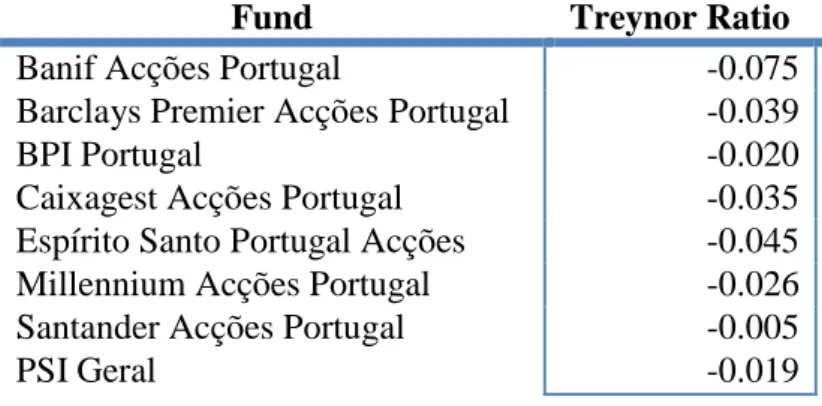
Table 6: The Treynor Ratio for Portuguese Equity Funds ... 40
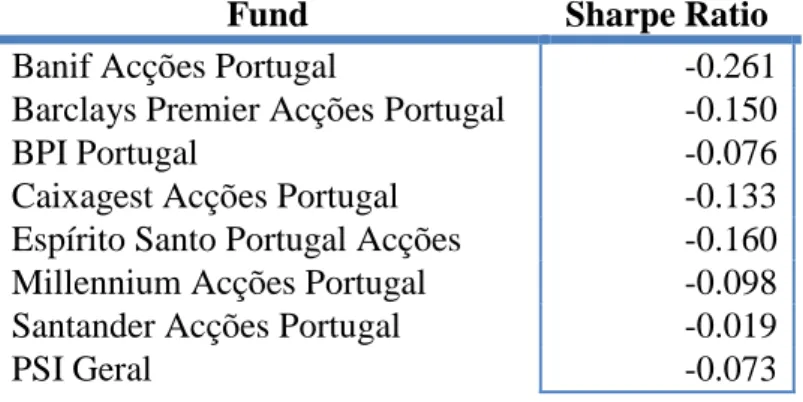
Table 7: The Sharpe Measure for the Portuguese Equity Funds ... 41
Table 8: The Treynor and Mazuy Model ... 42
Table 9: The Henriksson and Merton Model ... 42
Table 10: Average of Active Return of Portuguese Equity Funds ... 44
Table 11: Tracking Error of Portuguese Equity Funds ... 45
Table 12: Information Ratio of Portuguese Equity Funds ... 46
Table 13: Relation between fund beta and tracking error ... 47
Table 14: Correlation between the benchmark volatility and tracking error ... 49
Table 15: Average Percentage of PSI Geral Stocks used in Portuguese Equity Funds ... 50
Table 16: Average Weigh of Stocks in Portuguese Equity Funds ... 51
Table 17: Average percentage of PSI Geral stocks above of concentration ratio ... 52
Table 18: Average percentage of common stocks between funds and PSI Geral, above of concentration ratio ... 53
List of Abbreviations
APFIPP – Associação Portuguesa de Fundos de Investimento, Pensões e Património BCP – Banco Comercial Português
BPI – Banco Português de Investimento CAC – French Stock Index
CAGR – Compound Annual Growth Rate CAPM – Capital Asset Portfolio Management
CMVM – Comissão do Mercado de Valores Mobiliários DAX – German Stock Index
EFAMA – European Fund and Asset Management Association EU – European Union
FDIC – Federal Deposit Insurance Corporation
FEFSI – Fédération Euripéenne des Fonds et Sociétés d’Investissement FIM – Fundo de Investimento Mobiliário
IBEX – Spanish Stock Index MIL – Italian Stock Index
NASDAQ – National Association of Securities Dealers Automated Quotations NAV – Net Asset Value
PSI – Portuguese Stock Index S&P – Standard & Poor‟s SML – Security Market Line
UCITS – Undertakings for Collective Investments in Transferable Securities UK – United Kingdom
1
1. Introduction
This thesis falls within the areas of finance that deal with Mutual Funds, the dominant and important investment company today. Mutual funds are the common name for the open-end investment companies, that is, this type of managed companies stand ready to redeem or issue shares at their net asset value. Then this thesis can be divided in two parts.
In the first, it is presented a characterization of Mutual Funds, including the advantages, disadvantages, the cost of investing in this type of investment company and the classification by investment policy. In this analysis, was given emphasis the equity funds because this type of mutual funds are the subject of study in this thesis. It also was done research on the history and growth of this industry in Portugal, registered from early years to nowadays, trying to understand the respective evolution drivers, highlighting also the equity funds.
It was introduced the performances measures, like CAPM, Jensen Measure, Treynor ratio and Sharpe ratio, as the best available methods recognized and utilized to analyze the mutual funds. The market timing also was explained in this thesis, for understanding the ability of managers to anticipate the movements of market. At the end of the first part was introduced an explanation of the types of strategy portfolio management: active and passive.
In the second part was analyzed the performance of the Portuguese Equity Funds, using the quarter returns between December 1997 to December 2010, utilizing first the descriptive and hypothesis testing statistics, then the profitability measures and the market timing, using Treynor and Mazuy, and Henriksson and Merton Models. It also was used the measures Tracking Error, Alpha and Information Ratio that can tell us, which strategy the manager was following and achieved during the period considered. This analysis, also tries to understand which variables determinate how the these funds follow the benchmark, that is, the tracking error, obtained for each Portuguese Equity Fund. Particularly was taken into account the systematic risk of each fund, benchmark volatility and the composition of portfolio for each fund, in period considered.
2
2. Literature Review
2.1. Mutual Funds
The first mutual fund was created in 1849 in Switzerland (Société Civile Genévoise d’emploi
de Fonds), the second mutual fund in the UK (Foreign & Colonial Government Trust) was
created in 1868, with a definition of mutual fund as a way that allows investors of moderate resources to obtain the same advantages as a large capitalist in relation to the reduction of risk, due to portfolio diversification. In U.S., the first mutual fund was created in 1894 (Boston Personal Property Trust), while the Germans only did in 1923 (Zickert'sche
Kapitalverein). The purpose for creating the first mutual fund was to provide diversification
for small investors, as referred in the above definition. Thus, mutual funds have become the primary investment vehicle for these investors, for example in U.S. the number of mutual funds exceeded the number of securities listed on the New York Stock Exchange.
Individual investors are typically limited by resources and/or by their knowledge of the investment position of different financial assets and the difficulty of continuous monitoring of changes in a rapidly moving economic situation. Given to these investors, the small portfolio to manage, it may not be optimal to spend their time analyzing and developing various possible investment strategies. As an alternative, the investors can resort on professionals who possess the necessary knowledge to manage their funds within a specific plan.
Mutual funds are constituted for money investors and the investment will accord to specific purpose of the fund, because there are several types of mutual funds, where they differ on investment objectives, the set of asset classes and the investment strategy. Thus, the profits, after paying the costs of transaction and management, are distributed between the individual investors in proportion to their investment in the fund.
In summary, the definition of mutual fund is a collection of investment money from individual investors to be invested for a specific asset and strategy. The fund manager
3 determines which securities (for example, stocks and/or bonds) he or she should invest in order to achieve the strategy of the fund.
The management companies work with groups of mutual funds, so they organize an entire collection of funds and then collect a management fee for operating them. By managing a collection of funds under one umbrella, these companies make it easy for investors to allocate assets across market sectors and to switch assets across funds while still benefiting from centralized record keeping. Most mutual funds have an underwriter that has exclusive rights to distribute shares to investors. Mutual funds are generally marketed to the public either directly by the fund underwriter or indirectly through brokers acting on behalf of the underwriter.
2.2. Advantages of Mutual Funds
Diversification
The concept of diversification is to invest in a large number of assets where a loss in any investment is compensated by gains of other. Thus, the more securities the mutual fund is constituted, the less any one of them can prejudice the profits of investor. Some mutual funds are constituted by different stocks in many different industries, to obtain this advantage, which requires different investments with returns that aren‟t totally correlated. That is, with money of investor in different industries or assets, when the value of one investment is down, there is a high probability that another one is up. So, for decreasing the chances that all investments go down at the same time, the investor must do a good diversification, investing in different types of assets and industries.
The investor can choose by different mutual funds including money market, bonds, stocks and treasury funds, but also can diversify investments by choosing foreign or domestic markets. For a more complete diversification, the investor should also diversify inside of chosen securities, investing in different types stocks, bonds that perform well under in economic situation.
4 Thus, mutual funds are considered a greatly investment way and the investor can benefit of diversification in two forms:
With diversification, the investors can reduce the volatility in the value of their portfolio, that is, when the investors apply their money in different industries and classes of asset, they can achieve the same rate of return that a single investment can offer, but with lower variations of value;
And diversification in addition can help the investors to obtain a higher rate of return of their investment, for a specific level of risk.
Due to the reasons referred above, in the mutual fund portfolio, there is a much greater degree of diversification than is usually found in individual portfolios, making this way of investment a big attraction for investors. A correct diversification increases the probability that the fund receives the highest possible return at the lowest possible risk, given the objectives of the fund. For investors, that buy small amounts of different securities and diversify a portfolio to this level can be a costly and inefficient process, due of the transactions costs.
However some mutual funds aren‟t diversified as in the case of sector funds, where fund manager invest completely in only industry. These funds aren‟t the best because their diversification is very poor. So, if investor buys sector fund, that invests in a specific industry and if this industry crashes, the value of this fund will decrease dramatically.
Professional Portfolio Management
In order to obtain the diversification advantage professional portfolio management is needed, because the fund managers have experience in monitoring investments and making decisions according to the economic and financial situation, when they choose securities for the funds, taking in account that portfolio funds are consistent with their prospectus, where the objectives of the fund are described. This process structures risk portfolio and expected return of the fund.
Kosowski, Timmermann, Wermers, and White (2006) recognize that managers of funds with high performance are excellent at choosing the securities for their funds, obtaining good results even after the deduction of transaction costs and management fees. So, Kosowski et al
5 (2006) used their tests to account for the possibility that luck drives performance of these funds, and they come to the conclusion that for income funds, they detected luck in management but not exceptional for the success of funds that invest in stocks.
Ready Access to Asset Classes and Market Sectors
The mutual funds offer investors a contact to a large selection of security types, as such industry sectors, and geographic sectors. The securities that are trading in foreign markets can be difficult for individual investors to buy directly, thus mutual funds may facilitate this process.
Using mutual funds planned to invest in a specific sector or with exact style, helps investors balance their portfolios with an asset class. It is the case of the investors that are not aware of the growth classification for a specific stock, however this categorization may influence future returns, as a consequence the style of mutual funds may facilitate investors to preserve their objectives.
Economies of Scale
The fund managers trade large amounts of securities at the same time, so their transaction costs and information gathering costs are lower than for individuals.
Liquidity
In mutual funds, it is possible to convert the shares into cash at any time like in individual security. Investors can join in or leave the mutual fund as they want in open-ended mutual funds by dealing directly with the fund manager (usually in this situation the fund charges an entry and exit fee), or use the stock exchange for that purpose in the case of close-ended mutual funds.
Simplicity
Investing in mutual fund is simple, because most of banks have a line of mutual funds, with a lower minimum investment.
6
2.3. Disadvantages of Mutual Funds
No Insurance
Mutual funds that are regulated by the government may also suffer losses, because, although the mutual funds benefit from risk reduction due to diversification, losses can still occur.
Dilution
As said above, the diversification is the main advantage for mutual funds, because it reduces the level of risk, but on the contrary, it can transform a disadvantage through dilution. If one security of a mutual fund doubles its value, the value of mutual fund would be not double because probably this security is only small part of the fund. So, with a large number of different securities, mutual funds tend to get an average performance.
Fees and Expenses
The investors that choose a mutual fund will pay management and operating fees. But some mutual funds have high commissions and redemption fees, and in some cases trading shares so frequently that these expenses increase considerably.
Poor Performance
The returns of mutual funds are not guaranteed. In fact, on average, around 75% of all mutual funds have a poorer performance than major market indexes, creating the uncertainly about the efficiency of professional portfolio management.
Loss Control
The fund managers make all of the decisions about which securities to trade and when to trade. Thus, with these decisions, it may be difficult o manage the portfolio and optimize returns, because there are tax consequences for certain time of trading the assets. On the other hand, the investors are trusting in someone that uses their money for investing in mutual funds, what need some attention for these investments.
7 Trading Limitations
In general, the mutual funds are very easy to trade, but the open-ended funds, cannot be bought or sold in the middle of the trading day, only in end of the day.
Size
Some mutual funds are constituted for various companies, so finding good investments, is particularly difficult for funds that have as their target small companies, given severe regulations about how much of a single company a fund may invest. So, as the result sometimes the fund manager will be forced to lower its standards when selecting companies to invest in.
Inefficiency of Cash Reserves
Mutual funds usually keep large cash positions as a defense against possible withdrawals. These reserves offer liquidity to investors, but that money could be invested in assets rather than in cash, so this policy tends to lower the potential return for the investor.
Different Types
There are a lot of mutual funds in market, and these funds differ in asset classes, strategy, and style. So, the mutual funds are available for every investment strategy, every sector, and every region of the world. Thus the process of selecting a fund can be slow, because there are several options for investing in mutual funds.
2.4. The Cost of Investing in Mutual Funds
An investor that chooses the mutual fund as investment should consider not only the investment policy and historical performance, but also the cost of investing. Thus, the investor should pay attention to these fees:
Front-End Load
The front-end load is a fee paid when the shares are purchased, and with these loads, the amount of money invested is reduced. Obviously, the no-load funds have no front-end costs.
8 Back-End Load
The back-end load is commission that occurs when the investor sell his shares. These charges are known more formally as “contingent deferred sales charges”.
Operating Expenses
The operating expenses are the commissions that occur when the fund manager operates the portfolio, including administrative expenses and advisory fees. These expenses periodically are deducted from the assets of the fund, reduced thus value of the portfolio.
2.5. Classification of Mutual Funds
By structure
Open-Ended and Closed-Ended Funds
In open-ended fund, the units are traded at any time, and the NAV will prevalent at the time of trading. The fund discloses the NAV on a daily basis to facilitate issue and redemption of units. In contrast of open-ended funds, closed-ended funds sell units only during their underwriting period. Afterwards, the investors can trade units to or from other investors and to facilitate those transactions, units are traded on stock exchanges. The price of closed-ended funds is determined based on demand and supply of units at the stock exchange and can be more or less (usually less) than the NAV.
Open-ended funds are usually preferable to closed-ended funds for the following reasons:
Management talent: The open-ended funds always attract more investors and thus, they can pay necessary money to employ the best managers. Closed-ended funds are also run by good managers, but generally, open-ended funds can get better talent.
Expenses: Since open-ended funds attract more investors, so more money will manage and thus this type of mutual funds can obtain lower operating expenses. The closed-ended funds normally have a smaller size, consequently they are more expensive to manage and the cost of
9 operating is subtracted from the returns for investors. As a result, higher expenses decrease the returns of closed-ended funds. The investor can avoid these high expenses by buying a no-load that is free of commissions, open-ended mutual fund.
Fee-free selling: As, the NAV always equals 100% in open-ended funds, so the investments, reduced by liability, are presently important. Thus investors don‟t have the cost of trading their shares with other investors as it happens with closed-ended funds. In that case investors have to sell their shares to someone who wants to purchase them, consequently closed-ended funds sometimes tend to sell at a discount.
By Investment
The fund can be classified by investment: Treasury Funds, Equity Funds, Bond Funds, Index Funds, Money Market Funds and Fund of Funds.
Treasury Funds
These funds have as characteristics the predominance of short-term investments and high liquidity, like Government Bonds or Treasury Bills. Thus, this type of fund offers a low risk and a return that equals money market interest rates, more suited to investors that have liquidity needs in the short term and/or high risk aversion, declaring itself as an substitute to investment in bank deposits.
Equity Funds
This type of fund mainly invests in stock and can be either growth funds or income funds. Growth funds focus in companies with strong growth potential, capital appreciation being the most important driver, while income funds focus in companies that have high dividend yields. In equity funds the investment in stocks from a specific industry may be restricted.
Bond Funds
The bond funds are constituted mainly of bonds or other types of debt securities. Thus, a bond fund concentrates in a particular type of bond or debt, depending on its investment objectives. The securities that bond funds operate diverge mostly in terms of risk, return, duration, and convexity.
10
Index Funds
This type of mutual fund has the objective of achieving the same return as a selected index. For this purpose, this fund invests in securities of companies that are included in the selected index, but some also use derivatives for the same purpose. Some fund managers choose all of the companies included in index but others invest only in a representative sample of the companies included in index.
Money Market Funds
This type of fund principally invests in highly liquid and low-risk securities, such as government securities and certificates of deposit. These funds are known for low risk, compared to other mutual funds, and pay dividends that generally reflect short-term interest rates.
Fund of Funds
These mutual funds invest in other mutual funds, adding another level of diversification. Before investing in units of any mutual fund, the manager must analyze the financial situation of companies and the strategies of competitors, using the quarterly reports that they regularly issue detailing their revenues, expenses, profits, losses, assets and liabilities.
Hedge Funds
The objective of hedge funds is not only (as their name may wrongly suggest) to reduce risk, but also to maximize return on investment. This type of fund trades any securities, such as bonds, stocks or options. Thus, the fund manager can invest in any opportunity of investment in any market where it anticipates notable gains at reduced risk.
2.6. Equity Funds
As the theme of this thesis is based on Equity Funds, it is important to know more about this type of mutual funds. Stocks represent a share of ownership in a company and its profits. So if companies grow or expand, stocks represent a good way for investors to participate in that success. Over the last two centuries, investors with diversified stock portfolios earned an
11 average return of 10% per year. In contrast the return of bond and money market investments, have historically a value of 1% or 2% per year over the rate of inflation. The investment‟s return of equity fund relative to the rate of inflation determines the growth in buying power of portfolio. So the real growth rate is the rate of return obtained per year minus the yearly rate of inflation.
Equity Funds are the option for the investors that want to trade stocks, so equity funds that offer diversification and a low-cost of professional manager, the investor exposes himself to risk. The most effective form to reduce the risk is diversification, because as said previously, using numerous stocks reduces the damage of any stock value decrease. Thus this type of fund reduces risk by investing in many stocks. On the other hand equity funds can reduce the risk through investments in different types of stocks of various sectors. To classify equity funds is their reliance on capital appreciation versus current income is often taken into account. As said previously, the income funds tend to choose companies with high dividend yields, which offer high current income. Instead, growth funds focus on gains of companies. The categorization of these funds is in terms of income versus capital gains, but the most important factor is the level of risk.
The growth funds are normally riskier than income funds because they respond far more dramatically to changes in economic situation. Funds that invest in stocks represent the largest category of mutual funds. Thus, the investment realized in this class of funds is long-term capital growth with some income. However, there are many different types of equity funds because there are many different types of equities. For understanding better the different types of equity funds we may take a look at the Morningstar stock style grid.
12 Figure 1: The Morningstar stock style grid
Source: Morning Star
The different stocks are grouped into one of seven regions: the United States, Latin America, Canada, Europe, Japan, Asia ex-Japan, and Australia/New Zealand. After, it is evaluated how it stands out relative to other companies of the same region. The process is started by determining if a security is small, medium, or large inside of its region. In investing vocabulary, stock size is called market capitalization or market cap.
Benz (2005:7) refers that the market cap is “…the current dollar value of all of a given
company’s stock shares...We consider companies whose market caps land within the largest 70 % of their region to be large cap; the next 20 % are midcap; and the smallest 10 % are small caps. Although small-cap stocks only account for 10 % of each region’s market, there are actually many more of them than there are large-cap companies. Having determined a security’s regional and size classification, we turn our attention to its investment style. Investors typically group stocks into one of two major buckets—growth stocks or value stocks—and often identify themselves as growth investors or value investors. Understanding the difference between the two styles is critical to understanding what makes a fund tick. Growth stocks typically enjoy strong growth in earnings or revenues because they’ve got a new product or service. So, the market expects good things from these fast growers, and earnings growth usually drives a higher share price, investors are willing to pay more for the shares than they will pay for slower growers.‖
13 Stocks companies that have a classification of value contain earnings that are frequently growing in slow way, and they are in industries that have boom-and-bust cycles. Fund managers who center in value stocks are prepared to invest in less important earnings growth because they think the market is being negative about the potential of company in the future.
―Some companies display a mixture of both growth and value characteristics – we call these core stocks...To help classify a stock as growth, value, or core, we look at 10 separate factors, including dividend yields, price/earnings ratios (a company’s current share price divided by its earnings), and historical and projected earnings growth. Once we have classified each stock’s investment style, we then classify the entire portfolio, based on which square of our style box most of its stocks land in. Securities that the manager has weighted the most heavily will play a bigger role in determining a fund’s investment style than will smaller positions...Funds that devote most of their assets to stocks with strong growth characteristics will land in the growth column of our style box, while those with a higher concentration of value stocks will land in our value column. Funds that hold both growth stocks and, value stocks, or those that focus mainly on so-called core stocks will land in the blend column of style box”. (Benz, 2005:8).
The investors can make money in Equity Funds in three ways:
Dividends: The companies that can get profits give some to shareholders in the form of dividends. The companies with a high growth of their returns use these gains to invest in their or other business. The investors have an option to receive the dividends as cash or reinvest them by obtaining new shares for portfolio equity fund.
Capital gains distributions: The fund managers can get profits, selling stocks for more than they paid for them, known as capital gains, which after being be deducted by losses may then be paid to the fund‟s shareholders as dividends. These gains can be reinvested back into the fund. Profits from stock realized for more than one year are identified as long-term capital gains and are taxed at a lower rate.
Appreciation: The fund manager doesn‟t sell all the stocks that have a good performance, thus the price per share of the fund should increase, reflecting the gains in stocks that were not sold, if fund manager made good picks or if the market had a great performance. On the
14 contrary, if the value of stocks decreases, the share price of fund reduces. The investors just receive these profits when they sell the fund and lock them in. As said before the investors that have a fund more than one year, are qualified for low long-term capital gains tax rates when they sell. If the investors include collectively dividends, capital gains, and appreciation, they get the total return of a fund. However, stocks and the funds that invest in them, change in the magnitude of the weight that makes up their total returns, principally the dividends.
3. Mutual Funds Industry in Portugal
The activity of mutual funds in Portugal is subject to the supervision of two entities: Securities Market Commission (CMVM) and Central Bank of the Portugal (Banco de
Portugal). CMVM holds extensive powers of supervision, that is, CMVM is the authority
that, supervises and audits the funds institutionally and controls the fund managers activities and their custodians. For example, the CMVM, with the consent of the Central Bank of Portugal, is responsible of authorization the establishment of new mutual funds. The functions of the Central Bank of Portugal consist in auxiliary activities of the funds that are directed by more entities of supervision management - credit institutions and financial companies - than the activities themselves.
Mutual funds can be divided into 2 structures: harmonized funds (UCITS - Undertakings for Collective Investments in Transferable Securities) and non-harmonized funds (non-UCITS). The most important structure of this industry is the first, that is concerned in European Directive of 1985, and include all open-ended funds (statistics FEFSI - Fédération
Européenne des Fonds et Sociétés d'Investissement). In the moment, non-harmonized funds
include other types of mutual funds regulated nationally, with domination of German special funds (German Spezialfonds) and by UK closed-opened funds. The harmonized funds of EU countries correspond to on average about 80% of total industry of mutual funds. Portugal is, one of all EU countries, which shows lower values of assets under management, in terms of total and harmonized funds.
15 The history of mutual funds industry in Portugal is recent compared to other countries, including Switzerland, UK, U.S. and Germany. The first registration occurred only in June 1964 and in 1975, following the nationalization of the banking sector and the consequent cessation of activity in the capital market the units of funds were transformed into public debt. Thus, this industry was resumed in 1986 with appearance of the fund “Invest”. In the next year, four more funds appeared and since then this activity has increasing importance in Portugal and the mutual funds industry gained a very rapid growth.
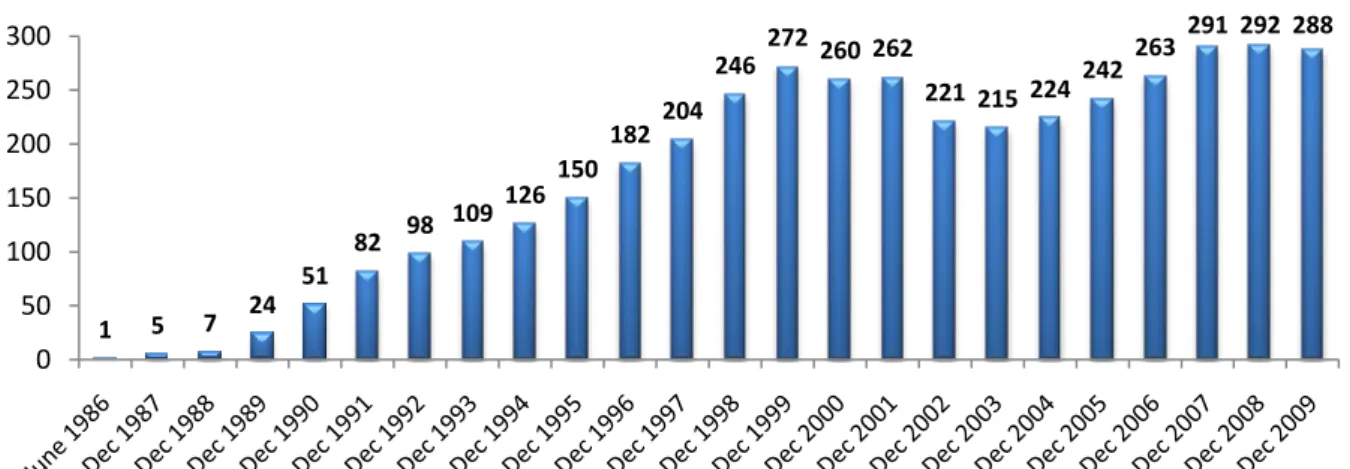
Restricting the analysis to Portuguese mutual funds that was marketed and administered by entities in Portugal, there is an exponential growth in NAV and the number of funds since its inception, reflecting its approval between the investors. As said previously, in 1986, the beginning of mutual funds industry, there was only one whose value amounted to just €51 million. However in late 2009 there were 288 funds that managed a total of €17,231 million. This development was not uniform past of years, and between 1986 and 1991, two events with significant consequences for the mutual funds industry: on the one hand, the stock market crash in October 1987, which possibly accounts for the negative growth rate of NAV in 1988; in addition, the resumption of capital markets in 1989, resulting in the high growth observed in this and the following two years. This period was designed as “impulse” of mutual funds industry in Portugal.
Graphic 1: Number of Mutual Funds
Source: CMVM, APFIPP 1 5 7 24 51 82 98 109 126150 182 204 246272 260 262 221 215 224 242 263291 292 288 0 50 100 150 200 250 300
16 Between 1992 and 1998, is a period of "consolidation" of industry growth, the sharp upward trend of the NAV remained, although with lower growth rates. The significant increase of the amounts applied occurred in 1997 may be associated with a number of factors and events that contributed to the maturation of the Portuguese market and to increase investments in securities markets in general (European level). Among them may be mentioned: (i) the fact that several international financial institutions spend analysis to classify the Portuguese market in the group of developed markets, making our market more attractive and creating greater visibility of Portuguese firms abroad, (ii) the Asian crisis, which made the stock markets of the EU (including Portuguese) in natural refuges for the international financial investment, (iii) the privatization of public companies, currently holding a significant weight in national stock indices.
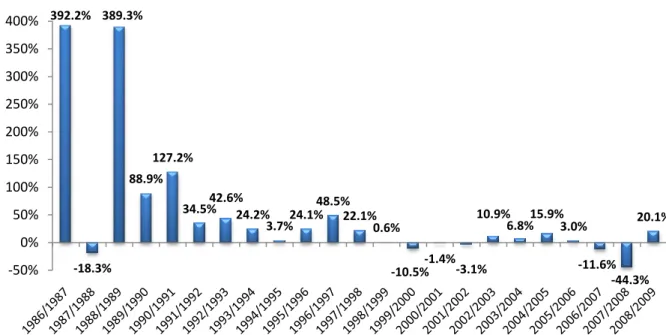
The year 1999, and despite the overall portfolio of investments of the mutual funds have reached the highest value ever, constitutes a year of stabilization in the industry, that found a growth rate of only 0.6%. Within next three years, there has to reduce the applications, with negative growth of 10.5%, 1.4% and 3.1% respectively.
Graphic 2: Evolution of Mutual Funds Applications
Source: CMVM, APFIPP 392.2% -18.3% 389.3% 88.9% 127.2% 34.5%42.6%24.2% 3.7%24.1% 48.5% 22.1% 0.6% -10.5%-1.4%-3.1% 10.9% 6.8%15.9%3.0% -11.6% -44.3% 20.1% -50% 0% 50% 100% 150% 200% 250% 300% 350% 400%
17 The year 2005 was one of great activity and of evolution for Mutual Funds domiciled in Portugal. The amounts under management of these funds increased to more than €28 billion, a growth of nearly 16% compared to previous year. Nevertheless, a part of this increase was caused by the growth of Fund of Funds which, since they invest a large part of their assets in other domestic Mutual Funds, gives rise to double reckoning of the same assets. Discounting this effect, growth amounted to 13.8% in 2005. As far as the number of active funds is concerned there was an increase of the offer, with a total of 242 funds at the end of 2005, 18 more than at the end of 2004.
The increase of demand for Mutual Funds was certainly driven not only by the performance of the funds as a whole, particularly those more exposed to the equity segments, but also by the launch throughout the year of various products offering guaranteed capital and/or a minimum return, which had good reception as far as domestic investors are concerned.
Despite the good performance of the Portuguese Market it did not perform as well as the European Investments Funds Market. Indeed, according to figures provided by EFAMA – European Fund and Asset Management Association, in the EU countries taken together the volumes of Mutual Funds under management (UCITS and non- UCITS) increased 22.6%, a growth in which Luxembourg was out-standing: in addition to being the biggest “producer” of Mutual Funds at European level, it was also one of the ones that returned the greatest growth, at 37.8%.
The fact that Luxembourg has managed to take the leadership position - regardless of the small size of its population - reflects the success of the strategy pursued by this country. The square Luxembourg managed to impose itself as the main platform for the marketing of investment funds denominated pan-European, and now second worldwide and first at European level: 80% of those funds are domiciled in Luxembourg (representing €928.4 million). This success was due to two factors: firstly, the fact of having been the first country to transpose the 1985 Directive into national law (in 1988), on the other, the strong investment by the professionals at the training and technology. In parallel, the Luxembourg maintains a very attractive legislative and fiscal environment.
18 The volume managed by Mutual Funds domiciled in Portugal grew for the fourth straight year. The good performance of the equity markets and the launch of new products meant that the barrier of €29 billion under management was broken for the first time at the end of December 2006, revealing a growth of 3% compared to 2005. With regard to the number of active Funds, there was a substantial increase so that there were 263 funds at the end of 2006, 21 more than at the end of 2005.
During the year 2007, total assets under the management of the domestic Mutual Funds Industry decreased 11.6% to stand at €25,763.1 million. There were two totally distinct moments during this year, As at June 30, the returns since the star of the year were positive in every category, with the exception of Funds investing in Fixed-Income Bonds, the performance of which was negatively affected by the European Central Bank‟s increase in interest rates. Thus, at the end of June, the Industry had achieved the highest-ever figure for Assets under Management, at €30.144 billion, with significant growth in Equity Funds.
The second half was completely different, conditioned by the subprime crisis that broke out in North America, giving rise to a liquidity crisis in most bond markets and negatively affecting not only the debt market but also the performance of the equity markets. The situation accentuated a trend that had already been noted for some time: divestment in Cash and Bond Funds. The returns, already low, worsened further, leading unit-holders to exit these products in a search for better alternatives, which the banks offered them essentially during the last quarter of the year, with remuneration rates well above inflation.
The deterioration of the economic and financial conditions throughout 2008 had a very negative impact on the Mutual Fund market not only at home but also at global level. Investors were confronted with decline of the value of securities as a whole, while they were offered, by the credit institutions, alternative investment solutions providing higher returns and a guarantee of capital invested. Thus the year 2008, was therefore marked by an ongoing, significant reduction of the amounts of Mutual Funds under management, caused by the decline of the value of the assets held by the Funds and, most particularly, by the divestment by investors.
19 Throughout the year total assets under management decreased by more than 44% to €14,342 million, the lowest figure since January 1997. The main cause was the subprime crisis and its consequences: during an initial stage, it gave rise to a shortage of liquidity in the debt markets and securities, leading to a reduction in the value of these assets; subsequently, it came to create difficulties for several financial institutions of global repute, which further worsened the scenario, causing even greater distortion of the risk/return factor. As a result, these funds, which historically involve low risk and a consistently positive, though not very high, return, became more volatile and, in several cases, generated negative returns, contributing to the divestment seen in 2008.
During the year 2009 was made to the recovery of the amounts placed in Mutual Funds, following the sharp drop seen in the second half of 2007 and in 2008, the result of the long economic and financial crisis originated by the subprime. Nearly everywhere in the world there was a significant increase of assets managed under instruments of this type, with several markets returning growths of more than 15%. In Portugal there was also the same trend of increasing assets managed by Mutual Funds seen around the world.
Considering harmonized and non-harmonized Funds, the total under management at the end of 2009 amounted to €17,231 million, a growth of 20.1%. There are essentially two reasons for this performance. On the one hand, the good performance of the financial markets, with a special focus on the equity segment, which caused an appreciation of the assets held by the Mutual Funds and, at the same time, awakened investor appetite for instruments of this type, with a view to benefiting from this appreciation.
Indeed, the great majority of domestic Mutual Funds generated a positive return in 2009, with two-digit performance in more than a third of the existing Funds. The second reason has to do with the decline of competition by other savings instruments, bank deposits in particular. With the reduction of short-term interest rates that act as the benchmark for the remuneration of these savings instruments, the interest rates paid by credit institutions fell and this fall cooled savers interest. At the same time, the easing of the difficulties in obtaining financing on the debt markets meant that the banks were no longer subject to so much pressure, reducing the need to attract new deposits.
20
3.1. Equity Funds
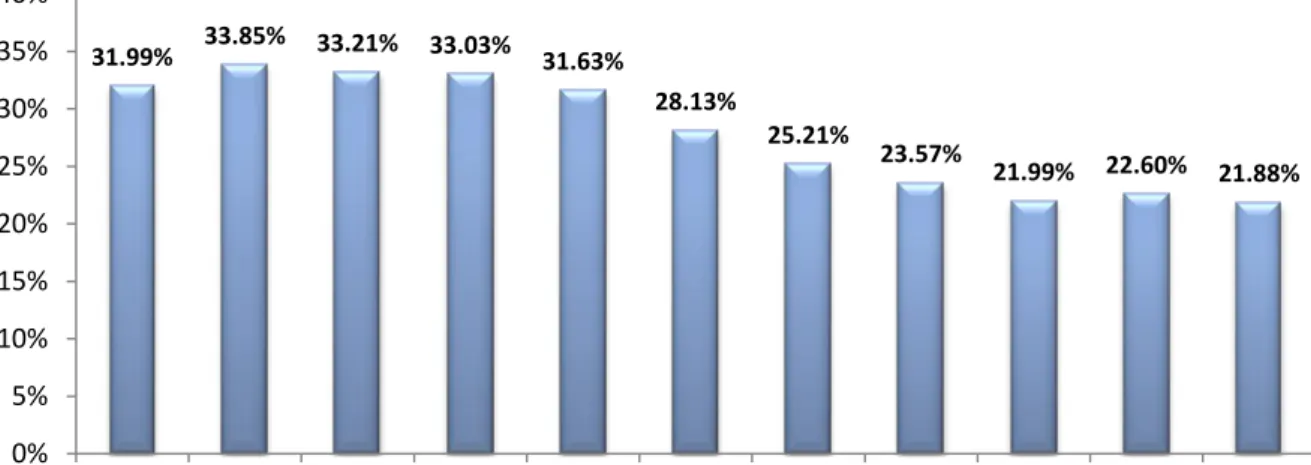
In the second half of the 90s, there was strong growth in applications of the mutual funds in 1997 (48.5%), which resulted from a dynamic occurring in all fund categories, especially in equity funds. There was a high rate of growth in equity funds, resulting from favorable European exchanges in general, and the Portuguese in particular. The slowdown in investment in equity funds and mixed from 2000 was basically a consequence of, the sharp depreciation in principal indices of shareholder segment during this period.
Graphic 3: Weight of Equity Funds in Mutual Funds
Source: APFIPP
The good performance of the stock markets allied to the appreciation of the U.S. dollar had a favorable effect on the Equity Funds, which, without exception, returned a profit in 2005. Almost all the Equity Funds grew at an annual rate of more than 15% and there were cases of Funds that exceeded the 50% mark.
31.99% 33.85% 33.21% 33.03% 31.63% 28.13% 25.21% 23.57% 21.99% 22.60% 21.88% 0% 5% 10% 15% 20% 25% 30% 35% 40%
21 Graphic 4: Evolution of Equity Funds Applications
Source: APFIPP
The amounts managed by Equity Funds increased by nearly 27% during the year, driven not only by these results and by the consequent capitalization of assets held, but also by the increased demand from investors wanting to access them.
In the year 2006, while the markets generally returned gains they were, in some case, partially or totally offset by the effect of the appreciation of the Euro against other currencies such as the Japanese yen or the U.S. Dollar. In fact, Equity Funds that invested in these markets or have a currency exposure in these currencies were the ones that generated the worst returns. Of the others, the focus is on the performance of Funds that invest on the domestic market, with annual returns of more than 20% and, in some cases, breaking the 30% barrier. Driven by these results and by the consequent capitalization of assets held and by the consequent investor demand, the amounts managed by Equity Funds increased 34.64%, to €2,985 million.
By the end of June 2007 the Equity Funds had grown significantly, driven by the returns they provided which, at the same time, attracted new subscriptions by savers attempting to access the returns that these Funds were presenting. During the next half, for the stated reasons, the situation reversed with the drop of the leading stock market indices exerting pressure on the portfolio assets and, at the same time, with the exit of investors, who took advantage of the situation to redeem their investments and take the accumulated profits. However, the year‟s
-3.10% -28.16% -38.86% 12.87% 5.79% 26.47% 34.64% 10.65% -66.39% 36.58% -80% -60% -40% -20% 0% 20% 40%
22 balance was positive. Equity Funds grew 10.65% owing to the returns provided by most of the Funds.
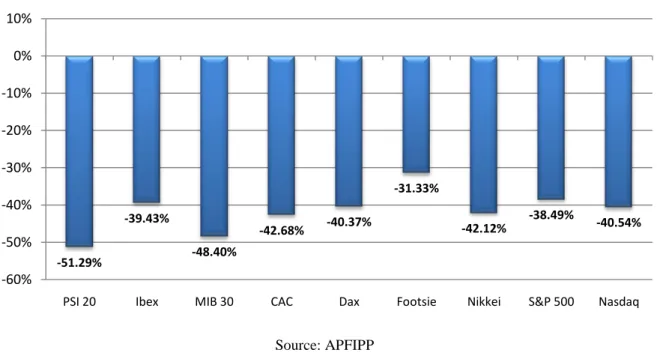
The year 2008 was marked by the sharp drop of the world‟s main equity markets, as seen in the analysis of the performance of their reference equity indices. The Portuguese market stood out for its negative performance, with the PSI-20 retreating more than 50%, the worst case amongst the indices considered. Of the remainder, various fell by over 40% and none performed better than a loss of 30%. This obviously conditioned the evolution of Equity Funds during that year. On the one hand, the performance of the equity markets caused a significant depreciation of the amounts in the portfolio, reflected in the negative returns presented by all Equity Funds. For these reasons, the Equity Funds returned a decrease of 66.39% of the amounts under management in 2008 and, at the end of December, stood at €1,110 million.
Graphic 5: Equity Market Performance in 2008
Source: APFIPP
Despite the economic environment, the Management Companies‟ confidence in this type of instrument continued, as demonstrated by the fact that none of these Funds were wound up, and for this reason the total number of active Equity Funds at the end of 2008 increased to 66, compared to the 64 that existed at the end of the previous year.
-51.29% -39.43% -48.40% -42.68% -40.37% -31.33% -42.12% -38.49% -40.54% -60% -50% -40% -30% -20% -10% 0% 10%
23 In 2009 the world‟s equity markets recouped part of their losses returned over the previous 18 months. Most of the equity indices that act as benchmark for the leading stock markets appreciated very well, with a focus on the performance of the Lisbon Stock Exchange with the PSI-20 rising 33.5%. The good performance of the equity markets exercised a positive influence on Equity Funds, which grew by 36.58% during 2009. The number of active Equity Funds fell from 66 in 2008 to 63 at the end of 2009, the result of the transfer of two Funds for another category and of the merger of a third Fund.
4. Performance Measures of Mutual Funds
Mutual Fund industry today, with about 30 players and more than six hundred schemes, is one of the most preferred investment avenues. However, with the multiplicity of schemes to choose from, the retail investor faces problems in selecting funds. Factors such as investment strategy and management style are qualitative, but the funds record is an important indicator too. Though past performance alone cannot be indicative of future performance, it is, the only quantitative way to judge how good a fund is at present.
Therefore, there is a need to correctly assess the past performance of different Mutual Funds. Returns alone should not be considered as the basis of measurement of the performance of a Mutual Fund scheme, it should also include the risk taken by the fund manager because different funds will have different levels of risk attached to them. Risk associated with a fund, in general, can be defined as variability or fluctuations in the returns it generated. The higher the fluctuations in the returns of a fund during a given period, the higher will be the risk associated with it. These fluctuations in the returns generated by a fund are resultant of two guiding forces. First, general market fluctuations, which affect all the securities, present in the market, called Market risk or Systematic Risk and second, fluctuations due to specific securities present in the portfolio of the fund, called Unsystematic risk. The Total Risk of a given fund is sum of these two and is measured in terms of standard deviation of returns of the fund.
24 Beta represents the systematic risk, which correspond to fluctuations in NAV of fund against benchmark, thus calculated through the returns of mutual funds and market of reference. The more receptive NAV of mutual fund is to the alterations occurred in the market, the higher will be its beta. Using the relation between risk and return, it was tried to evaluate the competitive strength of both in better method. Thus, since 1960s, various known authors developed various studies for determining and evaluating the risk of investment in funds using its returns.
The most important and generally accepted measures of performance used are:
Capital Asset Pricing Model (CAPM)
Jensen Measure
Treynor Measure
Sharpe Measure
4.1. Capital Asset Pricing Model (CAPM)
The major measures used to analyze the performance of investment funds are based on the CAPM developed by Sharpe (1964), Linter (1965) and Mossin (1966).
The CAPM model relies on these assumptions:
The objective of investors is to maximize their goal in each period;
Investors take into account in their decisions the expected return and variance of their investments;
Investors are risk averse;
All investors share the same investment horizon and the same homogeneous expectations in relation to risk and return;
There are not transaction costs and all investors have free access to the available information;
All assets are infinitely divisible;
The risk-free rate used in this model is identical for all investors, which can be used either for lending or borrowing capital;
25 According to CAPM model, the expected return of a portfolio or security is linearly related to the expected return on the market, by equation (1):
(1)
The is the expected return of portfolio in period , the variable is return of asset without risk for the period , the variable is the systemic risk of the portfolio in period , and the variable is the expected return of portfolio market in period . One of the most debated points in CAPM is the choice of the benchmark, that is, the market of reference, because CAPM model is consisted with existence of a market portfolio constituting of all available assets weighted by value of each in the total market. This portfolio is not possible to replicate, so it uses the benchmark as an alternative. As this model is ex-ante analysis (forecast) and market evolution is not evident, experimental analysis of this model involves the ex-post data, and following the previous equation:
(2)
The residual variable, , has an expected value of zero and variance equal to a constant ( ). The correlation between this variable and the returns of market doesn‟t exist ( ). As the market is not always necessarily in equilibrium, some securities may not be correctly evaluated by the previous equation, which does not restrict the regression to go through the origin, meaning that the equation must then assume this new form:
(3)
In equation (3) the variable measure the imbalance in the portfolio . This variable with positive value means that the portfolio had a positive risk adjusted performance. Thus analyzing the performance of a mutual fund and taking in account the assumptions of the CAPM, a positive value of shows that the capacity of the fund manager to build a portfolio, adjusted for systemic risk, exceeds the performance of the market. Jensen (1968) and Treynor (1965) developed models that have as objective to evaluate the performance of
26 portfolios or securities, and these measures derive directly from formulation of the CAPM. The variable is also referred to as Jensen (1968) measure.
4.2. Jensen Measure
The Jensen measure has the alternative formulation as follows:
(4)
The variable is the ratio of Jensen for the portfolio in period , although other variables have the same significance. This measure, while equivalent to of CAPM equation, is from an operational point of view the easier way to calculate, because the value of parameter beta is the only necessary estimation for calculation of this ratio. This measure, projected by Jensen (1968), shows the difference between the return of portfolio fund and the return of the benchmark and simultaneously, with a beta equal to the fund, both excess returns are reduced by the return generated by the risk free instruments. Thus, the difference between the risk premium of the fund and the risk premium of a market of reference
, will show if the fund manager was successful or failed in the selection of securities
constituting the fund portfolio.
4.3. Treynor Measure
Another measure that has as objective the performance evaluation and is based on Security Market Line (SML) was proposed by Treynor (1965). Such as the Jensen's measure, this model also relies on the risk market measure (beta) as a measure of risk and thus its equation is:
–
27 The measure is the Treynor ratio and other variables have the meaning explained
previously. This ratio highlights the excess return or risk premium of the fund, per unit of systemic (or non diversifiable) risk. Considering the measure as the value of excess return of the portfolio that replicates the market index, per unit of systematic risk of the market, then, when < (or > ) the performance of fund was superior (or inferior) of the market. The investors that are risk-averse want to maximize this value, because a high and positive Treynor ratio shows a superior performance of a fund adjusted by its non diversifiable risk, and a low and negative Treynor ratio, with the same adjusted, indicates that the performance is unfavorable.
4.4. Sharpe Measure
The Treynor and Sharpe Measure are very similar, however, like mentioned previously, the first ratio uses beta of portfolio as the relevant risk measure while in the second ratio the risk is the total risk of the portfolio. So the equation is:
–
(6)
The measure is the value of the Sharpe ratio for the portfolio in period . Thus as this ratio uses the total risk, corresponding to , the standard deviation of the portfolio in period . So, this measure has as objective to evaluate the excess of return of fund, reduced by that of the asset without risk, per unit of total risk. A Sharpe ratio with a high and positive value shows a superior performance of a fund, adjusted by risk, and a low and negative Sharpe Ratio, with the same adjusted, is an indication of unfavorable performance.
As said previously, Sharpe and Treynor measures are similar, because these ratios both divide the excess return by a risk measure. The total risk used in Sharpe measure is adequate when it is evaluated the relationship between risk and return for portfolios with good diversification. That is, the systematic risk is the good measure of risk when it is used portfolios with poor diversification or individual stocks. Thus, for well-diversified portfolio,