Tatiane C. de Godoy
[email protected] Department of Mechanical Engineering S˜ao Carlos School of Engineering University of S˜ao Paulo 13566-590 S˜ao Carlos, SP, BrazilMarcelo A. Trindade
[email protected] Department of Mechanical Engineering S˜ao Carlos School of Engineering University of S˜ao Paulo 13566-590 S˜ao Carlos, SP, BrazilEffect of Parametric Uncertainties on the
Performance of a Piezoelectric Energy
Harvesting Device
The use of piezoelectric materials for the development of electromechanical devices for the harvesting or scavenging of ambient vibrations has been extensively studied over the last decade. The energy conversion from mechanical (vibratory) to electrical energy is provided by the electromechanical coupling between mechanical strains/stresses and electric charges/voltages in the piezoelectric material. The majority of the studies found in the open literature present a tip-mass cantilever piezoelectric device tuned on the operating frequency. Although recent results show that these devices can be quite effective for harvesting small amounts of electrical energy, little has been published on the robustness of these devices or on the effect of parametric uncertainties on the energy harvested. This work focuses on a cantilever plate with bonded piezoelectric patches and a tip-mass serving as an energy harvesting device. The rectifier and storage electric circuit was replaced by a resistive circuit (R). In addition, an alternative to improve the harvesting performance by adding an inductance in series to the harvesting circuit, thus leading to a resonant circuit (RL), is considered. A coupled finite element model leading to mechanical (displacements) and electrical (charges at electrodes) degrees of freedom is considered. An analysis of the effect of parametric uncertainties of the device on the electric output is performed. Piezoelectric and dielectric constants of the piezoelectric active layers and electric circuit equivalent inductance are considered as stochastic parameters. Mean and confidence intervals of the electric output are evaluated.
Keywords: energy harvesting, energy scavenging, uncertainties, piezoelectric materials, resonant shunt circuits
Introduction
The use of piezoelectric materials for the development of energy harvesting devices has been largely studied over the last decade (Sodano, Inman and Park, 2004). The motivation for the use of such materials as energy harvesting devices is based on their vast employment as distributed sensors and actuators due to their large electromechanical coupling coefficient. Piezoelectric materials can be found in the form of thin monolithic patches or fiber reinforced composites which can be easily integrated into flexible structures without significant mass increase (Sodano, Lloyd and Inman, 2006; Trindade and Benjeddou, 2012). Thus, the conversion of vibratory energy into electrical energy through the electromechanical coupling of piezoelectric materials could be useful in several applications (Roundy, 2005; Beeby, Tudor and White, 2006).
Most of the research found in the open literature explores the use of eletromechanical resonant devices tuned to the operational resonance frequency of the host structure or machine in order to
maximize the electrical energy harvested or generated. The vast
majority of the considered devices are based on a cantilever beam with tip mass whose properties are tuned accordingly so that the device resonance frequency matches the operating frequency. The electrical energy is generated by one or more piezoelectric patches bonded to a cantilever substrate. Through their electrodes, the piezoelectric patches can convert part of their strain energy into useful electrical energy. This induced electric current should be directed to a proper electric circuit responsible for signal rectification and energy storage (Ottman et al., 2002; Guyomar et al., 2005; Guan and Liao, 2007).
The performance of these resonant devices for energy harvesting is greatly dependent on the adequate tuning between resonant and operation frequencies. Any mismatch due to variability of the device properties or operation frequency may lead to large performance
losses (Adhikari, Friswell and Inman, 2009). Therefore, the
Paper received 1 May 2012. Paper accepted 27 July 2012.
device’s resonant frequency should be very well estimated or known. Consequently, the predictive model considered to design the device may be extremely important. Although the majority of the studies found in the literature use one degree of freedom models to represent the cantilever beam with tip mass, this simplification may lead to an incorrect prediction of the resonance frequency of the device and, therefore, to an inadequate frequency tuning (Erturk and Inman, 2008).
Moreover, few studies have attempted to analyze the effect of parametric uncertainties on the energy harvesting performance. Ali, Friswell and Adhikari (2010) studied the effect of uncertainties of an energy harvesting device resonance frequency and damping factor on its performance. On the other hand, uncertainties of electric shunt circuits on piezoelectric shunt damping for passive and active-passive structural vibration control have been studied recently (Andreaus and Porfiri, 2007; Santos and Trindade, 2011).
Therefore, the main objective of this study is to perform an analyzis of the effect of parametric uncertainties of the piezoelectric
device on the harvested energy. A cantilever plate with bonded
piezoelectric patches and a tip-mass serves as the energy harvesting
device. Piezoelectric and dielectric constants of the piezoelectric
active layers and electric circuit equivalent inductance are considered
as stochastic parameters. Mean and confidence intervals of the
harvested energy output are evaluated. In addition, an assessment of energy harvesting performance quantification metrics was performed and an alternative analysis using the electric current per unit velocity is proposed.
Problem Description
A piezoelectric energy harvesting device can be designed using a cantilever plate partially covered with piezoelectric layers or patches and a tip mass to adjust the resonance frequency of the device. This was done here using an aluminium plate with dimensions
patches with dimensions 55 x 25 x 0.25 mm3are bonded, as shown in Fig. 1. The aluminium plate is clamped at one of its smaller sides to a moving base and a seismic mass is attached to the opposite side. The base is free to move in the transversal direction to represent the base excitation of the device. The material properties are: i) Aluminum – Young’s modulus 70 GPa, Poisson’s ratio 0.33, mass
density 2700 kg/m3; and ii) PZT-5A – ¯cD11=c22D =96.39 GPa, ¯cD12=
51.22 GPa, ¯cD44=c¯D55=39.63 GPa, ¯cD66=22.57 GPa, ¯h31=h¯32=
−1.677 109N C−1, ¯βε33=104.5 106 m F−1,ρpzt=7750 kg m−3.
The energy harvesting electric circuit is represented here by a simple
electric load with resistanceRc. The energy dissipated in the electric
resistance can be thought then as an upper limit to the potentially
harvested energy. In addition, an electric inductance Lc may be
connected in series to the harvesting circuit. If properly adjusted, the inductance may induce a resonant behavior in the circuit, increasing the electric current and, thus, the harvested energy.
TOP
V
IEW
PR
OFI
LE
V
IE
W
electrodes
Electric circuit
Electric circuit
Tip mass(W)
PZT patches(PZT-5A) Substratum(Al)
ENERGY HARVESTING
ENERGY HARVESTING
F 6055
1 0.25
2
25
Figure 1. Cantilever plate with two PZT transducers patches connected to an electric circuit for energy harvesting.
To maximize the energy harvesting performance, it is normally desirable to maximize the strains in the piezoelectric materials such that more vibratory energy is available to be converted to electric energy by the piezoelectric material. This can be done by maximizing the vibration amplitude of the cantilever plate for a given excitation which, in turn, suggests to match the operating (excitation) frequency
with the device natural frequency. In this work, the operating
frequency is assumed to be 100 Hz. A first estimate for the tip mass
Mwas set to 90 g so that the resonance frequency of the device in
open-circuit approaches 100 Hz.
In order to obtain a more practical device design, the tip mass was modeled such that its volume would be minimal and well distributed. Hence, tungsten was chosen due to its high mass density and the tip mass is considered to be a prismatic bar along the plate width with square cross-section, as shown in Fig. 1. It is worthwhile to notice that the tip mass moment of inertia is also accounted for in the model. The simulations performed in this work used a finite element model for laminated plates with piezoelectric layers connected to
electric circuits described in Godoy and Trindade (2011). The
model is based on an Equivalent Single Layer (ESL) formulation combined with First-order Shear Deformation Theory for which the
layers may have independent electric degrees of freedom. Each
piezoelectric layer may be connected to an independent electric circuit with resistance, inductance. The connection of circuits and patches considers that the electrodes entirely cover the patches surfaces resulting in an equipotential surface so that the electric charges
induced on the piezoelectric layers’ electrodes are transferred to the electric circuit. The equipotential surface may also be composed of several patches. Considering the equivalence between electric charges in the patches and in the circuits to which they are connected, the following coupled equations of motion can be written (Godoy and Trindade, 2011):
M 0
0 Lc
¨ u ¨ qc
+
C 0
0 Rc
˙ u ˙ qc
+
Km −Kme
−Kmet Ke
u qc
=
Fm 0
, (1)
where Km, Kme and Ke are the mechanical, piezoelectric and
dielectric stiffness matrices, respectively. MandCare the mass and
damping matrices andFmis a vector of mechanical forces.LcandRc
are diagonal matrices with the values of inductance and resistance of the shunt circuits.
The seismic mass was implemented in the model considering translational and rotational inertias at the free end of the cantilever plate and it was properly distributed in the corresponding finite
element nodes. A transversal force located at the moving base
(clamped end of the plate) was considered as excitation input. The transversal velocity at the same point is used as the measured mechanical output.
Mechanical and Electrical Frequency Responses
Evaluation
In order to evaluate the mechanical and electrical frequency response functions of the structure with piezoelectric patches connected to a single electric shunt circuit, a harmonic mechanical
excitation is considered, such thatFm=bfandf(t) =f e˜ jωt, whereb
is the vector of distribution of mechanical forces into the mechanical nodal degrees of freedom. Then, a point transversal velocity at the
device base, v(t) =ve˜ jωt, is considered as the mechanical output
and the electric current induced in the circuit, I(t) =Ie˜jωt, is
considered as the electrical output. Thus, it is possible to define the
frequency response functions from ˜v=GvF(ω)f˜(velocity output)
and ˜I=GIF(ω)f˜(electric current output). A modal decomposition
is considered for the nodal displacements such thatu=φα, where
φis the mass-normalized modal matrix andαare the corresponding
modal displacements. Hence, the modal displacements and circuit
electric charges are written, respectively, asα=α˜ejωt and qc=
˜
qcejωt. Considering the assumptions above, the equations of motion
(1) are rewritten as
(−ω2I+j2ωΛ Ω+Ω2)α˜−Kpq˜c=bφf˜, (2) (−ω2Lc+jωRc+Ke)q˜c−Ktpα˜ =0, (3)
where Kp=φtKme and bφ=φtb. Ω is a diagonal matrix of
squared eigenfrequencies for the structure with piezoelectric patches
in open-circuit. Λ is a diagonal matrix of modal damping factors,
thus it is supposed that the damping matrixCis diagonalized by the
undamped vibrations modes.
Solving (3) for ˜qcand substituting into (2), it is possible to write
˜
αin terms of the excitation amplitude ˜f. Then, the electric charge
output due to the mechanical excitation can be solved substituting the
obtained value of ˜αin (3).
The base (clamp) transversal velocity is written asv=cvu, where˙
measured. Thus, for the harmonic excitation ˜v=jωcφα˜ withcφ=
cvφ. Hence, the frequency response function of the velocity output
due to a mechanical excitation is defined asGvF=v˜/f, such that˜
GvF(ω) =jω(−ω2Lc+jωRc+Ke)cφ(−ω2Lc+jωRc+Ke)×
(−ω2I+j2Λ Ωω+Ω2)−KpKtp
−1
bφ. (4)
Notice that a resonant (RL) electric circuit may introduce an additional resonance frequency to the original structural resonance frequencies. These are coupled by the symmetric (but full) matrix
KpKtp which relates to the effective modal piezoelectric coupling.
The resonant electric circuit may also introduce an anti-resonance at the circuit resonance frequency.
The electric current output is obtained usingI=q˙cso that ˜I=
jωq˜cand the frequency response functionGIF=I˜/f˜is written as
GIF(ω) =jωKtp
(−ω2Lc+jωRc+Ke)×
(−ω2+j2Λ Ωω+Ω2)−KpKtp
−1
bφ. (5)
By comparing equations (4) and (5), it is noticeable that, unlike
the velocity frequency responseGvF, the electric current frequency
response GIF does not present the anti-resonance at the circuit
resonance frequency.
It is also worthwhile to analyze the average harvesting performance over a given frequency-range. This was done here using the average of the amplitude of the electric current frequency response
GIF, defined as
|G¯IF|=Zωt+∆ω/2
ωt−∆ω/2 |
GIF|dω, (6)
whereωtis the target harvesting frequency and∆ωis the
frequency-range considered.
An alternative analysis of energy harvesting performance could be performed using the induced electric current per unit velocity at the point of force application. It is suggested here that this measure better represents the conversion of motion into electric current and, thus, could be a better measure of efficiency in energy harvesting. This can be defined as
GIv(ω) =GIF(ω)/GvF(ω), (7) and thus may be evaluated by dividing equation (5) by equation (4).
To simplify the expressions above, consider the energy harvesting
performance over a narrow frequency-range∆ωaround the operating
frequencyωtto which the fundamental resonance frequencyωnof
the harvesting device was tuned. In this case, it is assumed that the structural response could be adequately represented by the first (fundamental) vibration mode. Thus, the nodal displacements are
approximated asu≈φnαn so that the frequency response function
of base velocity per unit applied forceGvFcan be rewritten as
GvF(ω) =jωcnbn(−ω2Lc+jωRc+Ke)(−ω2Lc+jωRc+Ke)×
(−ω2+j2ζnωnω+ω2n)−Kp2
−1 , (8)
wherecn=cvφn and bn=φtnb are the modal projections of the
output and input distribution vectors, ζn is the structural modal
damping factor for the fundamental vibration mode, andKp=φtnKme
represents the effective modal piezoelectric coupling coefficient. Notice that all parameters in (8) are scalars.
Similarly, the frequency response functions of circuit current
outputGIF andGIvread
GIF(ω) =jωKpbn
(−ω2Lc+jωRc+Ke)×
(−ω2+j2ζnωnω+ω2n)−K2p
−1 , (9)
GIv(ω) =Kpc−n1(−ω2Lc+jωRc+Ke)−1. (10) Electric Circuit Components Design
Two electric circuits were considered in this work. In both cases, the harvesting circuit (rectification and storage) is represented by constant electric impedance (resistance) supposing that the energy extracted (dissipated) from the plate by a resistive load could alternatively be stored in a real harvesting circuit. In the first case, only the equivalent resistive load is connected to the piezoelectric patches.
In the second case, an inductance is connected in series with the resistive load. The inductance provides an electrical resonance frequency to the circuit that may be tuned to the target operating frequency so that the circuit absorbs the energy from the structure when it vibrates with frequencies close to the target one.
In both cases, there may be optimal electric circuit parameters that maximize the amount of energy extracted from the structure. Although the values for the resistance, which represents the harvesting circuit, may be constrained by the harvesting circuit design, it is considered here that an optimal value for the resistance could be evaluated and then used as one of the design criteria for the harvesting circuit.
It was shown in previous studies on resistive shunted damping that a resistive circuit connected to a piezoelectric patch, bonded to a vibrating structure, acts like a viscoelastic material providing an effective loss factor that depends on the excitation frequency. The effective loss factor provided to the structure is maximized for the following resistance value (Trindade and Maio, 2008):
Rc= Ke
p
1−K2
n
ωn
,withKn2= K2p Keω2n
, (11)
whereKeis the effective dielectric stiffness of the patches (inverse
of their capacitance),ωn is the fundamental resonance frequency,
for the first bending vibration mode of the device with patches in
open-circuit, andKpis the modal piezoelectric coupling coefficient,
projection of the electromechanical stiffness matrix onto the first
bending vibration mode. Kn2 is the effective squared modal
electromechanical coupling coefficient which represents the ratio of energy converted by the piezoelectric material.
Substituting (11) into the frequency response expressions (8), (9) and (10) and after some algebraic manipulations and adimensionalization, these are rewritten as
GvF(ω) =jωωn−2cnbn(1+jδ
q
1−K2
n)×
(1+jδ
q
1−K2
n)(1−δ2+j2ζnδ)−Kn2)
−1 , (12)
GIF(ω) =jωKp−1bnKn2×
(1+jδ
q
1−K2
n)(1−δ2+j2ζnδ)−Kn2
GIv(ω) =KpKe−1c−n1(1+jδ
q
1−K2
n)−1, (14)
where the dimensionless frequency is defined asδ=ω/ωn.
In the case of resistive-inductive (resonant) circuit, techniques from the design of dynamic vibration absorbers can be used to design the circuit components in order to minimize the vibration amplitude of the structure. An optimum design would then indicate that an adequate amount of energy is being absorbed by the circuit and
then dissipated (or harvested). There are a number of different
techniques to design a dynamic vibration absorber but, in general terms, it is desired to design the circuit inertia (inductance) so that the circuit resonance frequency matches the operating frequency (or structural resonance frequency). Then, the resistance can be designed to provide the appropriate damping factor for the coupled resonances. The resistance and inductance that maximize the vibration amplitude reduction may be obtained using the formula (Godoy and Trindade, 2011)
Lc= Ke
ω2 n
, Rc= √
2KnKe
ωn
. (15)
An alternative formulation for the design of shunt circuits can be found in Thomas, De¨u and Ducarne (2009). Substituting Eq. (15) in Eqs. (8), (9) and (10) and with some algebraic manipulations, the frequency response functions are rewritten as
GvF(ω) =jωω−n2cnbn(1−δ2+jδ √
2Kn)×
(1−δ2+jδ√2Kn)(1−δ2+j2ζnδ)−Kn2
−1 , (16)
GIF(ω) =jωbnK−p1Kn2×
(1−δ2+jδ√2Kn)(1−δ2+j2ζnδ)−Kn2
−1 , (17)
GIv(ω) =KpKe−1c−n1(1−δ2+jδ √
2Kn)−1. (18)
Notice that for δ=1, that is when the excitation frequency
matches the natural frequency of the device, the frequency responses
GvF and GIF are controlled by the structural damping ζn and
the effective electromechanical coupling coefficientKn, while the
frequency responseGIvis controlled only byKn.
Energy Harvesting Performance Nominal Results
The performance of the energy harvesting device, shown in Fig. 1, was evaluated using the electric current frequency responses (5), (6) and (7) when subjected to a transversal force applied at the base (clamp). The two electric circuits, one purely resistive (R) and one resistive-inductive (RL), are considered and compared. Since the connection of the piezoelectric patches to the electric circuit (either R or RL) modifies the electric boundary condition (from the original open circuit condition), it is possible that the original tip mass does not guarantee a perfect tuning between operating and device resonance frequencies. The frequency response functions were evaluated using a reduced model obtained through projection onto a truncated modal basis composed of the first ten vibration modes.
Therefore, the value of the seismic mass was adjusted so that the resonance frequency, in the case of the resistive circuit, or the anti-resonance frequency, in the case of the resonant circuit, matches
the target operating frequency (ωt=100 Hz). For this purpose, the
value of the seismic mass was empirically adjusted to each electric
boundary conditions leading to 88.5 g and 91 g for the R and RL
circuits, respectively. For comparison purposes, the mass of the
aluminum plate with the two piezoelectric patches is 9.4 g.
The electric circuit parameters were evaluated using (11) and (15) and then fine tuned manually, in the case of the resonant circuit.
The optimal resistance for the resistive circuit was found to beRc=
13.3 KΩ. For the resonant circuit, the resistance was found to be
Rc=8.4 KΩand the inductanceLc=21.5 H. Notice that this value
of inductance is only attainable by using a synthetic inductance.
70 80 90 100 110 120 130
1 2 3 4 5 6 7
Frequency (Hz)
Amplitude I/F (mA/N)
R RL
(a)
10 20 30 40 50 60
2.5 3 3.5 4 4.5 5 5.5 6
Frequency band (Hz)
Electrical current average (mA/N)
R RL
(b)
70 80 90 100 110 120 130
5 10 15 20 25 30
Frequency (Hz)
Amplitude I/v (mA/(m/s))
R RL
(c)
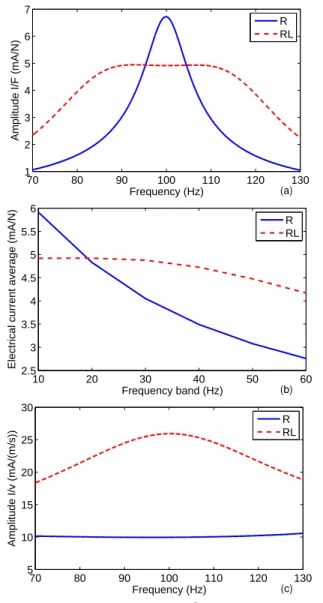
Figure 2. Nominal values forGIF(ω)(a),G¯IF(∆ω)(b) andGIv(ω)(c) for
resistive (R) and resonant (RL) circuits.
Figure 2a shows the nominal frequency response of the device, when excited by the transversal force, observed by the electric current induced in the circuit. It may be noted that at the peak frequency (100 Hz), the value obtained for the electric current per unit applied force is larger for the resistive circuit and, thus, does not justify the inclusion of the inductance. However, it may also be observed that the resonant circuit leads to a flatter performance level around the target frequency and, thus, may lead to a wider effective frequency range. Indeed, as shown in Fig. 2b, the average electric current induced in
the circuit over a frequency range centered at the target frequencyωt
average performance of the RL circuit is larger than the one of the R circuit for frequency ranges wider than 20 Hz. Therefore, this result indicates that in case of a variable or ill-known operating frequency or a mismatch between resonant and operating frequencies, the resonant circuit could yield a more robust performance.
It is well-known that a resonant circuit is generally more effective for reducing the structural vibration amplitude. Thus, it is reasonable to believe that, for a given applied transversal force, the input power is different for resistive and resonant circuits. Thus, an alternative analysis is performed for which the electric current induced in the circuit is evaluated per unit base velocity. It is suggested here that this could better represent the harvesting device effectiveness in terms of conversion of motion into electric current. Thus, Fig. 2c shows the amplitude of the frequency response of electric current per unit
velocityGIv, according to Eq. (7). Note that, in this case, the resonant
circuit is always more effective than the resistive one.
Given that the harvesting performance is very much dependent on a proper adjustment of the device geometric and material properties and circuit components, it is also worthwhile to analyze the effect of parametric uncertainties on the performance of harvesting devices using resistive and resonant circuits. Here, it is considered that the design of geometric properties should be sufficiently precise, whereas the piezoelectric material properties are generally not well-known and could be much less precise. In terms of circuit parameters, the inductance was found to have a much more important effect on the harvesting performance.
Stochastic Modeling for Uncertainty Quantification
This section presents an approach for analyzing uncertainties
of piezoelectric material propertiesh31 andβε33 and electric circuit
inductanceLc. An appropriate probabilistic model for each random
variable, denoted asX, is constructed accounting for the available
information only, which is the following: (1) the support of the
probability density function is]0,+∞[; (2) the mean values are such
thatE[X] =X¯; and (3) zero is a repulsive value for the positive-valued
random variables, which is accounted for by the conditionE[ln(X)] =
cXwith|cX|<+∞. The Maximum Entropy Principle yields a Gamma
probability density function for each stochastic variableX (Jaynes,
1957; Kapur, 1993; Soize, 2001; Ritto et al., 2010)
pX(X) =I]0,+∞[
1
δ2XX¯
δ−2 X Xδ−X2−1
Γ(δ−X2)exp
− X
δX2X¯
, (19)
in whichδX=σX/X¯ is the relative dispersion of stochastic variable
XandσX is its standard deviation (X∈ {hc31,βdε33,Lbc}). The Gamma
function is defined asΓ(α) =R0∞tα−1e−tdt.
Random realizations of the stochastic variables,
{hc31(θi), βdε33(θi), Lbc(θi)}, were then generated using MATLAB
function gamrnd. Then, four analyses were performed. First,
the effect of uncertainties on each individual stochastic variable
was evaluated. Thus, for each realization of a given stochastic
variable, the frequency response functions GdIF(ω) and GcIv(ω)
were evaluated. The average of the amplitude ofGdIF for different
frequency ranges, Gd¯IF(∆ω), was also evaluated. This allows to
analyze the individual effect of each stochastic variable. Then, the combined effect of all stochastic variables was evaluated. This was done by combining the vectors of realizations for each stochastic
variable into a set{hc31(θi), βdε33(θi), Lbc(θi)} for which the same
responses are evaluated (GdIF(θi,ω),GcIv(θi,ω),Gd¯IF(θi,∆ω)).
0 500 1000 1500 2000 2500 3000
0.5 1 1.5
(a)
0 500 1000 1500 2000 2500 3000
0.5 1 1.5
(b)
0 500 1000 1500 2000 2500 3000
0.5 1 1.5
(c)
Normalized convergence
0 500 1000 1500 2000 2500 3000
0.5 1 1.5
(d)
Number of simulations
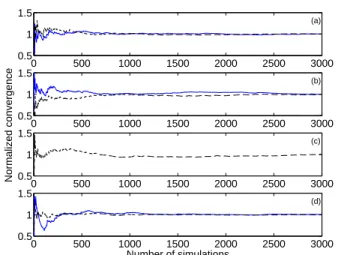
Figure 3. Mean square convergence for R (solid) and RL (dashed) circuits using as stochastic variables: (a) dielectric constantβcε
33, (b) piezoelectric constanthc31, (c) electric inductanceLbcand (d) all three simultaneously.
For all three stochastic variables, a relative dispersionδXof 10%
was considered. The mean-square convergence analysis with respect
to the independent realizations of random variableGdIF(ω), denoted
byGdIF(θj,ω)was carried out considering the function
conv(ns) = 1 ns
ns
∑
j=1Z
k|GdIF(θj,ω)| − |GNIF(ω)|k 2
dω, (20)
wherens is the number of simulations andGNIF(ω)is the response
calculated using the corresponding nominal model. Figure 3 shows the mean-square convergence analysis for the four cases considered. It is possible to observe that, for all cases, 1500 simulations seem to be enough to assure convergence.
The statistical analyses of the FRF amplitude outputs,GdIF(ω),
c
GIv(ω), Gd¯IF(∆ω), were performed using their 3000 realizations
to calculate the corresponding mean values and 95% confidence intervals. The 95% confidence intervals were evaluated using the
2.5% and 97.5% percentiles of the realizations of GdIF(θi,ω) and
c
GIv(θi,ω)frequency response amplitudes at each frequency and of
d¯
GIF(θi,∆ω)for each frequency-range∆ωconsidered.
Uncertainty Quantification Results
This section presents the uncertainty quantification results for each one of the four cases considered. For that, the mean values and
confidence intervals forGdIF(ω),Gd¯IF(∆ω)andGcIv(ω)are analyzed.
The main purpose of such analyses are to evaluate the effect of parametric uncertainties on the energy harvesting performance of standard (resistive or R) and resonant (RL) circuits.
First, the effect of dielectric constant βε
33 is analyzed. The
main motivation for such analysis is that, in general, only freeβσ33
or blockedβε33 dielectric constants are provided by manufacturers
70 80 90 100 110 120 130 0
2 4 6 8
Frequency (Hz)
Amplitude I/F (mA/N)
RL R
(a)
10 20 30 40 50 60
2 3 4 5 6 7
Frequency band (Hz)
Electrical current average (mA/N)
R RL
(b)
70 80 90 100 110 120 130
0 5 10 15 20 25 30
Frequency (Hz)
Amplitude I/v (mA/(m/s))
R RL
(c)
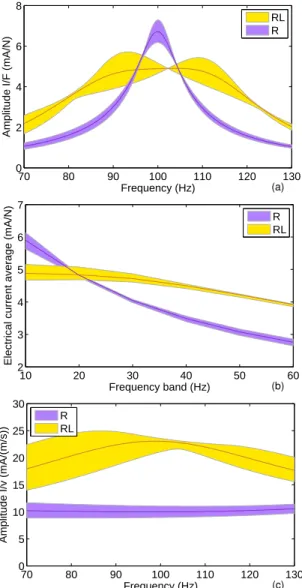
Figure 4. Mean values (solid) and confidence intervals (filled) forGdIF(ω)(a),
d¯
GIF(∆ω)(b) andGcIv(ω)(c) for resistive (R) and resonant (RL) circuits and
uncertain dielectric constantβcε 33.
a given patch deformation. Second, it affects the effective structural stiffness and, thus, resonance frequencies. Third, for a resonant circuit (RL), it affects the circuit resonance frequency and, thus, the proper tuning between circuit resonance frequency and target harvesting frequency.
Figure 4 shows the mean values and 95% confidence intervals for
d
GIF(ω), Gd¯IF(∆ω)andGcIv(ω)for resistive (R) and resonant (RL)
circuits. It can be noticed that, as expected, the performance of the resistive circuit is much less dependent on the dielectric constant and, thus, its corresponding confidence intervals are narrower. In a worst case scenario, the dielectric constant may reduce the energy harvesting performance of a resonant circuit by detuning the device (Fig. 4a). However, the efficiency of the resonant circuit is always superior to the resistive one (Fig. 4c), although more dependent on the dielectric constant and, thus, less robust. On the other hand, the average performance over a frequency-range is less sensitive to the dielectric constant and for all frequency-ranges considered, the resonant circuit seems to be more interesting since it widens the effective harvesting frequency-range of the device (Fig. 4b).
70 80 90 100 110 120 130
0 2 4 6 8
Frequency (Hz)
Amplitude I/F (mA/N)
RL R
(a)
10 20 30 40 50 60
2 3 4 5 6 7
Frequency band (Hz)
Electrical current average (mA/N)
R RL
(b)
70 80 90 100 110 120 130
0 5 10 15 20 25 30
Frequency (Hz)
Amplitude I/v (mA/(m/s))
R RL
(c)
Figure 5. Mean values (solid) and confidence intervals (filled) forGdIF(ω)(a),
d¯
GIF(∆ω)(b) andGcIv(ω)(c) for resistive (R) and resonant (RL) circuits and
uncertain piezoelectric constanthc31.
In a second analysis, the effect of uncertainties of piezoelectric
constanth31 on the energy harvesting performance is analyzed. It is
expected that, for both resistive and resonant circuits, the higher the piezoelectric constant the better, since this constant affects directly the amount of mechanical energy converted into electrical energy and, thus, potentially harvested. Thus, in opposition to the previous case, the piezoelectric constant does not detune the device, but instead amplifies (or reduces) the amount of energy potentially harvested.
Figure 5 shows the effect of uncertain piezoelectric constant
c
h31on the energy harvesting performance through mean values and
confidence intervals forGdIF(ω),Gd¯IF(∆ω)andGcIv(ω)for resistive
(R) and resonant (RL) circuits. One may notice that the confidence intervals for the resistive circuit are wider than in the previous case. In the case of resonant circuit, the harvesting performance confidence interval is very wide at the target frequency (100 Hz) as shown in Fig. 5a, although it shrinks significantly over increasing frequency-ranges (Fig. 5b). As in the previous case, the device efficiency is always superior for a resonant circuit (Fig. 5c).
70 80 90 100 110 120 130 0
2 4 6 8
Frequency (Hz)
Amplitude I/F (mA/N)
RL
(a)
10 20 30 40 50 60
3.8 4 4.2 4.4 4.6 4.8 5 5.2
Frequency band (Hz)
Electrical current average (mA/N)
RL
(b)
70 80 90 100 110 120 130
0 5 10 15 20 25 30
Frequency (Hz)
Amplitude I/v (mA/(m/s))
RL
(c)
Figure 6. Mean values (solid) and confidence intervals (filled) forGdIF(ω)
(a),dG¯IF(∆ω)(b) andGcIv(ω)(c) for resonant circuit and uncertain circuit
inductanceLbc.
considered as uncertain, consequently only the resonant circuit device is analyzed. This analysis is motivated by the fact that, in practice, synthetic inductance circuits should be used to attain the very high inductance values required. These circuits are composed of a number of electronic components which are subjected to uncertainties and/or variabilities. Figure 6 shows the mean values and 95% confidence
intervals forGdIF(ω),Gd¯IF(∆ω)andGcIv(ω). As expected, the main
effect of circuit inductance uncertainties is to detune the device,
although dispersion of GdIF is almost negligible for a frequency
near the target one (around 101 Hz), as shown in Fig. 6a. This
frequency could be designed to match the target one in order to obtain a harvesting performance robust to uncertainties of the circuit inductance. On the other hand, the detuning does not significantly affects the average harvesting performance (Fig. 6b).
Finally, an analysis of the effect of simultaneous uncertainties of the previous three parameters on the energy harvesting performance
is performed. In this case, the realizations of dielectric constantβdε33,
piezoelectric constanthc31 and circuit inductanceLbcwere combined
to evaluate the mean values and 95% confidence intervals ofGdIF(ω),
70 80 90 100 110 120 130
0 2 4 6 8
Frequency (Hz)
Amplitude I/F (mA/N)
RL R
(a)
10 20 30 40 50 60
2 3 4 5 6 7
Frequency band (Hz)
Electrical current average (mA/N)
R RL
(b)
70 80 90 100 110 120 130
0 5 10 15 20 25 30
Frequency (Hz)
Amplitude I/v (mA/(m/s))
RL R
(c)
Figure 7. Mean values (solid) and confidence intervals (filled) forGdIF(ω)(a),
d¯
GIF(∆ω)(b) andGcIv(ω)(c) for resistive (R) and resonant (RL) circuits and
uncertain parametersβcε
33,hc31andLbc.
d¯
GIF(∆ω) and GcIv(ω). The results are shown in Fig. 7. As
expected from the previous analyses, the confidence intervals for the resonant circuit are wider than those for the resistive circuit. The predicted harvesting performance for resistive and resonant circuits
at the target frequency is the same when measured byGdIF (Fig. 7a),
however the performance of the resonant circuit device is superior when considering average performance over a wider frequency-range (Fig. 7b). In terms of efficiency, the resonant circuit device is also always superior to the resistive one (Fig. 7c).
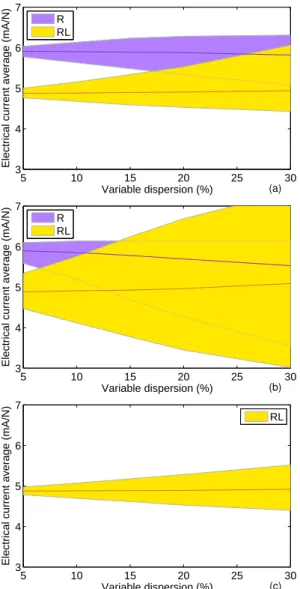
Previous results were obtained considering a 10% dispersion for the stochastic variables. It is worthwhile to notice that neither the stochastic model (Gamma probability density function) nor its parameters (mean and dispersion) were validated since no real measurements were available for the three parameters considered. While it is quite reasonable to consider the data provided by the
manufacturer (forβε33andh31) and design value (forLc) as nominal
values and confidence intervals for various parameters dispersions are shown in Fig. 8. Notice that the mean values of the electric current average do not change substantially for increasing parameters
dispersions. On the other hand, as expected, higher parameters
dispersions yield wider confidence intervals. Comparison of Figs. 8a, 8b and 8c shows that the electric current average confidence intervals are more sensitive to increases in the dispersion of piezoelectric
material constanth31.
5 10 15 20 25 30
3 4 5 6 7
Variable dispersion (%)
Electrical current average (mA/N)
R RL
(a)
5 10 15 20 25 30
3 4 5 6 7
Variable dispersion (%)
Electrical current average (mA/N)
R RL
(b)
5 10 15 20 25 30
3 4 5 6 7
Variable dispersion (%)
Electrical current average (mA/N)
RL
(c)
Figure 8. Confidence interval of the electric current average over a 10 Hz frequency band for several parameters dispersions. a)βcε
33, b)hc31and c)Lbc.
Conclusions
The effect of parametric uncertainties on the performance of a piezoelectric energy harvesting device was analyzed. A cantilever plate with bonded piezoelectric patches and a tip-mass serves as the energy harvesting device. Piezoelectric and dielectric constants of active layers and inductance of electric circuit were considered
as stochastic parameters. Mean and confidence intervals of the
electric output were evaluated. Results have shown that, for
10% dispersion on the three parameters considered, the predicted harvesting performance for resistive circuits at the target frequency is more important than the one for resonant circuits, when measured
by GIF; however, the performance of the resonant circuit device
is superior when considering average performance over a wider
frequency-range ¯GIF. In terms of efficiency, measured by electric
current induced in the circuit per unit base velocityGIv, the resonant
circuit device is always superior to the resistive one. All parameters considered as stochastic are relevant to the harvesting performance confidence intervals. For the resonant circuit, the dielectric material constant and electric circuit inductance affect mainly the proper tuning between resonance and operating frequency, while the piezoelectric material constant leads only to amplification/reduction of the harvesting performance.
Acknowledgements
The authors acknowledge the financial support of the
MCT/CNPq/FAPEMIG National Institute of Science and Technology on Smart Structures in Engineering, grant no.574001/2008-5, and CAPES Pro-Engenharias 086/2008.
References
Adhikari, S., Friswell, M.I. and Inman, D.J., 2009, “Piezoelectric energy harvesting from broadband random vibrations,”Smart Materials and Structures, 18(11):115005.
Ali, S.F., Friswell, M.I. and Adhikari, S., 2010, “Piezoelectric energy harvesting with parametric uncertainty,” Smart Materials and Structures, 19(10):105010.
Andreaus, U. and Porfiri, M., 2007, “Effect of electrical uncertainties on resonant piezoelectric shunting,”Journal of Intelligent Material Systems and Structures, 18(5, pp. 477-485.
Beeby, S.P., Tudor, M.J. and White, N.M., 2006, “Energy harvesting vibration sources for microsystems applications,”Measurement Science and Technology, 17(12), pp. R175-R195.
Erturk, A. and Inman, D.J., 2008, “Issues on mathematical modeling of piezoelectric energy harvesters,” Smart Materials and Structures, 17(6):065016.
Godoy, T.C. and Trindade, M.A., 2011, “Modeling and analysis of laminate composite plates with embedded active-passive piezoelectric networks,”Journal of Sound and Vibration, 330, pp. 194-216.
Guan, M.J. and Liao, W.H., 2007, “On the efficiencies of piezoelectric energy harvesting circuits towards storage device voltages,”Smart Materials and Structures, 16(2), pp. 498-505.
Guyomar, D., Badel, A., Lefeuvre, E. and Richard, C., 2005, “Toward energy harvesting using active materials and conversion improvement by nonlinear processing,”IEEE Transactions on Ultrasonics, Ferroelectrics, and Frequency Control, 52(4), pp. 584-595.
Jaynes, E.T., 1957, “Information theory and statistical mechanics,”
Physical Review, 106(4), pp. 620-630, 108(2), pp. 171-190.
Kapur, J.N., 1993, “Maximum-Entropy Models in Science and Engineering”, Wiley Eastern Limited, New Delhi.
Ottman, G.K., Hofmann, H.F., Bhatt, A.C. and Lesieutre, G.A., 2002, “Adaptive piezoelectric energy harvesting circuit for wireless remote power supply,”IEEE Transactions on Power Electronics, 17(5), pp. 669-676.
Ritto, T.G., Soize, C. and Sampaio, R., 2010, “Stochastic dynamics of a drill-string with uncertain weight-on-hook,”Journal of the Brazilian Society of Mechanical Sciences and Engineering, 32(3), pp. 250-258.
Roundy, S., 2005, “On the effectiveness of vibration-based energy harvesting,”Journal of Intelligent Material Systems and Structures, 16(10), pp. 809-823.
Santos, H.F.L. and Trindade, M.A., 2011, “Structural vibration control using extension and shear active-passive piezoelectric networks including sensitivity to electrical uncertainties,” Journal of the Brazilian Society of Mechanical Sciences and Engineering, 33(3), pp. 287-301.
Sodano, H.A., Inman, D.J. and Park, G., 2004, “A review of power harvesting from vibration using piezoelectric materials,”Shock and Vibration Digest, 36(3), pp. 197-206.
Sodano, H.A., Lloyd, J. and Inman, D.J., 2006, “An experimental comparison between several active composite actuators for power generation,”
Smart Materials and Structures, 15(5), pp. 1211-1216.
uncertainties in transient elastodynamics,”Journal of the Acoustical Society of America, 109(5), pp. 1979-1996.
Thomas, O., De¨u, J.-F. and Ducarne, J., 2009, “Vibrations of an elastic structure with shunted piezoelectric patches: efficient finite element formulation and electromechanical coupling coefficients,” International Journal for Numerical Methods in Engineering, 80(2), pp. 235-268.
Trindade, M.A. and Benjeddou, A., 2012, “Parametric analysis of effective material properties of thickness-shear piezoelectric macro-fibre composites,”Journal of the Brazilian Society of Mechanical Sciences and Engineering, 34, pp. 352-361.