concepts from viscoelasticity and damage mechanics
Lucas Feitosa de Albuquerque Lima Babadopulos1, Jorge Barbosa Soares2,Verônica Teixeira Franco Castelo Branco3
Resumo: O futuro método brasileiro de dimensionamento de pavimentos asfálticos possivelmente recomendará, em um nível básico, a realização do ensaio de compressão diametral de carga repetida como ferramenta para a caracterização de fadiga de misturas asfálticas. Em um nível mais avançado, caracterizações mecanísticas incluem a obtenção de propriedades de dano para posterior simulação do comportamento do material. Neste trabalho, duas misturas asfálticas foram avaliadas. A mais rígida delas foi obtida após o envelhecimento da mistura asfáltica original. Estas apresentaram comportamentos seme-lhantes quanto às propriedades de dano (curva característica de dano segundo o Simplified Viscoelastic Continuum Damage - S-VECD - model). Porém, a mistura asfáltica envelhecida necessitou de seis vezes mais ciclos até a ruptura do material durante o ensaio por compressão diametral, se comparada à mistura asfáltica de referência. O controle da força aplicada durante os pulsos de carga, em vez da tensão, leva à execução de carregamentos diferentes em materiais diferentes. Não havendo inversão do sinal do carregamento, a fluência se acumula levando o material ao dano e à ruptura. Misturas asfálticas mais rígidas e com parcela de comportamento viscoso menos pronunciada tendem a apresentar melhor resposta (maior nú-mero de repetições de carga antes da ruptura) nesse ensaio. Consequentemente, seu uso pode levar a falsas conclusões sobre a resistência à fadiga de misturas asfálticas.
Palavras-chave: caracterização de fadiga, propriedades de dano S-VECD, tensão controlada, caracterização mecanística, misturas asfálticas.
Abstract: The upcoming Brazilian asphalt pavement design method is likely to recommend, in a more basic level, the controlled force indirect tensile fatigue test as a tool for asphalt mixture fatigue characterization. In a more advanced level, mechanistic characterization includes the damage properties measurement for subsequent material behavior simulation. In this paper two different asphalt mixtures were investigated. The stiffer one was obtained after aging of the original mix. They presented similar behavior when it comes to damage properties (damage characteristic curve following the Simplified Vis-coelastic Continuum Damage - S-VECD - model). However, the aged mix needed six times more cycles to failure, compared to the original one, in the indirect tensile fatigue test. The force control, instead of the stress control, leads to the application of different stresses for different materials. As there is no signal inversion, creep flow accumulates, leading to damage and failure. Stiffer mixtures and mixtures presenting less viscous behavior tend to present a better response when those tests are considered. Consequently, it can lead to false conclusions about asphalt mixture fatigue resistance.
Keywords: fatigue characterization, S-VECD damage properties, controlled stress, mechanistic characterization, asphalt mixtures. 1. INTRODUCTION
Asphalt pavements rarely fail due to ultimate loads. Rather, load repetition causes different phenomena within the asphalt layer leading to pavement distresses. Those phe-nomena are influenced by climate, traffic and pavement structure. One of the main distresses in asphalt pavements is the fatigue failure of the surface layer, which is driven by the loading repetition that induces the fatigue phenomenon and is controlled by the asphalt mixture damage behavior. A manner in which fatigue presents itself is the so-called alligator fatigue cracking. Some indices obtained in the field are based on the distribution of this type of crack in the pavement surface. Typically, 20% of cracked area is con-sidered as pavement failure due to fatigue. However, indi-ces like those are not meaningful in laboratory fatigue tests. Instead, the number of cycles to failure at a given load level
or, alternatively, the material damage characteristics, which translate the damage behavior of the material, are obtained. Repeated load laboratory tests in cylindrical, prismatic or trapezoidal specimens are mostly used to induce damage to samples and to produce information for fatigue analysis. Homogeneous tests, as the axial tension-compression tests in cylinders, are preferable, in order to produce data exploit-able in a simpler manner, using results from experiments which are more likely to be consistent with the modeling hypotheses (Di Benedetto and De La Roche, 1998).
There are different ways to estimate in-field fatigue evolution using laboratory tests. For example, results of number of cycles to failure from the controlled force indi-rect tensile tests in cylindrical samples can be used to con-struct Whöler curves (log-log straight lines relating the number of cycles to failure to the either an indicator of the stress or of the strain level) using data obtained at different predefined stress levels. A material performance database is needed in order to establish values for laboratory-to-field shift factors. Those factors translate how the laboratory test "accelerates" the fatigue phenomenon with respect to field performance and they are used to estimate the service life of a proposed pavement structure using the results from Whöler curves and pavements elastic analysis. The elastic analysis is commonly performed using the resilient modu-lus as the stiffness parameter for the asphalt layer. There are many issues related to such approach which lead to shift factors of the order of 104 as used in Brazil, and that is a 1 Lucas Feitosa de Albuquerque Lima Babadopulos, Laboratório de
Mecânica dos Pavimentos, Departamento de Engenharia de Transportes, UFC.([email protected])
2 Jorge Barbosa Soares, Laboratório de Mecânica dos Pavimentos,
Departamento de Engenharia de Transportes, UFC. ([email protected])
3 Verônica Teixeira Franco Castelo Branco, Laboratório de Mecânica
dos Pavimentos, Departamento de Engenharia de Transportes, UFC. ([email protected])
Manuscrito recebido em 12/03/2015 e aprovado para publicação em 22/06/2015.
Este artigo é parte de TRANSPORTES v. 23, n. 2, 2015. ISSN: 2237-1346 (online). DOI: 10.14295/transportes.v23i2.898
main concern of this paper. Some of those issues are ad-dressed herein. Brazil is currently undergoing a national ef-fort to develop its own mechanistic-empirical asphalt pave-ment design method, based on a national pavepave-ment material database and on the performance of test sections monitored throughout the country. A first version of the design guide is planned for 2016 and it will possibly use the aforemen-tioned state-of-the-practice method to predict fatigue life. It should be pointed out that the design method is being de-veloped in such a way to allow incorporating future im-provements in material characterization. Therefore, the de-velopment of better fatigue prediction models with corre-spondence to field data is encouraged. In this sense, this pa-per attempts to call attention for a potential method that can be used in the near future in our country, once it gathers the proper validation.
Another way of estimating the fatigue life of asphalt pavements is by measuring damage properties (as for exam-ple damage characteristic curves following the Simplified Viscoelastic Continuum Damage - S-VECD - model) of the asphalt mixture prior to fatigue life estimation. Such pur-pose can be achieved by using the continuum damage the-ory, based on Schapery's work potential models. The re-ferred approach allows a more rigorous consideration of the loading conditions (including temperature and loading speed or frequency) prior to the estimation of the fatigue life and it is already in use in the United States (there is a pro-visional test standard available, AASHTO TP 107, 2014). The provisional standard proposes the application of the Simplified Viscoelastic Continuum Damage (S-VECD) model to represent asphalt mixture damage behavior. The direct tension-compression test is used because it induces a homogeneous state of stress, allowing easier interpretation of the test results.
The part of this paper dealing with viscoelastic dam-age characterization uses the method proposed by AASHTO TP 107 (2014) as a guideline to interpret damage behavior and to analyze fatigue resistance of two different asphalt mixtures. The materials prepared for testing differ only with respect to their stiffness (unaged and aged mix-ture). The interpretation of the controlled force indirect ten-sile tests results compiled in Whöler curves is compared with the interpretation of the controlled crosshead direct tension-compression tests.
2. LITERATURE REVIEW
This section briefly presents the concepts behind the models and the tests discussed in this paper. Extended ex-planation of every aspect covered is provided in Babadopu-los (2014).
2.1. State-of-the-Practice Characterization
The resilient modulus (RM) test is standardized in Brazil by ABNT (NBR 16018, 2011) and also by DNER (1994). Internationally, other standards and test protocols are available, such as the NCHRP 1-28A (2003). This test consists of a controlled force indirect tensile test with peri-ods of loading intercalated by rest periperi-ods. RM test in Brazil is typically conducted with 0.1s loading and 0.9s rest peri-ods, using the least force necessary to produce enough de-formation for the LVDT measurements or a low percentage of the indirect tensile strength (ITS). RM is defined as the
relation between the tension stress and the "recoverable" tension strain at the center of the specimen. The definition of "recoverable" strain varies from standard to standard, be-ing a portion of the total strain generated in a loadbe-ing cycle (Ponte et al., 2014). Because of the assumption that recov-erable strain is used in the RM calculation, it is considered that only elastic strain is present in the test, although this is not true for asphalt mixtures (Soares and Souza, 2003). Be-fore the loading cycles in which RM is measured, condi-tioning is applied to the sample. During the condicondi-tioning cycles, the RM value changes from a cycle to the following cycle more than during the cycles after that conditioning process. This happens because the material is viscoelastic and it flows more in the beginning of the test. The RM test is most commonly conducted in pneumatic testing ma-chines in Brazil.
The most used fatigue test in Brazil is the repeated load controlled force indirect tensile test, for which there is still no standard procedure. Percentages of the ITS of the material are used as reference stresses in the test, i.e., the corresponding load is applied to the specimen to generate that stress value in the mid center of the cylinder. Typically three samples per stress amplitude are used, and a log-log graph is produced with the number of cycles to failure against the difference between compression and tension stress in the midpoint of the cylinder specimen (Wöhler curves). Although it appears to be a controlled stress test, only the stress at the first cycle corresponds to the intended "controlled stress", because damage evolves in the material and the force applied to the sample is distributed in smaller cross sectional areas as the load cycles progress, until fail-ure. In addition, as loading is always imposed in the same direction (compression for the vertical diametral line and tension for the horizontal diametral line), failure is not caused only by fatigue. The loading can be interpreted as the sum of a constant creep loading and a deviator loading. Both excessive flow and deviator loading are capable of in-ducing damage to the sample, thus it is very difficult to ex-tract information related only to fatigue damage and failure from this test. This has been already observed in the litera-ture (Di Benedetto and De La Roche, 1998), and creep flow can actually be more important than the deviator (related to fatigue) response of asphalt mixtures depending on testing temperatures. Higher temperatures, such as 25ºC, lead to more creep flow and mislead repeated load controlled force test interpretation. Then, it is noticed that the test geometry used in the indirect tensile test appears to be determinant to the difficulty in obtaining useful data for fatigue prediction in the field. That is due to many reasons, such as inhomo-geneity, complex distribution of stress and strain in the sam-ple and difficulty in respecting modeling hypotheses (such as linearity, among others) during the tests. The reader may refer to Di Benedetto and De La Roche, 1998, Soares and Souza (2003), and Babadopulos et al. (2013) for further in-formation on the topic.
2.2. State-of-the-Art Characterization
2.2.1. Linear Viscoelastic Model
Prior to the fatigue characterization, linear viscoelas-tic testing and characterization is required. The main test used is the complex modulus test. It leads to the results of
dynamic modulus and phase angle, which represent the lin-ear viscoelastic behavior. It relates the amplitudes (dynamic modulus) and the delay (phase angle) of stress and strain signals in a steady state for a harmonic loading. It allows analytical accounting for temperature and time dependency of the material behavior. The complex modulus test consists of applying harmonic compressive loading and obtaining the resulting strains using LVDT's mounted to the sample. Samples of 100mm diameter by 150mm height are gener-ally used. AASHTO T 342 (2011) can be applied. Testing at different temperatures (temperature sweep) and using dif-ferent loading frequencies (frequency sweep) together with the application of the time-temperature (or frequency-tem-perature) superposition principle (TTSP) allows the con-struction of master curves for both the dynamic modulus and the phase angle. Prony series parameters can be ob-tained by fitting model prediction to storage modulus (real part of complex modulus, or the product between dynamic modulus and the cosine of the phase angle) and used to es-timate other linear viscoelastic properties. The absolute value (or norm) of the complex modulus ( E* , known as dynamic modulus) grows with the increase in loading fre-quency, and decreases with growing temperature. This property, along with the phase angle (lag between stress and strain signals), describes the linear viscoelastic material be-havior in the frequency domain. If only linear viscoelastic behavior occurs during loading, stress history
t can be predicted from strain history
t using the convolution in-tegral in Equation 1, which uses the linear viscoelastic ma-terial property known as the relaxation modulus (E t
).2.2.2. Viscoelastic Continuum Damage Model
A test typically used for obtaining damage properties in mechanistic characterization is the controlled crosshead direct tension-compression test. Neither the stress nor the bulk strain in the sample is controlled. Test is controlled by the actuator displacement. The procedure is described by
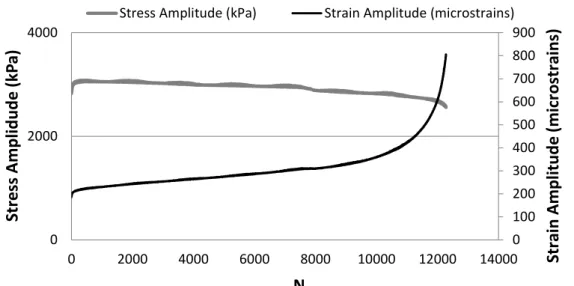
AASHTO TP 107 (2014). An illustrative example from Ba-badopulos (2014) is briefly presented here. Evolution of stress and strain amplitudes during a typical controlled crosshead test is presented in Figure 1. However, the versa-tility of the model allows the use of these tests to obtain the damage characteristic curve and also the failure criteria to estimate fatigue behavior of the tested material in various loading conditions. After obtaining the material damage curves, as described here, a simulation procedure using those properties and a given loading path is necessary to fi-nally conclude about the fatigue behavior of the material for that specific loading path.
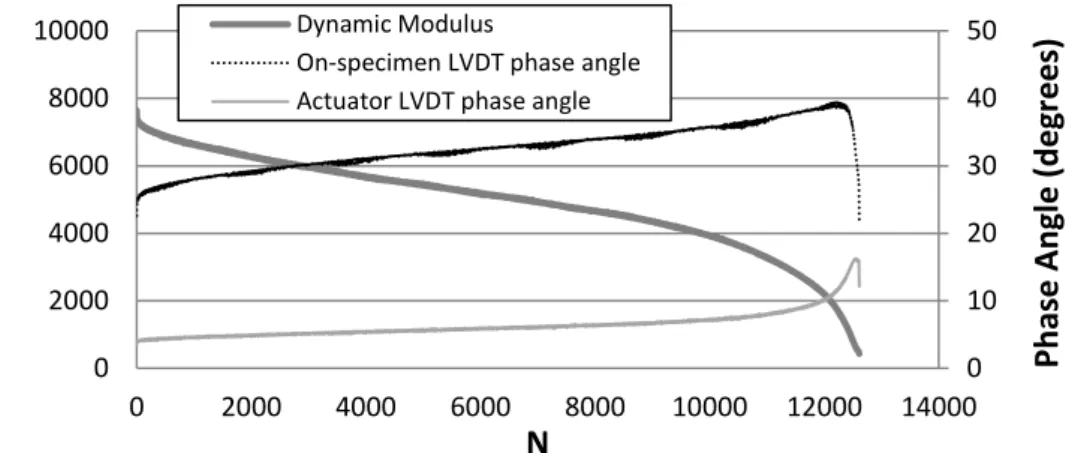
For the laboratory fatigue analysis, signal processing is required in order to obtain stress and strain amplitudes and phase lags during the tests. After signals of all loading cycles are processed, Figure 2 can be plotted. That figure presents the decrease in modulus and the increase in on-specimen LVDT (black dotted line) and in actuator LVDT (gray line) phase lags with respect to the force pulse during a controlled crosshead fatigue test. For the on-specimen LVDT displacement measurement, a mean of three LVDTs, positioned 120º apart in the axis of the cylindrical sample, is used. The number of cycles to failure can be defined from the phase angle drop associated with the measurements of the on-specimen LVDTs.
Using the results from the signal processing, the dam-age calculation routine can be executed. In order to analyze viscoelastic problems in a simpler way, Schapery (1984) proposed the elastic-viscoelastic correspondence principle, which allows the use of known classical solutions for elastic problems to produce solutions for the corresponding prob-lems in viscoelasticity. An easier way to interpret the re-ferred principle is represented by Equation 2.
Where R is called the pseudo strain and ER is the reference modulus, which is an arbitrary constant that has the same unit as the relaxation modulus E t
. Observe that, if the ER value is set to 1, the pseudo strain will have the same value as the linear viscoelastic stress, predicted from the convolution integral (Equation 1). So, in linear viscoe-lastic conditions, the pseudo secant modulus (ratio between
0 . t t E t u du u
; t0 (1)
0 1 . t R R E t u du E u
; t0 (2)Figure 1. Example of evolution of stress amplitude (in gray) and mean on-specimen strain amplitude (in black) during controlled crosshead tests 0 100 200 300 400 500 600 700 800 900 0 2000 4000 0 2000 4000 6000 8000 10000 12000 14000
Str
e
ss
A
m
p
lid
u
d
e
(kP
a)
N
Stress Amplitude (kPa) Strain Amplitude (microstrains)
Str
ai
n
A
m
p
litu
d
e
(m
icr
os
tr
ai
n
s)
and R, or / RC
) will be equal to 1. However, as internal microstructure changes (such as the evolving dam-age), the stress actually required for loading may decrease, so the pseudo secant modulus decreases. In other words, the slope of
vs R decreases.C is assumed to be only a function of the damage accumulation, i.e., CC S
. In addition, an evolution law for the damage accumulation must be chosen. Most researchers use the damage evolution law described in Equation 3 (Park et al., 1996).In Equation 3,
is a material dependent constant directly related to creep or relaxation material properties (i.e., its ability to relax stresses). If m denotes the maximum log-log derivative of the relaxation modulus of the material over all the time spectrum, the expression
1 1/ m (as first proposed by Park et al., 1996) is commonly used for dis-placement controlled tests, while
1/ m is more used for force controlled tests. The parameter
can be directly es-timated from the Prony series fitted to the experimental stiffness data. It is to be observed that the chosen expression (Equation 3) did not lead to a simple unit for the damage variable S (
stress
/ 1
time
1/1). A simple way to look at the damage accumulation variable is as a parameter that is used to "count" damage, so, S can be regarded as a "damage counting".There are two important experimental assumptions for the development of the S-VECD model. The first one is that C S
should be a unique function independent of the applied loading conditions (cyclic vs monotonic loading, amplitude/rate, frequency) and temperature (Daniel and Kim, 2002). The second one is that TTSP is still valid after damage accumulation (Chehab, 2002). Those considera-tions allow faster laboratory damage and fatigue character-ization of asphaltic materials, combined with the fact that cyclic tests can be used to obtain both the C vs S curves and the failure criteria. The tests are shorter because of the use of higher loading amplitudes, which lead to fatigue fail-ure more rapidly, consequently reducing laboratory time. In addition, time-temperature superposition coefficients do not need to be fit for each damage state. Together with those advantages, good agreement between prediction and test re-sults, and between prediction and real scale data (FHWA's Accelerated Loading Facility) have been presented in liter-ature (Underwood et al., 2009). Those reasons motivate theuse of this method for damage characterization of asphalt mixtures.
Underwood et al. (2012) provide the formulation of the S-VECD and exemplifies its use for fatigue modeling, while AASHTO TP 107 (2014) presents the details for the test procedures and calculation process, which ends up with the experimental characterization of the damage curve for a given material. Testing at different conditions allows veri-fying the agreement of the model with respect to the obser-vations (indicated by the collapse of multiple damage char-acteristic curves obtained at different conditions with dif-ferent samples).
Despite the fact that a complete presentation of the model is not an object of this paper, some definitions are necessary and therefore presented. When analyzing fatigue tests, sample-to-sample variation can produce fatigue test specimens with different dynamic modulus when compared to the samples tested to obtain this last property. That can be taken into account in the analysis of fatigue results by performing short dynamic modulus tests at the fatigue test frequency but using low force values (limiting strain to very low levels, around 40με), prior to the fatigue test. Such pro-cedure is called fingerprint test. Its results can be analyzed using the definition of dynamic modulus ratio (DMR), con-sisting in the ratio between the dynamic modulus of the sample tested for fatigue ( *
fingerprint
E ) and the mean dy-namic modulus for the tested mixture, predicted using the fitted Prony series parameters ( *
LVE
E ), i.e., in conditions of linear viscoelasticity. Using the definition of DMR, the material integrity, in a given loading cycle, can be calcu-lated from:
The subscript "pp" indicates that the quantity is taken from a peak to the following (actually, a valley) in the sig-nal. It is equivalent to the amplitude of that sigsig-nal. The peak-to-peak strain amplitude can be calculated considering the ratio between the mean LVDT displacement amplitude and the distance between the LVDT measurements (the gauge length, or GL). The peak-to-peak stress is equivalent to the force amplitude divided by the cross section circular area of the cylindrical sample. Finally, the peak-to-peak pseudostrain can be calculated by:
R dS W dt S (3) * . pp R pp C DMR
(4) * . R pp pp E LVE
(5)Figure 2. Example of |E*| and phase angle results in controlled crosshead fatigue tests 0 10 20 30 40 50 0 2000 4000 6000 8000 10000 0 2000 4000 6000 8000 10000 12000 14000
N
Dynamic ModulusOn-specimen LVDT phase angle Actuator LVDT phase angle
Pha
se A
n
gl
e
(deg
re
es)
Dy
n
am
ic
M
od
u
lu
s
(M
Pa
)
One of the considerations made in the S-VECD is that only tension induces damage. So, although all strain amplitude is used to calculate the material integrity, it can-not be used to calculate the value of the damage accumula-tion. In fact, only the tension amplitude pseudo strain could be used, therefore it needs to be calculated. In the cyclic tests analysis, this is considered in the calculations through the use of the parameter , known as the functional form factor. The value of the functional form parameter depends on the peak and on the valley values of the force signal at each cycle. It can be observed that, if the signal is centered in the time axis, i.e., the mean value of the force is zero, then 0. The resulting value for this parameter serves at estimating the tension amplitude pseudostrain ( R
ta
) from the peak-to-peak pseudostrain, as indicated in Equation 6.
If the signal is centered ( 0), the tension ampli-tude pseudostrain is equal to half of the peak-to-peak pseu-dostrain. If there is only tension in the test ( 1), then the tension amplitude pseudostrain is equal to the peak-to-peak pseudostrain. If there is only compression in the test ( 1), then the tension amplitude pseudostrain is equal to zero. This will serve to disregard the damage accumula-tion that would be calculated from compressive forces, as it is assumed not to exist. Another factor that is used to ac-count for the period where samples are being damaged, i.e., where tension force is applied, is the form adjustment fac-tor, K1. Using those parameters, which depend strictly on the loading, and the test results (stress and strain signals), the damage for the cyclic data can be calculated applying the assumed damage evolution law formula (Equation 3). It can be shown that Equation 7 represents its discretization form, where the subscript "k" represents the analyzed load-ing cycle.
After all described calculation, the evolution of C and S with time can be constructed. These curves are very influenced by the test conditions. However, if the observa-tions made by Daniel and Kim (2002) that C vs S is a ma-terial property, and those by Chehab (2002) that the TTSP applies for both undamaged and damaged states, eliminat-ing the time parameter should allow one to obtain a unique C vs S curve, i.e., the damage curves must col-lapse. Exponential or power models are commonly used to fit the damage characteristic curves. In this paper, a power law model was used (Equation 8).
In Equation 8, C11. and C12 are material constants to be determined for the power law model in order to fit test results. These parameters can be used to represent the ma-terial integrity evolution with respect to the damage accu-mulation. Final equations for estimating the number of cy-cles of failure of a material using its damage properties can be found elsewhere (Underwood et al., 2012).
3. MATERIALS AND METHODS
The asphalt mixture investigated in the present re-search is a dense asphalt concrete with 12.5mm nominal maximum aggregate size. The asphalt binder is classified by penetration as a 50/70. From its linear viscoelastic char-acterization following the Superpave performance grade system, it is classified as a PG 64-22. For the designed air void content (4.0%), the required asphalt binder content was 6.0% (by weight of the mix). The resulting maximum theo-retical specific gravity (Gmm) was 2.392. The referred
as-phalt mixture was initially selected for the research because it is commonly used in surface layers in the state of Ceará, Brazil (where the work was conducted), and also because this information was readily available (Coutinho, 2012; Oliveira 2014).
The materials tested for this paper were a reference mixture (RMix), and that very mixture subjected to an aging process, which has led to the production of a stiffer mixture (SMix). The aging process consisted of maintaining the loose mixture at 85ºC for 2 days in an oven prior to com-paction. The aging procedure was adapted from a RILEM protocol presented by Partl et al. (2012). More information about different asphalt mixture experimental aging proce-dures can be found in Oliveira (2014). The Gmm for SMix
was found to be 2.403. Sample compaction process con-ducted in the Superpave gyratory compactor (SGC) was set to stop at 150mm sample height. The obtained mean air voids for the tested mixtures were 4.3% for RMix and 4.5% for SMix.
3.1. State-of-the-Practice and State-of-the-Art Characterization
The ABNT NBR 16018 (2011) protocol was used to obtain the value of the RM for the two mixtures investi-gated. Two LVDTs placed in the horizontal diameter of Marshall (100mm diameter by 63.5mm height) specimens (perpendicular to the compression load application direc-tion) were used. Subsequently, controlled force indirect ten-sile fatigue tests using loads corresponding to 30, 40 and 50% of ITS were conducted. For each mixture, three sam-ples per stress amplitude were tested for fatigue using the controlled force indirect tensile test.
AASHTO T 342 (2011) was the test protocol adopted for asphalt mixture complex modulus (stiffness) character-ization. The results are typically shown in master curves for both *
E . and φ. Mean results were obtained from tests conducted for four Superpave samples of 100mm diameter by 150mm height, using three axial LVDTs mounted 120º apart on the surface of the sample, around its circumference. Fingerprint tests (short-time complex modulus tests, at small strain amplitudes) were conducted in order to select the load pulse to be used during the complex modulus tests. It was expected to reach strain amplitudes in the interval between 60 and 75με. At such strain levels, linearity condi-tions should be respected and negligible strain dependency (nonlinearity) should be observed. The master curves for both asphalt mixtures were obtained after horizontally shift-ing the isotherms, usshift-ing the Williams-Landel-Ferry (WLF) law. Controlled crosshead harmonic fatigue tests are con-ducted using nine asphalt mixture samples per tested asphalt mixture. The results are used to fit the S-VECD model. The
1 2 R R ta pp
(6)
2 * *
/ 1
1/ 1
1/ 1 k 1 1 Δ Δ K 2 R ta k k DMR S C C
(7)tests are conducted at different strain levels (around 200, 350 and 500με), using three samples for testing at each one of them. The target strain levels do not depend on the stiff-ness of the asphalt mixture. Before every fatigue test, a short-time tension-compression complex modulus test (fin-gerprint test previously mentioned) is conducted to capture sample-to-sample variation. LVDT geometry is exactly the same as in the complex modulus tests. Prior to testing, sam-ples are glued to top and bottom endplates. Figure 3 illus-trates the sample preparation (gluing of the endplates) pro-cess (a) and the mounted fatigue test as well as the samples to be tested, which are accommodated over a flexible mate-rial in order to minimize any stress in the sample before testing (b).
4. RESULTS AND DISCUSSION
4.1. Linear Viscoelastic Characterization
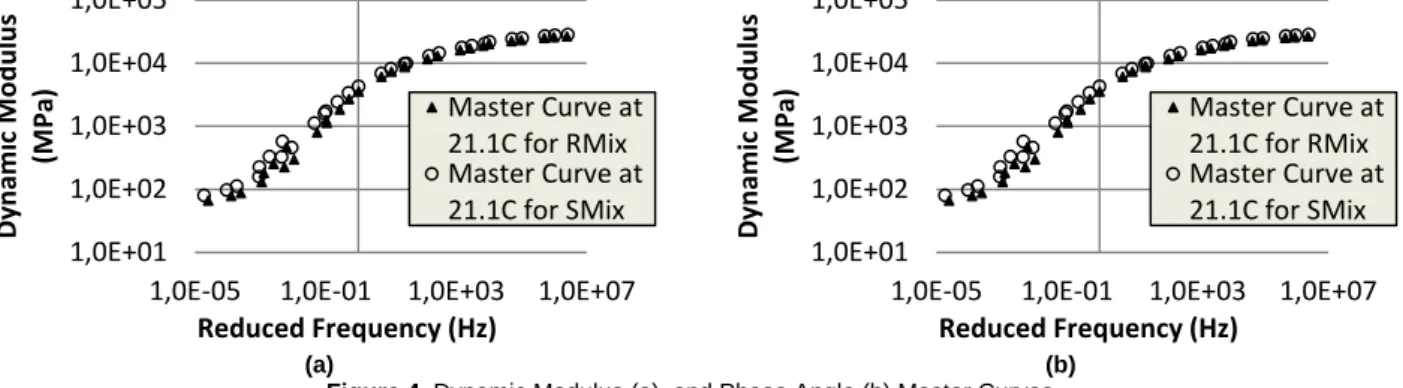
The stiffness characterization results are presented in master curves obtained using 21.1ºC as a reference temper-ature for both E* and φ, as indicated in Figures 4a and 4b. The master curves for both asphalt mixtures investi-gated were obtained after horizontally shifting the iso-therms, using the WLF law. It can be seen that E* for the SMix is slightly higher than for the RMix. Those asphalt mixtures differ only by their asphalt binder characteristics, the asphalt binder in SMix being stiffer as a result of the fabrication process previously described. The scatter of φ results may not present a clear trend for the phase angle as aging evolves, as seen in Figure 4b. However, there is an indication that the peak value of the phase angle occurred at lower reduced frequencies for SMix than for RMix, which is also a consequence of the aging procedure. The peak
phase angle seems to occur around 2.10-2Hz for RMix, and
around 9.10-3Hz for SMix.
4.1.1. Linear Viscoelasticity Modeling
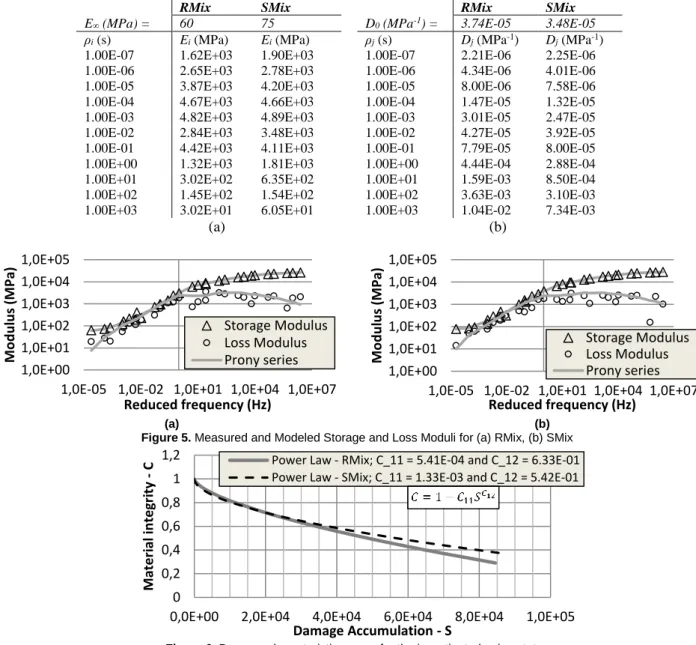
The discrete relaxation and retardation spectra ob-tained for the studied asphalt mixtures are summarized in Tables 1a and 1b. These parameters describe the linear vis-coelastic behavior of the asphalt mixtures and can be used to simulate any loading path that does not cause material nonlinearities, e.g., plasticity or damage. The models sum-marized in Table 1a presented a satisfactory fitting to the experimental data as seen in Figure 5. Those presented in Table 1b (Prony series for the creep compliance) were ob-tained by the interconversion procedure presented by Park and Schapery (1999). The good fitting was observed for both the storage modulus E (fitting input) and the loss modulus E (not the fitting input). This indicates that line-arity limits were respected during the laboratory tests. 4.2. Damage Characterization
In this section, direct tension-compression fatigue re-sults for RMix and SMix are described and compared. The S-VECD model is fitted to the results from the direct ten-sion-compression tests using a MatLab routine (Babadopu-los, 2014). Figure 6 presents the obtained damage charac-teristic curves, where the estimated values for the curve pa-rameters are presented in the legend. The fitted lines for each mixture tested were plotted until the respective mean value of the material integrity at failure was reached (values indicated in Table 2).
The values of the obtained material integrity at failure (Cf) and the damage accumulation at failure (Sf ) are pre-sented in Table 2. Estimates of their coefficient of variation (CV) are also provided.
(a) (b)
Figure 3. a) Illustration of the gluing process of the endplates to the asphalt mixture sample; b) Illustration of mounted fatigue test in UTM-25 and samples accommodated over a flexible material
(a) (b)
Figure 4. Dynamic Modulus (a), and Phase Angle (b) Master Curves 1,0E+01
1,0E+02 1,0E+03 1,0E+04 1,0E+05
1,0E-05 1,0E-01 1,0E+03 1,0E+07
D yn am ic M o d u lu s (M Pa) Reduced Frequency (Hz) Master Curve at 21.1C for RMix Master Curve at 21.1C for SMix 1,0E+01 1,0E+02 1,0E+03 1,0E+04 1,0E+05
1,0E-05 1,0E-01 1,0E+03 1,0E+07
D yn am ic M o d u lu s (M Pa) Reduced Frequency (Hz) Master Curve at 21.1C for RMix Master Curve at 21.1C for SMix
The first aspect to be observed is that RMix presents, with respect to SMix, very near C vs S curves for damage accumulation until arround 3×10⁴. It is to be remembered
that, due to the definition of the damage accumulation (Equation 3), its unit is
stress
/ 1
time
1/1 and has few physical meaning. The damage accumulation serves as a sort of "damage counting". After that point (S 3×10⁴),the damage characteristic curve for SMix presents higher values of material integrity (C) than RMix for the same values of damage accumulation (S). As the asphalt mix-tures present different stiffness and damage curves, higher values of material integrity for a given value of damage ac-cumulation do not mean more resistant materials. Babadop-ulos (2014) presents some constant on-specimen strain am-plitude fatigue simulations using aged and unaged mixtures in order to illustrate that using Whöler curves. Material in-tegrity at failure was also higher for SMix than for RMix. This means that the material in SMix failed for less evolved damaged conditions (with less damage tolerance), i.e., with lower loss in undamaged cross sectional area from the point of view of Lemaitre and Chaboche's (1990) damage varia-ble ( D , which can be easily obtained from material integ-rity as D 1 C). However, it is to be observed that high
CV in measures of material integrity at failure were ob-tained (21% for RMix and 38% for SMix).
Another important material characteristic for damage modeling is the parameter
, directly linked to the maxi-mum relaxation rate of the material, as presented in the lit-erature review. The average results for
were 2.933 for the RMix and 3.089 for the SMix. The damage parameter value is higher for SMix because the maximum absolute log-log derivative of the relaxation modulus was lower for SMix, i.e., the maximum relaxation rate of the material was lower. This was expected, because of the trend for stiffer and more elastic (lower phase angles) material after an ag-ing procedure. Although slight differences in the mean be-havior of the tested materials were observed, sufficient var-iation was obtained in order to observe that both asphalt mixtures behave actually similarly with respect to damage. Table 2. Mean and CV of material integrity and damage accumu-lation values at failureParameter / Mixture RMix SMix
Mean Cf 0.29 0.37
CV (%) 21 38
Mean Sf 100,897 100,387
CV (%) 21 42
(a) (b)
Figure 5. Measured and Modeled Storage and Loss Moduli for (a) RMix, (b) SMix 1,0E+00 1,0E+01 1,0E+02 1,0E+03 1,0E+04 1,0E+05
1,0E-05 1,0E-02 1,0E+01 1,0E+04 1,0E+07
M o d u lu s (M Pa) Reduced frequency (Hz) Storage Modulus Loss Modulus Prony series 1,0E+00 1,0E+01 1,0E+02 1,0E+03 1,0E+04 1,0E+05
1,0E-05 1,0E-02 1,0E+01 1,0E+04 1,0E+07
M o d u lu s (M Pa) Reduced frequency (Hz) Storage Modulus Loss Modulus Prony series Table 1. (a) Relaxation Spectra and (b) Retardation Spectra for the tested asphalt mixtures
RMix SMix
E∞ (MPa) = 60 75
ρi (s) Ei (MPa) Ei (MPa)
1.00E-07 1.62E+03 1.90E+03 1.00E-06 2.65E+03 2.78E+03 1.00E-05 3.87E+03 4.20E+03 1.00E-04 4.67E+03 4.66E+03 1.00E-03 4.82E+03 4.89E+03 1.00E-02 2.84E+03 3.48E+03 1.00E-01 4.42E+03 4.11E+03 1.00E+00 1.32E+03 1.81E+03 1.00E+01 3.02E+02 6.35E+02 1.00E+02 1.45E+02 1.54E+02 1.00E+03 3.02E+01 6.05E+01
RMix SMix
D0 (MPa-1) = 3.74E-05 3.48E-05
ρj (s) Dj (MPa-1) Dj (MPa-1) 1.00E-07 2.21E-06 2.25E-06 1.00E-06 4.34E-06 4.01E-06 1.00E-05 8.00E-06 7.58E-06 1.00E-04 1.47E-05 1.32E-05 1.00E-03 3.01E-05 2.47E-05 1.00E-02 4.27E-05 3.92E-05 1.00E-01 7.79E-05 8.00E-05 1.00E+00 4.44E-04 2.88E-04 1.00E+01 1.59E-03 8.50E-04 1.00E+02 3.63E-03 3.10E-03 1.00E+03 1.04E-02 7.34E-03
(a) (b)
Figure 6. Damage characteristic curves for the investigated aging states 0 0,2 0,4 0,6 0,8 1 1,2
0,0E+00 2,0E+04 4,0E+04 6,0E+04 8,0E+04 1,0E+05
M ate ri al in te gr ity -C Damage Accumulation - S
Power Law - RMix; C_11 = 5.41E-04 and C_12 = 6.33E-01 Power Law - SMix; C_11 = 1.33E-03 and C_12 = 5.42E-01
4.3. Conventional Characterization Results
Three asphalt mixture Marshall samples were tested for ITS and RM, while nine were tested for fatigue, all tests conducted were conducted at 25ºC. RM tests were per-formed using a 0.05MPa load, corresponding to approxi-mately 5% of the ITS of the asphalt mixtures. For the fa-tigue results, Whöler curves were constructed using
30, 40 and 50%
of the ITS. Average results for ITS were obtained as 1.21MPa for RMix and 1.04MPa for SMix. Results for RM were 3,570MPa for RMix and 3,789MPa for SMix (6% increase). Results present the ex-pected general trend of increase in RM after the aging pro-cess to produce SMix. The unexpected result was the ITS for SMix. As only three samples were tested, randomness may be an explanation for such results. It needs to be ob-served that conclusions drawn from them are only valid for the very specific observed loading conditions (25ºC, exactly the same loading configuration used in the tests). Due to the viscoelastic properties of asphalt mixtures, it is not possible to reliably use those observations to estimate behavior un-der different loading conditions. That constitutes a defi-ciency of this method with respect to more mechanistic methods. Figure 7 presents the Whöler curves for failure as obtained for the controlled force indirect tensile fatigue tests.
One could infer that the aged mixture (SMix) behave much better than the unaged mixture (RMix) (logNf for SMix approximately 0.8 greater than logNf for RMix). De-pending on the loading conditions, the number of cycles to failure for the aged mixture can be approximately (100.8 =
6.3) six times greater than the one found for the RMix. That kind of conclusion can be inducted by many factors, such as the use of controlled force mode test. As presented in the literature review, the only controlled stress value in this mode is the stress at the beginning of the test, i.e. in its first loading cycle (when none or very low damage has oc-curred). When damage occurs, after some loading cycles, the same force used in the beginning to produce a certain strain level leads to higher strain levels and higher effective stresses values, because the undamaged cross sectional area is lower after the damage, and consequently apparent stiff-ness is also decreased. This happens even faster as damage evolves, until the material fails. In other words, samples with different stiffness, tested at the same initial controlled stress, can actually face different solicitation in terms of stress and strain. For stiffer asphalt mixtures (as the aged asphalt mixture) and the same applied initial stress, lower values of initial strain amplitude are applied and the test tends to require more cycle repetitions to cause failure.
A second reason is that, when the material fails, it is not possible to separate the fatigue contribution from the part due to the creep flow accumulation. As the force is al-ways applied in the same direction, deformation accumu-lates, because the material is viscoelastic and flows. When high strains are accumulated, damage evolves. So, the num-ber of cycles to failure obtained from this test does not cor-respond to fatigue failure only. For the tested materials, the stiffer asphalt mixture may have behaved much better in the state-of-the-practice test because it flows less, which leads to less accumulation of creep strain, retarding failure in that test. The misinterpretation addressed here, which is led by the results from tests like the indirect tensile fatigue tests, was already observed in the literature (Di Benedetto and De La Roche, 1998).
From the presented results, it is possible to observe how controlled force indirect tensile fatigue tests may mis-lead to the conclusion that stiffer asphalt mixtures perform much better than less stiff asphalt mixtures. Such conclu-sion is not only temerarious when it comes to pavement analysis, but also it is not in agreement with the mechanistic based characterization results.
5. CONCLUSIONS AND RECOMMENDATIONS FOR FUTURE WORK
This paper addressed issues related to the state-of-the-practice asphalt mixture fatigue characterization method in Brazil using controlled force indirect tensile tests. A state-of-the-art method for damage characterization was used to obtain damage characteristics in order to inter-pret the fatigue phenomenon. Two asphalt mixtures with the same aggregate gradation, differing only by their stiffness were tested. When the stiffer asphalt mixture was evaluated in force controlled fatigue tests, the tests pointed to the con-clusion that it behaves, with respect to fatigue life, more than six times better than the reference asphalt mixture (for which no aging procedure was applied). On the other hand, as a more mechanistic procedure for characterization of damage behavior was adopted, less difference was observed between the asphalt mixtures. It is important to be observed, however, that the simulation using the material properties and a given loading path is a necessary step to make con-clusions about the behavior of that material for that loading path. One could use different values of strain level (in the range of those occurring in the asphalt mixture layer of an actual pavement) and use those values as input for fatigue simulation using the damage characteristic curve obtained for the material. An example of the aforementioned proce-dure is presented in Babadopulos (2014). In addition, it is Figure 7. Controlled force indirect tensile fatigue tests for RMix (in blue) and SMix (in red)
y = 8.43x-4.913 R² = 0.99 y = 50.49x-4.452 R² = 0.96 1,0E+01 1,0E+02 1,0E+03 1,0E+04 1,0E+05 0,1 1,0 Nf Δσ (MPa) RMix SMix
to be considered that asphalt mixtures presenting greater fa-tigue life (as commonly defined by simply the number of cycles to failure) under a certain loading path do not neces-sarily present greater fatigue life in a different loading con-dition.
It was concluded that two main issues might mislead the results from the asphalt mixture controlled force indirect tensile fatigue tests. The first one is the fact that the stress amplitude is controlled only in the first loading cycle and different materials are tested with different loading ampli-tudes. That makes it difficult to compare results for differ-ent asphalt mixtures. The second issue is the fact that in in-direct tensile tests, the in-direction of the load is always the same. The material flows in a creep like behavior during the test, leading to damage and contributing to failure. It is ac-tually not possible to separate fatigue damage from creep flow damage in indirect tensile fatigue tests. Finally, it is important to observe that the indirect tensile test induces a homogeneous stress and strain state, leading to a non-homogeneous damage evolution within the sample, which makes this test very difficult to interpret. This is also true for other fatigue tests. Thus, results from such tests can mis-lead the judgment of analysts and therefore produce false conclusions for fatigue simulations. It is necessary to pro-gressively change from the controlled force indirect tensile fatigue test towards a more mechanistic characterization procedure.
As a final remark, simulations of stress controlled ho-mogeneous tests (e.g. controlled stress uniaxial tension-compression tests) could be performed using the S-VECD material model and the characterization results obtained in this paper. The results could be compared with experi-mental observations for the indirect tensile tests, which are considered to be “stress controlled” tests. However, it is to be noticed that indirect tensile tests are inhomogeneous in stress and strain, while the referred S-VECD simulation is not. Such fact constitutes a first difficulty in interpreting eventual differences between model and simulation. An al-ternative method that could take into account the heteroge-neity of the indirect tensile test would be the use of the S-VECD model associated with a Finite Element analysis of the test. Modeling results could, then, be compared to the experimental results in a more rigorous way. In this paper, this is left as a recommendation for future work.
ACKNOWLEDGEMENTS
The authors acknowledge CNPq for funding the au-thors' respective scholarships. The authors are also thankful to Luis Alberto do Hermann Nascimento from Petrobras for his support of this research at LMP/UFC.
REFERENCES
AASHTO T 342 (2011) Standard method of test for determining
dynamic modulus of hot-mix asphalt concrete mixtures.
Ameri-can Association of State Highway and Transportation Officials, Washington, D.C.
AASHTO TP 107 (2014) Determining the damage characteristic
curve of asphalt concrete from direct tension cyclic fatigue tests.
American Association of State Highway and Transportation Offi-cials, Washington, D.C.
ABNT NBR 16018:2011 (2011) Misturas asfálticas –
Determi-nação da rigidez por compressão diametral sob carga repetida.
Associação Brasileira de Normas Técnicas. Rio de Janeiro. [In Portuguese].
Babadopulos, L. F. A. L. (2014) A contribution to couple aging
to hot mix asphalt (HMA) mechanical characterization under load-induced damage. M.Sc. Thesis, Programa de
Pós-Gradua-ção em Engenharia de Transportes, Centro de Tecnologia, Uni-versidade Federal do Ceará, Fortaleza, Brazil.
BabadopuloS, L. F. A. L.; Soares, J. B.; Castelo Branco, V. T. F.; Souza, F. V. (2013) Aplicação de análogos mecânicos para repre-sentar o comportamento viscoelástico linear de misturas asfálti-cas e interpretar sua influência no módulo de resiliência. In: XVII
Congresso Ibero-Latinoamericano del Asfalto, Guatemala. [In
Portuguese].
Chehab, G. R. (2002) Characterization of asphalt concrete in
tension using a viscoelastoplastic model. PhD Thesis, North
Car-olina State University, Raleigh, North CarCar-olina, USA. Coutinho, R. P. (2012) Utilização da parte fina de misturas
as-fálticas para avaliação do dano por fadiga. M.Sc. Thesis,
Pro-grama de Pós-Graduação em Engenharia de Transportes, Centro de Tecnologia, Universidade Federal do Ceará, Fortaleza, Brazil. [In Portuguese].
DanieL, J. S.; Kim, Y. R. (2002) Development of a simplified
fa-tigue test and analysis procedure using a viscoelastic, continuum damage model. J. Assn. Asphalt Paving Technologists, v. 71, p.
619-650.
Di Benedetto H.; De La Roche C. (1998) State of the art on stiff-ness modulus and fatigue of bituminous mixtures. Bituminous
binders and mixtures: state of the art and interlaboratory tests on
mechanical behavior and mix design. E. F. Spon, Ed. L. Franc-ken: p. 137-180.
DNER-ME 133 (1994) Misturas betuminosas – Determinação do módulo de resiliência. Departamento Nacional de Estradas de Rodagem. [In Portuguese].
Lemaitre, J.; Chaboche, J-L. (1990) Mechanics of solid
materi-als. Cambridge University Press. UK.
NCHRP 1-28A (2003) Recommended standard test method for determination of the resilient modulus of bituminous mixtures by indirect tension. National Cooperative Highway Research
Pro-gram (NCHRP).
Oliveira, A. H. (2014) Avaliação do potencial do líquido da
cas-tanha de caju (LCC) como retardante de envelhecimento para materiais asfálticos. M.Sc. Thesis, Programa de Pós-Graduação
em Engenharia de Transportes, Centro de Tecnologia, Universi-dade Federal do Ceará, Fortaleza, Brazil. [In Portuguese]. Park, S. W.; Kim, Y. R.; Schapery, R.A. (1996) Viscoelastic
con-tinuum damage model and its application to uniaxial behavior of asphalt concrete. Mechanics of Materials, .v.24, n.4, p. 241-255.
Park, S. W.; Schapery, R. A. (1999) Methods of interconversion between linear viscoelastic material functions. Part I – a numeri-cal method based on Prony series. International Journal of Solids
and Structures, 36, p. 1653–1675.
PartL, M. N.; Bahia, H. U.; Canestrari, F.; De La Roche, C.; Di Benedetto, H.; Piber, H.; Sybilski, D. (Eds.) (2012) Advances in
interlaboratory testing and evaluation of bituminous materials.
Report of the RILEM Technical Committee 206-ATB. DOI: 10.1007/978-94-007-5104-0
Ponte, R. S.; Castelo Branco, V. T. F.; Holanda, A. S.; Soares, J. B. (2014) Avaliação de diferentes metodologias para obtenção do Módulo de Resiliência de misturas asfálticas. Revista
Transpor-tes, v. 22, n. 2, p. 85-94. [In Portuguese]. DOI:
10.14295/trans-portes.v22i2.792
Schapery, R. A. (1984) Correspondence principles and a general-ized J integral for large deformation and fracture analysis of vis-coelastic media. International Journal of Fracture, v.25, n.3, p. 195-223. DOI: 10.1007/BF01140837
Soares, J. B.; Souza, F. V. (2003) Considerações sobre módulo resiliente e módulo dinâmico em misturas asfálticas com base na teoria da viscoelasticidade. XII Congresso
Ibero-Latinoameri-cano do Asfalto, Quito. [In Portuguese].
Underwood, B.S.; Y. Kim, Y. R.; SavadattI, S.; Thirunavuk-Karasu, S.; Guddati, M. (2009) Response and fatigue perfor-mance modeling of ALF pavements using 3-D finite element analysis and a simplified viscoelastic continuum damage model.
Asphalt Paving Technology, AAPT, v. 78, p. 829-868.
Underwood, B. S.; Baek, C.; Kim, Y. R. (2012) Simplified visco-elastic continuum damage model as platform for asphalt concrete fatigue analysis. Transportation Research Record: Journal of the
Transportation Research Board, 2296(-1), 36-45. DOI: