Formability Evaluation of Two Austenitic Stainless Steels
J. of the Braz. Soc. of Mech. Sci. & Eng. Copyright © 2004 by ABCM January-March 2004, Vol. XXVI, No. 1 /47
M. S. Andrade,
O. A. Gomes and
J. M. C. Vilela
Fundação Centro Tecnológico de Minas Gerais CETEC Av. José Cândido da Silveira, 2000 31170-000 Belo Horizonte, MG. Brazil. CEP [email protected]A. T. L. Serrano and
J. M. D. de Moraes
ACESITA S.A. Associada à Arcelor Praça Primeiro de Maio, 9 35180-000 Timóteo, MG. Brazil [email protected]Formability Evaluation of Two
Austenitic Stainless Steels
In this work, a comparative study was performed with two austenitic stainless steels: one of the standard type AISI 304 (18% Cr / 8% Ni / 1,3% Mn / 0,07% Cu / 0,033% N, in weight) and other where nickel was partially replaced by manganese, nitrogen and copper (16,3% Cr / 1,5% Ni / 7,4% Mn / 2,9% Cu / 0,184% N, in weight). The aim was to reduce the cost of the final product preserving its good formability and corrosion resistance properties. In order to determine the degree of stability of the austenite, isothermal tensile tests were performed on samples of the two steels in the range of temperature from -25 to 70 ºC. The amount of α' martensite formed was measured with a ferrite detector. Microhardness tests showed that the hardness of both steels increase with the amount of induced martensite. Microstructural characterization of the deformed samples was performed by Optical Microscopy and Atomic Force Microscopy. The mechanical properties were studied by tension and formability tests (Erichsen and Swift). It was verified that the AISI 304 steel presents better formability (stretch formability) than the steel with partial substitution of Ni by Mn, Cu and N.
Keywords: Formability, stainless steel, martensitic transformation
Introduction
The Brazilian stainless steel industry expects to export 150 thousand tons of this material during 2003. This amount represents an increase of 65% compared to 2001 and of 300% compared to 2000. As for the internal market, the industry makes efforts to increase the per capita consumption from 1.0 to 1.4 kg. In order to reach these ambitious goals, new and better types of steels are being developed and tested, mainly with respect to their formability performances. Cost is also a very important aspect for some applications. The use of stainless steels in the food and pharmaceutical industries leads to quality gains and competitive prices. Equipments made of these materials are indicated for many applications in the chemical industry, since they show high corrosion resistance and very smooth surfaces, avoiding accumulation of impurities and optimizing cleaning procedures. Fermentation and storage containers made of other materials, such as plastics or carbon steels, can originate contamination focuses increasing the risk of bacteria development. (Acesita, 2002)
Stainless steels products are offered in the market in portfolios including more than 12 thousand items such as sinks and wash basins, utensils, pans and cutlery. In automotive applications, exhaust systems with three years guarantee, joints and other pieces produced with stainless steels represent lower prices and higher safety to the consumer.1
Most of these applications require good performance during fabrication steps, mainly at the forming process. It is known that the induction of martensite during plastic deformation of the metastable austenite (γ) is very important to attain austenitic steels of high formability, that is, with high mechanical resistance and high ductility. A considerable increase of the mechanical resistance is attained when these steels are deformed at temperatures under Md, the temperature below which the formation of stress induced α’ martensite occurs. This increase of the material plasticity caused by martensite formation is known as TRIP effect – Transformation Induced Plasticity – (Rintamaa et al., 1982, Choi et al., 1997). The
Presented at COBEF 2003 – II Brazilian Manufacturing Congress, 18-21 May 2003, Uberlândia, MG. Brazil.
Paper accepted October, 2003. Technical Editor: Alisson Rocha Machado
transformation of the austenite (face centered cubic, paramagnetic phase) to ε martensite (hexagonal compact, paramagnetic phase) or to α’ martensite (body centered tetragonal, ferromagnetic phase) depends on the chemical composition of the alloy, on the temperature and on the amount of deformation. The stability of the austenite in relation to these phases is usually evaluated by the Md30 parameter, that is the temperature at which 50% of α’ martensite is obtained in a tension test for a true deformation of 0.3 (Angel, 1954).
This work focuses on the comparison of the chemical composition and the microstructure with the formability performance. Two types of austenitic stainless steels have been studied. The first one was a commercial AISI 304 type and the other one was an experimental steel where part of Ni was replaced by Mn, N and Cu.
Nomenclature
dL = increment of the dilatometric length variation, micron eu = uniform elongation, dimensionless
IE = Erichsen Index, millimeters
LDR = Limit Drawing Ratio, dimensionless
Md = the temperature below which the formation of stress induced α’ martensite occurs, Kelvin
Md30 = temperature at which 50% of α’ martensite is obtained in a tension test for a true deformation of 0.3, Kelvin T = temperature, Celsius degrees
Greek Symbols
α’ = body centered tetragonal martensite γ = austenite
ε = hexagonal compact martensite σe = yield strength, MPa
σR = tensile strength, MPa
Experimental Procedure
M. S. Andrade et al
/ Vol. XXVI, No. 1, January-March 2004
ABCM
48
continuous ingot casting followed by hot and cold rolling with intermediate annealing.
Table 1. Chemical composition of the studied steels (% in weight).
Steel C Si Mn Cr Ni Mo Cu N
A 0,060 0,39 1,31 18,09 8,03 0,040 0,07 0,0330 B 0,046 0,72 7,44 16,13 1,51 0,012 2,92 0,1836
Test specimens of 180 mm x 25 mm were cut from these sheets and isothermally deformed in tension at a strain rate of 3,4 × 10 -3
s1, in the temperature range from -25 oC to 70 oC, in an Instron testing machine equipped with a controlled temperature chamber. The amount of deformation induced α’ martensite was determined by magnetic measurements, using a ferrite detector. The calibration of the ferrite detector was performed by comparative measurements made in a magnetic saturation balance (Choi et al., 1997). The magnetic measurements were performed with the ferrite detector at different positions of the tension test specimens, in order to verify the homogeneity of formation of α’ martensite along the specimens.
In order to analyze the microstructure of the deformed specimens, longitudinal cross sections of approximately 10 mm length cut from the test specimens were mounted with epoxy resin, ground and polished using diamond pastes of 6 µm, 3 µm and 1 µm. The samples were then electrolytically polished in a solution of percloric acid with methanol (1:3). Eventually, they were chemically etched with Beraha II (Vander Voort, 1989). Specimens were observed by optical and atomic force microscopy (AFM). AFM images were acquired with a Dimension 3000 from Digital Instruments, operating in contact mode.
Vickers microhardness tests, using a force of 4.903 N (HV 0.5), were performed in deformed samples using a Leitz Durimet 2 equipment. Samples cut from tensile test specimens in the tension axis direction were used for dilatometry tests, performed in an Adamel Lhomargy LK02 equipment, in the temperature range from 25 oC to 1000 oC, with a heating rate of 1 oC/s.
Formability tests were performed in an Erichsen hydraulic press, using molybdenum bisulfate as lubricant. The Erichsen index (IE) was determined according to DIN 50101 standards and the Limit Drawing Ratio (LDR) was determined according to internal procedures of ACESITA.
Results and Discussion
The volumetric fraction of α’ martensite, obtained with the ferrite detector, as a function of the deformation temperature for the two steels, deformed to 0.3, are shown in Fig. 1. It can be clearly observed that steel A shows more α’ martensite then steel B, at any deformation temperature. The value of 50% α’ martensite could not be achieved for steel B until the temperature of –21 oC. It can be estimated that Md30 for this steel would be around –30 oC. This steel does not show any α’ martensite when tensile strained to 0.3 above room temperature. Consequently, the TRIP effect is not expected to be present at this steel, when deformed above room temperature.
The value of Md30 for steel A was 12 oC. Comparing the Md30 values for the two evaluated materials, it can be seen that steel B is more stable in relation to martensitic transformation then steel AISI 304 type (steel A).
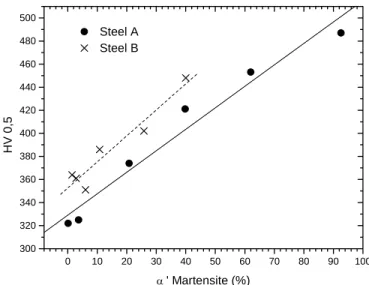
Values of the Vickers microhardness obtained at the same samples are shown in Figure 2. Both steels show a linear dependence of the microhardness with the amount of α’ martensite
induced in tensile tests. Steel B is harder then A. This is possibly related to the higher nitrogen content present in this steel (Pecker et. al., 1977). The same effect could also be observed in steels with no deformation. Steel A showed a value of 193 HV 0.5 while steel B showed 206 HV 0.5.
-30 -20 -10 0 10 20 30 40 50 60 70 0
20 40 60 80 100
Steel A Steel B
α
' M
a
rtensite
(%)
Deformation Temperature (oC)
Figure 1. Volumetric fraction of α’ martensite as a function of the deformation temperature for steels A and B tensile strained to 0.3.
0 10 20 30 40 50 60 70 80 90 100 300
320 340 360 380 400 420 440 460 480 500
Steel A Steel B
HV
0
,5
α ' Martensite (%)
Figure 2. Vickers microhardness as a function of α’ martensite content for the two studied steels.
Formability Evaluation of Two Austenitic Stainless Steels
J. of the Braz. Soc. of Mech. Sci. & Eng. Copyright © 2004 by ABCM January-March 2004, Vol. XXVI, No. 1 /49 -10 oC Steel A 15 oC
-10 oC Steel B 15 oC
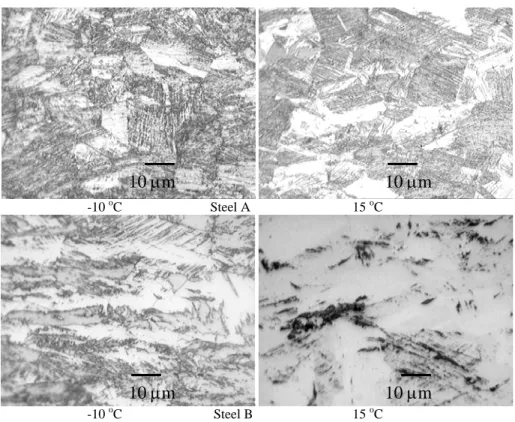
Figure 3. Microstructures of steels deformed to 0.3 at temperatures of 15 oC and –10 oC. Optical microscopy.
-10 oC Steel A 15 oC
-10 oC Steel B 15 oC
Figure 4. Microstructures of steels deformed to 0.3 at temperatures of 15 o
C and –10 o
C. Atomic force microscopy.
10
µ
m
5
µ
m
5
µ
m
5
µ
m
5
µ
m
10
µ
m
10
µ
m
M. S. Andrade et al
/ Vol. XXVI, No. 1, January-March 2004
ABCM
50
Results of dilatometry tests performed in deformed samples are presented in Fig. 5. The transformation observed between 100 oC and 300 oC is the reversion of ε martensite, formed in small quantities. The transformation observed between 500 oC and 700 oC is the α’→γ transformation (Gonzalez et al., 2003). This transformation is more evident in steel A indicating, in a semi quantitative way, larger amounts of α’ martensite in this steel. These results are in agreement with others presented in Fig. 1 and those obtained by optical microscopy and AFM presented in Fig. 3 and Fig. 4, respectively.
Table 2 shows results from tensile and formability tests. Steel A presents better stretch properties, uniform elongation (eu) and Erichsen Index (IE) then steel B. The yield strength (σe) of steel B is higher then that of steel A, probably due to the higher contents of nitrogen and manganese in steel B. For both steels the grain size is ASTM 8.
Table 2. Results from tensile and formability tests for steels A and B.
Steel σe (MPa) σR (MPa) eu (%) IE (mm) LDR (-)
A 276±1 770±8 57±3 11,76 2,04
B 393±5 751±4 48±5 11,03 2,12
-0,6 -0,4 -0,2 0,0 0,2
0,4 0 200 400 600 800 1000
-10oC
Steel A Steel B
dL/
dT
(um
/
o C)
Temperature (oC)
0 200 400 600 800 1000
0,00 0,05 0,10 0,15 0,20 0,25 0,30
15oC
Figure 5. Temperature differential of the length change during heating specimens of steels A and B strained to 0.3 at –10 and 15o
C.
Differences between the Erichsen Index values can be explained by the differences in α’ martensite contents when the materials are submitted to stress and strains of tensile nature (biaxial tension). According to Gonzalez et al. (2003), when the martensitic transformation occurs in optimized quantities, larger uniform elongations are attained. In other words, the better the optimized rates of α’ martensite formation the better will be the performance of the material when submitted to biaxial tension. As shown by the curves in Fig. 1 and by the images in Fig. 3 and Fig. 4, for the same quantity of deformation (0.3), the martensitic transformation for steel B is smaller. In this case, one can assume that the rate of
α’martensite formation is not optimized, explaining its poorer performance in the tensile tests.
On the other hand, comparing the results for these two steels in relation to LDR, the opposite situation is observed. Steel B has a better deep drawing performance than steel A. During deep drawing, small deformations occur at the flange region, while large deformations take place in the regions close to the die radius. For small deformations, a relatively high α’ martensite formation occurs at the flange region, inhibiting the formation of this phase at the region of the die radius. This effect decreases the deep drawing performance as observed in steel A. In more stable steels, with lower Md30, as is the case of steel B, martensitic transformation does not occur at small deformations, that is, α’ will not form at the flange region and thus improving the deep drawing ability of the material.
Conclusions
Steel A has improved stretching properties compared to steel B, while steel B shows better performance in the deep drawing. These behaviors can be explained by the formation of α’ martensite. Steel A shows a larger amount of deformation induced α’ martensite than steel B. Vickers microhardness results showed that microhardness of the steels is proportional to the amount of deformation induced α’ martensite.
Acknolegements
O.A.G. thanks RHAE/CNPq for a scholarship. The authors are thankful to FINEP for financial support, to the researchers Tácito B. Pinto and Nilton J. L. Oliveira for helpful discussions, to Rondinelle L. S. Dores and Rafael A. Souza for sample preparations and to the Metallurgy Department of the Federal University of Minas Gerais for the tensile tests.
References
Acesita, 2002, “Espaço Acesita: Publicação para Clientes, Investidores, Empregados e Comunidade”, Ano II, No 10.
Angel, T., 1954, “Formation of Martensite in Austenitic Stainless Steels”, Journal of the Iron and Steel Institute, p. 165-174.
Choi, J.Y., Jin, W., 1997, “Strain Induced Martensite Formation and Its Effect on Strain Hardening Behavior in the Cold Drawn 304 Austenitic Stainless Steels”, Scripta Materialia, 36, 1, p. 99-104.
Gonzalez, B.M., Castro, C.S.B., Buono, V.T.L., Vilela, J.M.C., Andrade, M.S., Moraes, J.M.D., Mantel, M.J., 2003, “The Influence of Copper Addition on the Formability of AISI 304 Stainless Steel”, Materials Science and Engineering, 343, 1-2, p. 51-56.
Peckner, D., Bernstein, I.M., 1977, “Handbook of Stainless Steels”, MacGraw-Hill, p. 20-1 – 20-39.
Rintamaa, R., Sulonen M., 1982, “The Effect of Strain Induced Martensite on the Strength and Formability of Metastable Austenite Stainless Steel Sheets”, Proceedings of the 12th Bienal Congress International Deep Drawing Research Group, Associazone Italiana de Metallurgia, p. 119-130.