Thermal record of the test
tubes method used for
small ibers assessment
Denny D. Collina, Manoel F. Villarroel, Carlos Julio Tierra-Criollo
ABSTRACT
In Brazil, the test that uses test tubes filled with cold water (25ºC) and tubes filled with water heated to a temperature of 45ºC is recommended by the Ministry of Health as a way of evaluate thermal sensitivity on the injured skin of leprosy patients. The purpose of this work was to quantify the thermal stimulation applied to the skin, as well as the temperature variation of the heated water and of the tube’s outer surface during stimulation sessions. The experiment had the participation of 14 healthy volunteers (31.2±11.4 years-old), ten of which were male (33.1±13.5 years-old) and four were female (26.5±4.7 years-old). Three consecutive stimulation sessions were carried out, each of them with four stimuli. The maximum skin temperature at the end of the stimuli was measured at 35.8±0.6ºC. Such temperature values may be useful in the assessment of the loss of small fibers, which are responsible for the sensation of warmth.
Key words: leprosy, thermal sensation, thermal sensory testing.
Registro térmico do método dos tubos de ensaio aplicado na avaliação de fibras finas
RESUMO
No Brasil, o teste que utiliza tubos de ensaio preenchidos com água aquecida (45ºC) e resfriada (25ºC) é preconizado pelo Ministério da Saúde como forma de avaliar a sensibilidade térmica nas lesões de pele de pacientes com hanseníase. O objetivo deste trabalho foi quantificar o estímulo térmico na pele e a variação das temperaturas da água aquecida e da superfície externa do tubo, durante as sessões de estimulação. O experimento contou com 14 voluntários saudáveis (31,2±11,4 anos), sendo dez do gênero masculino (33,1±13,5 anos) e quatro do gênero feminino (26,5±4,7 anos). Realizaram-se três sessões seguidas de estimulação com quatro estímulos em cada sessão. A temperatura registrada na pele, ao final dos estímulos, apresentou diferenças entre as sessões, atingindo o máximo de 35,8±0,6ºC. Estes valores de temperatura podem ser úteis na avaliação da perda de fibras finas responsáveis pela sensação de aquecimento. Palavras-Chave: hanseníase, sensibilidade térmica, teste de sensibilidade térmica.
Correspondence Carlos Julio Tierra-Criollo
Laboratório de Engenharia Biomédica Programa de Pós-Graduação em Engenharia Elétrica
Universidade Federal de Minas Gerais Av. Antônio Carlos 6627
31270-901 Belo Horizonte MG - Brasil E-mail: [email protected]
Support
FAPEMIG, CAPES, CNPq e CEFET-MG
Received 22 December 2010 Received in final form 26 July 2011 Accepted 02 August 2011
Núcleo de Estudos e Pesquisa e Engenharia Biomédica (NEPEB), Programa de Pós-Graduação em Engenharia Elétrica (PPGEE), Universidade Federal de Minas Gerais (UFMG), Belo Horizonte MG, Brazil; Doutorando do PPGEE, UFMG e Professor CEFET-MG.
The research on thermal sensitivity is performed, many times, by using test tubes illed with heated and cold water1.
In Brazil, such test is recommended by the Ministry of Health2-4 for the
evalua-tion of thermal sensitivity and, therefore, of small ibers present in the skin of lep-rosy patients. The test consists in using two test tubes filled with water, both of them with the temperature well deined,
one containing water at 25°C5 and the
other containing water heated to the tem-perature of 45°C. Such temtem-perature, ac-cording to the Ministry’s manual2-4, must
between hot and cold tubes. he patient, then, must iden-tify whether the tube is cold or hot.
Despite the recommendation for a fixed-tempera-ture test, some factors seem to contradict that assump-tion. One of them is the heat exchange between the water and the environment (through convection and radiation), or between the water and the examiner’s or tested in-dividual’s skin (conduction), which leads either to the heating of the cold water or to the cooling of the heated water, since bodies kept at diferent temperatures tend to reach thermal equilibrium6,7. Another factor is the
tem-perature difference between the tube’s outer surface and the water that it contains, caused by the glass’ low thermal conductivity6.
For this work, only water at 45°C was used. he main purpose was to quantify the thermal stimulation applied to the skin, in a controlled environment and using the same method, as well as the temperature variation for the water and for the tube’s outer surface in stimulation ses-sions of healthy individuals.
METHOD
he experiment had the participation of 14 healthy volunteers with the age of 31.2±11.4 (mean±S.D.) years-old, ten of which were male (33.1±13.5 years-old) and four were female (26.5±4.7 years-old). he study was ap-proved by the local Ethics Committee, and all volunteers signed a “free and clariied” consent term.
he experiment’s main purpose was to quantify the thermal stimulation applied to the skin, thus only heated water was used, considering that the heat transfer module between two bodies depends only on the temperature diference and on the physical properties of the bodies involved. Also, heat always lows from the hotter to the colder body6. he use of cold water is, therefore,
unneces-sary, because a similar result would be produced. hree consecutive stimulation sessions were carried out on each volunteer, all performed by the same indi-vidual, in a silent environment, and room temperature adjusted to 26±1°C. he stimulation time was two sec-onds (S2) for the irst session, as recommended by the Brazilian Ministry of Health. A second session (S5, du-ration of ive seconds), as well as a third one (S10, dura-tion of ten seconds), were included in this study with the purpose of assessing how the three temperatures (water, tube’s outer surface and skin) vary as stimulation time in-creases. Four stimuli were used per session, with a ixed ive seconds interval between each stimulus. he interval between each session was of ive minutes.
A common glass test tube, 180 mm long, internal di-ameter of 13.2 mm, wall thickness of 1.0 mm and capacity of 24 mL was used for the stimuli (Fig 1). For each ses-sion it was illed with 15 mL of water, heated to a
tem-perature of 70°C, and held by the examiner near the open extremity between the irst and second ingers. he tube was manually and constantly agitated while the water temperature was monitored. The test began when the temperature reached 45±0.5°C. he temperatures were recorded for ten seconds, prior to the irst stimulus, with the purpose of measuring the skin’s initial temperature.
Temperature measurements were performed with the use of three NTC thermistor-type sensors (Can-therm - MF51E103E3950, 10KΩ±0.5%). One (Can-thermistor was placed inside the test tube (Fig 1) for water tempera-ture measurement (water sensor - WS). It was positioned and kept at the tube’s center, with the use of a rigid wire spiral. Vertically, the sensor was positioned 2 cm away from the tube’s lower extremity. he second sensor was placed along the tube’s outer wall (external sensor - ES) and aligned with the water sensor. Finally, the third sensor was irmly placed, with adhesive tape, on the volunteer’s skin (skin sensor - SS), at the 1/3 proximal, anteromedial part of the right forearm. A thin layer of thermal com-pound was used (Implastec - IPT300) to increase heat transfer of the second and third heat sensors and their respective measurement points.
he signals from the three sensors were iltered using a lower-pass of 5 Hz. Digitalization was performed at a rate of 50 samples per second by using a USB-6211 board (16 bits) and LabView® virtual instrumentation software, both produced by National Instruments® (USA). A vir-tual instrument was especially constructed, which: shows real-time temperature curves of the three sensors; allows control of data saving to a computer’s hard drive and gen-erates sound signals (beeps) for stimulation cadence.
Prior to the beginning of the test, the volunteers were instructed to assess the sensation and to answer the fol-lowing questions: [A] at the end of each session, whether the 4 stimuli had a similar or diferent intensity, and, if diferent, which one was the most intense; [B] at the end of the experiment, what was the diference in the percep-tion of the stimuli between the three sessions.
RESULTS
In Fig 2, charts are presented with the average tem-peratures for each of the three sensors, as well as the beep signal for each session.
Water temperature
S2, as expected (Table 1). However, in the time interval comprised between the irst and the last stimulus (t1 to t8), the water temperature variation was measured at –0.6±0.11°C during session S2, –0.9±0.14°C during ses-sion S5, and –1.5±0.25°C during sesses-sion S10.
Tube’s outer wall temperature
At the beginning of the stimuli (instant t1), it was noted that the temperature of the tube’s outer wall was of 41.3±0.69°C. Such temperature was always lower (–4.3±0.6°C) than the water’s (Fig 2). In addition, when the temperatures at the initial instant (t1) and at the inal instant of each stimulus (ΔTemp = Tempend – Tempt1)
were compared, there was a noticeable decrease in the initial temperatures and increase in the inal tempera-tures for sessions S5 and S10. For session S2, however, there was a decrease in the initial and inal values. Such types of behavior produced a decreasing pattern for tem-perature variation (Table 2).
The magnitude of the tube’s temperature varia-tion during the first stimulus (|Amplitude=Tempt2 –
Tempt1|) was signiicant, and considerably larger than
that of the subsequent stimuli. hat magnitude, as
ex-Table 1. Water temperature measurement.
Water sensor
Stimulus 1 (ºC) Stimulus 2 (ºC) Stimulus 3 (ºC) Stimulus 4 (ºC) Begin (t1) End (t2) Begin (t3) End (t4) Begin (t5) End (t6) Begin (t7) End (t8)
S2 Mean±S.D. 45.6±0.29 45.5±0.27 45.4±0.28 45.4±0.28 45.2±0.27 45.2±0.27 45.0±0.27 45.0±0.26
Amplitute = Tempend – Tempbegin 0.0±0.05 –0.1±0.01 –0.1±0.02 0.0±0.02
∆Temp = Tempend – Tempt1 0.0±0.05 –0.2±0.04 –0.4±0.08 –0.6±0.11
S5 Mean±S.D. 45.6±0.27 45.5±0.29 45.3±0.29 45.2±0.30 45.1±0.31 44.9±0.32 44.8±0.32 44.6±0.33
Amplitute = Tempend – Tempbegin –0.1±0.03 –0.1±0.03 –0.1±0.03 –0.1±0.02
∆Temp = Tempend – Tempt1 –0.1±0.03 –0.4±0.06 –0.7±0.10 –0.9±0.14
S10 Mean±S.D. 45.5±0.22 45.2±0.23 45.1±0.25 44.8±0.29 44.6±0.31 44.4±0.35 44.2±0.37 44.0±0.39
Amplitute = Tempend – Tempbegin –0.3±0.06 –0.3±0.00 –0.3±0.06 –0.2±0.04
∆Temp = Tempend – Tempt1 –0.3±0.06 –0.7±0.14 –1.1±0.20 –1.5±0.25
S2: session two seconds; S5: session ive seconds; S10: session ten seconds.
Fig 1. Temperature sensors [A] their identiication and [B] their positioning for stimulation. WS: water sensor; ES: external sensor; SS: skin sensor.
Fig 2. Temperature curves (average and standard deviation) for session: [A] S2; [B] S5 and [C] S10. WS: water sensor; ES: external sensor; SS: skin sensor; Beeps: stimulus starting at (t1, t3, t5, t7) and ending at (t2, t4, t6, t8) respectively.
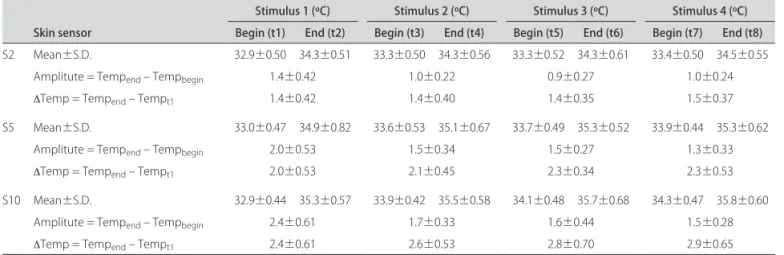
Skin temperature
At the beginning of the stimuli (t1), it was noted that the skin’s temperature was of 32.9±0.46°C, i.e., much lower (–12.6±0.61°C) than the water’s (Fig 2). he highest temperature of the skin reached 35.8±0.60°C, at the end of session S10.
The magnitude of the skin’s temperature variation during the irst stimulus, as in the case of the tube’s tem-perature, was considerably larger than that of the sub-sequent stimuli (Table 3). For session S2, the magnitude was measured at 1.4±0.42°C in the first stimulus and 1.0±0.22°C in the second one. For session S5, the mag-nitude decreased from 2.0±0.53°C to 1.5±0.34°C and, for session S10, from 2.4±0.61°C to 1.7±0.33°C. In the sub-sequent stimuli, the diference between the magnitudes did not exceed 0.2°C for each session.
he temperature’s behavior presented an increasing pattern, i. e., during the intervals between the stimuli (t2-t3, t4-t5 and t6-t7) the skin’s temperature did not return to its initial (basal) value. herefore, the skin’s
tempera-ture at the second stimulus’ initial instant (t3) is higher than that of the irst stimulus (t1) and so forth. Table 3 shows that the second stimulus presented a temperature increase of 0.4±0.18°C for session S2, 0.6±0.18°C for ses-sion S5 and 1.0±0.32°C for sesses-sion S10.
DISCUSSION
he skin’s thermoreceptors respond to temperature variations of the basal value (which, according to dif-ferent authors, ranges from 32 to 35°C8-11). Such
recep-tors show a higher response on the face of quick temper-ature variations, but also respond, with lower intensity, to constant or slow-varying temperatures. The recep-tors responsible for heat sensations respond almost pro-portionally to the skin’s temperature increase over 29°C, reaching a peak of activity when the temperature reaches 45°C, and then decreasing as the temperature approaches 49°C9,10. According to the Brazilian Ministry of Health,
the water temperature must not exceed 45°C in heat sen-sitivity tests, because a sensation of heat pain may be
pro-Table 2. Tube outer temperature measurements.
External sensor
Stimulus 1 (ºC) Stimulus 2 (ºC) Stimulus 3 (ºC) Stimulus 4 (ºC) Begin (t1) End (t2) Begin (t3) End (t4) Begin (t5) End (t6) Begin (t7) End (t8)
S2 Mean±S.D. 41.3±0.70 38.2±0.91 40.1±0.66 37.8±0.58 39.9±0.62 37.8±0.56 39.7±0.57 37.6±0.57
Amplitute = Tempend – Tempbegin –3.1±0.68 –2.3±0.34 –2.1±0.38 –2.1±0.35
∆Temp = Tempend – Tempt1 –3.1±0.68 –3.5±0.72 –3.5±0.74 –3.6±0.70
S5 Mean±S.D. 41.4±0.74 37.0±0.28 39.7±0.48 37.1±0.30 39.4±0.59 37.1±0.35 39.1±0.59 37.2±0.35
Amplitute = Tempend – Tempbegin –4.4±0.85 –2.6±0.63 –2.3±0.68 –1.9±0.55
∆Temp = Tempend – Tempt1 –4.4±0.85 –4.3±0.86 –4.3±0.86 –4.2±0.73
S10 Mean±S.D. 41.2±0.65 37.0±0.60 39.3±0.69 37.4±0.56 39.1±0.68 37.5±0.49 39.0±0.61 37.4±0.45
Amplitute = Tempend – Tempbegin –4.2±0.79 –1.9±0.61 –1.6±0.64 –1.6±0.61
∆Temp = Tempend – Tempt1 –4.2±0.79 –3.8±0.78 –3.6±0.69 –3.7±0.50
S2: session two seconds; S5: session ive seconds; S10: session ten seconds.
Table 3. Skin temperature measurements.
Skin sensor
Stimulus 1 (ºC) Stimulus 2 (ºC) Stimulus 3 (ºC) Stimulus 4 (ºC) Begin (t1) End (t2) Begin (t3) End (t4) Begin (t5) End (t6) Begin (t7) End (t8)
S2 Mean±S.D. 32.9±0.50 34.3±0.51 33.3±0.50 34.3±0.56 33.3±0.52 34.3±0.61 33.4±0.50 34.5±0.55
Amplitute = Tempend – Tempbegin 1.4±0.42 1.0±0.22 0.9±0.27 1.0±0.24
∆Temp = Tempend – Tempt1 1.4±0.42 1.4±0.40 1.4±0.35 1.5±0.37
S5 Mean±S.D. 33.0±0.47 34.9±0.82 33.6±0.53 35.1±0.67 33.7±0.49 35.3±0.52 33.9±0.44 35.3±0.62
Amplitute = Tempend – Tempbegin 2.0±0.53 1.5±0.34 1.5±0.27 1.3±0.33
∆Temp = Tempend – Tempt1 2.0±0.53 2.1±0.45 2.3±0.34 2.3±0.53
S10 Mean±S.D. 32.9±0.44 35.3±0.57 33.9±0.42 35.5±0.58 34.1±0.48 35.7±0.68 34.3±0.47 35.8±0.60
Amplitute = Tempend – Tempbegin 2.4±0.61 1.7±0.33 1.6±0.44 1.5±0.28
∆Temp = Tempend – Tempt1 2.4±0.61 2.6±0.53 2.8±0.70 2.9±0.65
duced, instead of warmth. In this study, carried out in a controlled environment, the temperatures of water, tube’s outer surface and skin were determined.
The water temperature (from 45.5 to 44.0°C) de-creased almost linearly (–1.28±0.10°C/min) during the whole experiment. he temperature at the tube’s outer surface (from 41.3 to 37.2°C) was always lower than that of the water contained in the tube, and that diference is due to the glass’ low thermal conductivity6.
here is a complementary behavioral relationship be-tween the temperature of the tube’s outer surface and the temperature measured on the skin when it gains heat, i. e., the temperature of the tube’s outer surface decreases and the skin’s temperature increases, though with dif-ferent magnitudes. Such diference is due, mostly, to the fact that the skin’s speciic heat is about ive times that of the glass6,12. herefore, the highest temperature
mea-sured on the skin (35.8°C), i. e., the stimulation temper-ature of the skin’s receptors, was always lower than the temperature measured at the tube’s outer surface (min-imum 37.2°C) and much lower than the water temper-ature (minimum 44.0°C). Even though the water tem-perature (45°C) is, in theory, able to stimulate warming ibers (C ibers), as well as nociceptors responsible for heat pain (Aδ and C ibers), this study revealed that the temperature range of the stimulus measured on the skin during the stimuli (34.3 to 35.8°C) is related to warming ibers (29 to 45°C)9,13. One can note, by relating the data
collected from the present study with the temperature values recommended by the Brazilian Ministry of Health for the assessment of leprosy patients, that the test tube method can be useful in the study of thermal sensitivity, because, in skin injuries, alterations begin in the heating and cooling sensations, progressing to pain sensations (hot and cold) and then to tactile sensitivity14-26.
here-fore, in endemic areas, in the investigation of injuries, the test can be useful in the disease’s early diagnosis.
During the intervals between the stimuli the skin’s temperature did not return to its initial (basal) value, presenting, instead, a tendency to increase. In addition, the magnitude of the stimuli decreased during the ses-sion. hus, the conditions of the second and subsequent stimuli are diferent from those of the irst. Considering the three sessions, S2 presented the smallest temperature diferences between the stimuli, and seems, therefore, to be the most appropriated duration for the stimuli.
In answer to question [A], at the end of each session, whether the 4 stimuli had a similar or diferent inten-sity, and, if diferent, which one was the most intense, 12 of the 14 volunteers reported that the irst stimulus was more intense than the others and the sensation of warmth decreased in the subsequent stimuli, which was conirmed by the measurements of the skin’s
tempera-ture (Table 3). Two volunteers (one male and one female) airmed not to notice any diference in stimuli intensity. In answer to question [B], at the end of the experiment, what was the diference in the perception of the stimuli between the three sessions, all volunteers reported that the thermal sensation in the four stimuli was better per-ceived for stimulation times of five and ten seconds. hat observation suggests that the diference in magni-tude between the irst and second stimuli (0.4°C), which occurred in S2, was not easily noticed, which conirms, from a qualitative standpoint, that stimuli of similar in-tensity occurred.
his test does not allow a quantiication of the re-sults, making it diicult to be compared with subsequent tests. Several factors interfere in its variability and re-peatability, among which, the exact temperature of the water in the tubes, the amount of water, the glass’ thick-ness, room temperature, the positioning of the tube and the pressure it exerts on the skin, as well as the time of contact between the tube and the skin. herefore, it is recommended that such thermal tests be performed with stimulators under strict temperature control, to ensure greater dependability and repeatability to the thermal sensitivity test.
REFERENCES
1. Bacarelli R. Avaliação sensitiva na neuropatia hansênica. In: Duerksen F (Ed). Cirurgia reparadora e reabilitação em hanseníase. Greenville: ALM International; 1997:85-92.
2. Brasil, Ministério da Saúde, Secretaria de Políticas de Saúde, Departa-mento de Atenção Básica. Guia para o Controle da hanseníase. Brasília: Ministério da Saúde; 2002:19.
3. Brasil. Ministério da Saúde. Secretaria de Políticas de Saúde. Departa-mento de Atenção Básica. Hanseníase - Atividades de Controle e Manual de Procedimentos. Brasília: Ministério da Saúde; 2001:38-39.
4. Brasil, Ministério da Saúde, Secretaria de Políticas de Saúde, Departa-mento de Atenção Básica. Vigilância em Saúde: Dengue, Esquistos-somose, Hanseníase, Malária, Tracoma e Tuberculose - 2 ed. Brasília: Minis-tério da Saúde; 2008:71.
5. Castro IM. Um instrumento para investigação da sensibilidade térmica da pele. Hansen Int 1978;3:165-167.
6. Jacobsen R, Lemmon EW, Penoncello SG, Shan Z, Wright NT. Thermophysical Properties of Fluids. In: Bejan A, Kraus AD (Eds). Heat transfer handbook. 10th ed. New Jersey: John Wiley & Sons; 2003:134-139.
7. Neto EA. Prova do éter em hansenologia. Hansenologia Internationalis 1983;8:46-53.
8. Gardner EP, Martin JH, Jessell TM. The Bodily Senses. In: Kandel E, Schwartz J, Jessell T (Eds). Principles of Neural Science. 4th ed. New York: McGraw-Hill Medical; 2000:441-443.
9. Smith C. Biology of Sensory Systems. 2 ed. West Sussex, UK: John Wiley & Sons, Ltd; 2009:415-421.
10. Guyton AC, Hall JE. Textbook of Medical Physiology. 11 ed. Philadelphia, Pennsylvania: Saunders; 2005:607-609.
11. Jones L, Berris M. The psychophysics of temperature perception and thermal-interface design. Proceedings 10th Symposium on Haptic Inter-faces for Virtual Environment and Teleoperator Systems. 2002:137-142. 12. Xu F, Seffen K, Lu T. Non-Fourier analysis of skin biothermomechanics. Int
J Heat Mass Transf 2007;51:2237-2259.
13. Kálmán M, Csillag A. The Skin and Other Diffuse Sensory Systems. Atlas of the Sensory Organs: Functional and Clinical Anatomy. 1st ed. Totowa,
New Jersey: Humana Press 2005:199-200.
15. Saunderson P, Groenen G. Which physical signs help most in the diag-nosis of leprosy? A proposal based on experience in the AMFES project, ALERT, Ethiopia. Lepr Rev 2000;1:34-42.
16. Singh G, Tutakne MA, Tiwari VD, Dutta RK. Quantification of thermal sen-sory loss in follow up of progress in leprosy. Indian J Lepr 1985;4:790-795. 17. Sirumban P, Kumar A, Durai V, Neelan PN. Diagnostic value of cardinal
signs/symptoms in paucibacillary leprosy. Indian J Lepr 1988;2:207-214. 18. Srinivasan H, Stumpe B. Leprosy diagnosis: a device for testing the
thermal sensibility of skin lesions in the field. Bull WHO 1989;6:635-641. 19. Tutakne MA, Tiwari VD, Chakrabarty N, Gupta CM. Quantification of
thermal sensory perception in leprosy (a preliminary report). Indian J Lepr 1985;2:360-363.
20. Villarroel MF, Orsini MBP. Impaired warm and cold perception thresholds in leprosy skin lesions. Lepr Rev 2007;2:102-109.
21. Santiago S, Ferrer T, Espinosa ML. Neurophysiological studies of thin my-elinated (A delta) and unmymy-elinated (C) fibers: application to peripheral neuropathies. Neurophysiol Clin 2000;30:27-42.
22. Jain GL, Pasricha JS, Guha SK. Minimum temperature felt as hot (MTH) - a new concept for grading the loss of temperature sensation in leprosy patients. Int J Lepr Other Mycobact Dis 1985;53:206-210.
23. Natrajan M, Katoch K, Katoch VM. Patients presenting with defined areas of sensory loss-a preliminary study. Indian J Lepr 2001;1:17-26. 24. Ooi WW, Srinivasan J. Leprosy and the peripheral nervous system: basic
and clinical aspects. Muscle Nerve 2004;4:393-409.
25. Ramesh V, Saxena V, Misra RS. How to detect leprosy in some patients with only localized sensory loss. Lepr Rev 1990;1:79-80.
![Fig 1. Temperature sensors [A] their identiication and [B] their positioning for stimulation](https://thumb-eu.123doks.com/thumbv2/123dok_br/15433084.595217/3.955.473.838.458.992/fig-temperature-sensors-identiication-b-positioning-stimulation.webp)