www.atmos-chem-phys.net/13/819/2013/ doi:10.5194/acp-13-819-2013
© Author(s) 2013. CC Attribution 3.0 License.
Chemistry
and Physics
Impact of Gobi desert dust on aerosol chemistry of Xi’an, inland
China during spring 2009: differences in composition and size
distribution between the urban ground surface and the mountain
atmosphere
G. H. Wang1, B. H. Zhou2,3, C. L. Cheng1, J. J. Cao1, J. J. Li1, J. J. Meng3, J. Tao4, R. J. Zhang5, and P. Q. Fu6
1Key Lab of Aerosol Science & Technology, State Key Laboratory of Loess and Quaternary Geology, Institute of Earth
Environment, Chinese Academy of Sciences, Xi’an 710075, China
2School of Environmental and Municipal Engineering, Xi’an University of Architecture and Technology, Xi’an 710055,
China
3Department of Geographical Science and Environmental Engineering, Baoji University of Arts and Sciences, Baoji 721013,
China
4South China Institute of Environmental Sciences, China Ministry of Environmental Protection, Guangzhou 510655, China 5Key Laboratory of Regional Climate-Environment for Temperate East Asia, Institute of Atmospheric Physics, Chinese
Academy of Sciences, Beijing 100029, China
6Institute of Atmospheric Physics, Chinese Academy of Sciences, Beijing 100029, China
Correspondence to:G. H. Wang ([email protected], [email protected]) Received: 30 June 2012 – Published in Atmos. Chem. Phys. Discuss.: 21 August 2012 Revised: 27 November 2012 – Accepted: 19 December 2012 – Published: 22 January 2013
Abstract.Composition and size distribution of atmospheric aerosols from Xi’an city (∼400 m, altitude) in inland China during the spring of 2009 including a massive dust event on 24 April were measured and compared with a parallel mea-surement at the summit (2060 m, altitude) of Mt. Hua, an alpine site nearby Xi’an. EC (elemental carbon), OC (or-ganic carbon) and major ions in the city were 2–22 times higher than those on the mountaintop during the whole sam-pling period. Compared to that in the non-dust period a sharp increase in OC was observed at both sites during the dust pe-riod, which was mainly caused by an input of biogenic organ-ics from the Gobi desert. However, adsorption/heterogeneous reaction of gaseous organics with dust was another important source of OC in the urban, contributing 22 % of OC in the dust event. In contrast to the mountain atmosphere where fine particles were less acidic when dust was present, the urban fine particles became more acidic in the dust event than in the non-dust event, mainly due to enhanced heterogeneous for-mation of nitrate and diluted NH3. Cl−and NO−3 in the urban
air during the dust event significantly shifted toward coarse particles. Such redistributions were further pronounced on
the mountaintop when dust was present, resulting in both ions almost entirely staying in coarse particles. On the con-trary, no significant spatial difference in size distribution of SO24−was found between the urban ground surface and the mountain atmosphere, which dominated in the fine mode (<2.1 µm) during the nonevent and comparably distributed in the fine (<2.1 µm) and coarse (>2.1 µm) modes during the dust event.
1 Introduction
Dust is a major source of particulate matter to the atmo-sphere. Global annual mean burden of aerosol dust is about 20 Tg (±40 %) (McNaughton et al., 2009). Dust can
toxic after mixing with pollutants by absorption and reaction (Griffin et al., 2001). Gobi deserts located in south Mongolia and north China are one of the major source regions of East Asian dust (Arimoto et al., 2006; Sullivian et al., 2007). In each spring and early summer surface dust in Gobi desert re-gion is brought about by front cold systems and the Mongo-lian cyclonic depression and transported into the downwind areas including North America (Leaitch et al., 2009; Seinfeld et al., 2004; VanCuren and Cahill, 2002). During transport mineral dust can internally mix with secondary compounds such as ammonium sulfate, ammonium nitrate, carboxylic acids, nitrogen-containing organics and sea salt by coagula-tion, cloud-processing and heterogeneous reactions (Geng et al., 2009; Seinfeld et al., 2004; Sullivan et al., 2009a; Tobo et al., 2010; Wang et al., 2012a; Zamora et al., 2011; Zhang et al., 2003). These processes modify the physicochemical properties of the airborne aerosols containing dust, exerting a significant impact on the downwind atmospheric environ-ment (Dillner et al., 2006).
Field measurements of the Gobi dust have been per-formed at many sites from the source region in north-ern/northwestern China to North America. However, simul-taneous observation for dust-laden aerosols between the boundary layer and the free troposphere has been conducted only in the Asian continental outflow region such as the ACE-Asia 2001 in Northwest Pacific (Huebert et al., 2003; Seinfeld et al., 2004; Simoneit et al., 2004a, b) and the INTEX-2006 in Northeast America (Dunlea et al., 2009; Peltier et al., 2008; van Donkelaar et al., 2008), but there is no such a simultaneous measurement conducted in inland China. Located in central China, Guanzhong Basin is one of the most polluted regions in the world, where the annual average level of fine particles was more than 80 µg m−3 in
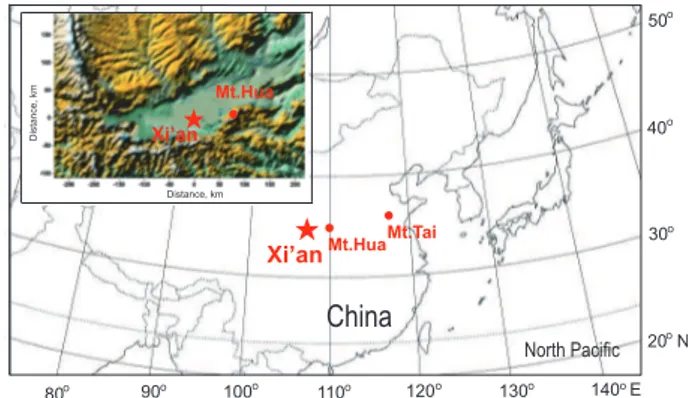
2001–2006 (van Donkelaar et al., 2010; Wang et al., 2006a, b, 2010). In the spring of 2009, an intensive observation of atmospheric aerosols was performed simultaneously in Xi’an (109◦39′E, 34◦45′N), Mt. Hua (110◦06′E, 34◦35′N) and Mt. Tai (117◦06′E, 36◦15′N), which are respectively sit-uated in Guanzhong Basin, inland China and North China Plain, east coastal China (see Fig. 1 for the locations), to identify the similarity and difference in chemical composi-tion and size distribucomposi-tion of aerosols between the ground sur-face and the free troposphere (Wang et al., 2011c, 2012b). During the sampling period a massive dust storm originat-ing from the Gobi desert simultaneously occurred at the three sites. In our previous papers EC(elemental carbon), OC (organic carbon), inorganic ions and organic compounds in PM10 of Mt. Hua and Mt. Tai have been measured to
rec-ognize the horizontal differences in aerosol chemistry be-tween the two mountain areas (Wang et al., 2011c, 2012b). We found Gobi desert plant is the major source of organic aerosols that resulted in a sharp increase in OC at the two alpine sites when dust was present (Wang et al., 2012b). In the current study, we further investigate the difference in aerosol chemistry between the boundary layer and the free
Figure 1 A map discription for Xi’an city and Mt. Hua in Guanzhong Basin, inland China and Mt.Tai in east China (inserted figure showing the topography of Guanzhong Basin)
90 100 110 120 130 140 E
80
30 40 50
★ ★
China
North Pacific 20 No
o o o o o o o
o o o
Mt.Hua•
Xi’an
★ ★ •
Xi’an
Mt.Hua
Distance, km
Distance, km
Mt.Tai•
0.1 1 10 100 1000
0.1 1 10 100 1000
1:1 line PM
y =1.20x - 0.83
r 2= 0.99
SO4
2-NO3
-WSOC
NH4+
Ca 2+
WSIC
Cl-Na+
K+
Mg 2+
Sum of concentration in all the 9-stages,
µ
g m
-3
Concentration in PM , 10 µg m-3
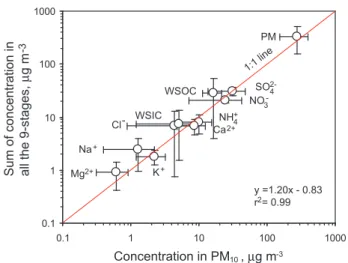
Figure 2. Intercomparison of components measured by the 9-stage sampler and the PM10 sampler during the campaign
Fig. 1.A map description for Xi’an city and Mt. Hua in Guanzhong Basin, central China (inserted figure showing the topography of Guanzhong Basin).
troposphere over Guanzhong Basin, central China by a si-multaneous observation of aerosols in Xi’an and Mt. Hua. Both Xi’an city and Mt. Hua are located within the same region, i.e., Guanzhong Basin, with a distance ∼80 km. A previous study compared the aerosol loading and pre-cipitation amount between Xi’an and Mt. Hua in the past fifty years and found that the decreasing precipitation in Mt. Hua is deeply related to the increasing air pollution over Guanzhong Basin (Rosenfeld et al., 2007). Here, we first characterize composition and size distribution of spring-time airborne particles in Xi’an, and then compare these ur-ban results with the previously published results of Mt. Hua. The current study demonstrated that dust storm has differ-ent effects on the chemical properties of aerosols from the ground surface (∼400 m a.s.l.) and the mountaintop
tropo-sphere (2060 m a.s.l.), resulting in acidity of fine particles in-creasing on the urban ground surface and dein-creasing in the mountaintop atmosphere when dust was present.
2 Experimental section
2.1 Collection of PM10and size-segregated particles
Xi’an city is situated in Guanzhong Basin, a semi-arid region in central China (Fig. 1). PM10 and 9-stage size-segregated
samples were simultaneously collected on the rooftop (10 m above the ground) of a three-story building at Institute of Earth Environment in the urban area of Xi’an. The PM10
sample was collected on a day/night basis at an airflow rate of 100 L min−1, while the size-segregated samples were
G. H. Wang et al.: Impact of Gobi desert dust on aerosol chemistry 821
to ensure the instruments working at the specified flow rates. After sampling, the filter was sealed in an aluminum foil bag and stored at−20◦C before analysis. The particle mass
on the filter was gravimetrically measured using a micro-electronic balance (Mettler M3, Swiss) with a sensitivity limit of 10 µg after a 24-h equilibration inside a chamber (RH=50±10 %,T =23–25◦C). Field blank samples were
collected respectively in the beginning and the end of the sampling campaign by mounting a filter onto the sampler for about 10 min without sucking any air. No significant contam-inants were found in the blank sample except sulfate and ni-trate, which are less than 2 % of the mass in the real samples. Data reported here were all corrected by the field blanks.
During the sampling period, a moderate dust storm (Named as DS I, hereinafter) originating from the Gobi desert reached Xi’an on 20 April, four days later a massive dust storm (Named as DS II, hereinafter), which also origi-nated from the Gobi desert, arrived in Xi’an (on 24 April). Both episodes also simultaneously occurred at Mt. Hua, 80 km east to the city (Fig. 1). During the second event, the PM10 sampling duration was changed into 3–6 h depending
on the particle loading, while the size-segregated sampling duration was changed into one day.
2.2 Sample analysis
2.2.1 Inorganic ions, water-soluble organic (WSOC) and inorganic carbon (WSIC), and water-soluble organic nitrogen (WSON)
One fourth of the filter was cut into pieces (∼0.1 cm2)and extracted with 5 mL Milli-Q pure water under sonication for three times in each, subsequently, combining the extrac-tants for the final analysis. One part of the combined water-extracts was determined for inorganic ions using Dionex-6000 ion chromatography after a measurement of pH value using a pH meter (HANNA HI8424 pH meter, US) at an am-bient temperature of 25◦C. Another part of the water-extracts was determined for water-soluble organic carbon (WSOC), water-soluble inorganic carbon (WSIC) and water-soluble to-tal nitrogen (WSTN) using Shimadzu 5000 TOC/N Analyzer. The detailed analysis methods for inorganic ions, WSOC and WSTN can be found elsewhere (Wang et al., 2010). NO−3 and NH+4 are the major water-soluble inorganic nitrogen (WSIN) species in airborne particles, thus the difference between WSTN and WSIN is defined as water-soluble organic nitro-gen (WSON). It is worth noting that there are possibly some problems associated with sonication, which include mechan-ical rupture of particles that might lead to greater ion release and particle solubility than would naturally occur, although sonication is a common method for aerosol measurement.
Figure 1 A map discription for Xi’an city and Mt. Hua in Guanzhong Basin, inland China
and Mt.Tai in east China (inserted figure showing the topography of Guanzhong Basin)
90 100 110 120 130 140 E
80
30 40
★ ★
China
North Pacific 20 No
o o o o o o o
o o
Mt.Hua•
Xi’an
★ ★ •
Xi’an Mt.Hua
Distance, km
Distance, km
Mt.Tai•
0.1 1 10 100 1000
0.1 1 10 100 1000
1:1 line
PM
y =1.20x - 0.83 r 2= 0.99
SO4
2-NO3
-WSOC
NH4+
Ca 2+
WSIC
Cl-Na+
K+
Mg 2+
Sum of concentration in all the 9-stages,
µ
g m
-3
Concentration in PM , 10 µg m-3
Figure 2. Intercomparison of components measured by the 9-stage sampler and the PM10 sampler during the campaign
Fig. 2.Intercomparison of components measured by the PM10 sam-pler and the 9-stage samsam-pler during the campaign.
2.2.2 Organic carbon (OC) and elemental carbon (EC)
OC and EC in the PM10 samples were measured by a DRI
Model 2001 Carbon Carbon Analyzer using the Interagency Monitoring of Protected Visual Environments (IMPROVE) thermal/optical reflectance (TOR) protocol (Chow et al., 2004, 2007). Briefly, a size of 0.53 cm2 filter was put in a quartz boat inside the analyzer and progressively heated to temperatures of 120◦, 250◦, 450◦, and 550◦ in a non-oxidizing helium (He) atmosphere, and 550◦, 700◦, and 800◦
in an oxidizing atmosphere containing 2 % oxygen in helium. An intercomparison was made for the PM10 and the
size-resolved samplers. As shown in Fig. 2, a linear correlation was observed for particle mass (PM) and major species mea-sured by the two samplers with a slope close to unity, indicat-ing a good agreement between the two data sets. A parallel observation was performed at the summit (2060 m a.s.l.) of Mt. Hua using the same sampling instruments; the related data have been published elsewhere (Wang et al., 2011c, 2012b) and are cited here to investigate the difference in composition and size distribution between the urban ground surface and the mountaintop troposphere.
Aerosols were simultaneously collected at the summit of Mt. Hua using a sampling protocol same as that in Xi’an, except for PM10during the non-dust period, which was
col-lected for 24 h in each in order to obtain enough materials. As seen in Fig. 3, air masses reaching Xi’an and Mt. Hua during the DS II period originated from the same Gobi re-gions and transported via same pathways before simultane-ously arriving at the two sites, resulting in particles in the DS II event presenting similar levels of loading (PM10in Xi’an
and Mt. Hua were 589±273 and 506±303 µg m−3,
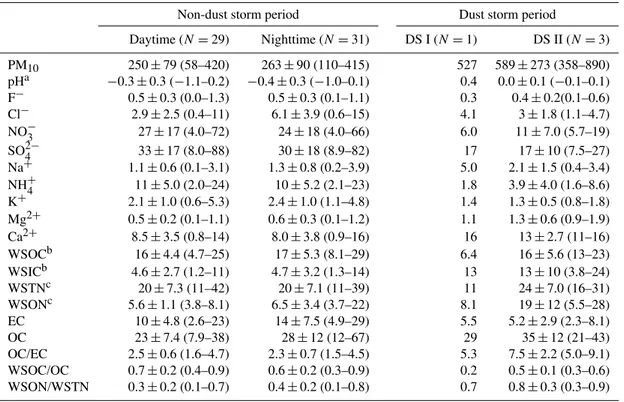
Table 1.Concentrations of water-soluble species, elemental carbon (EC) and organic carbon (OC) of PM10during the spring 2009 in Xi’an,
China, µg m−3.
Non-dust storm period Dust storm period
Daytime (N=29) Nighttime (N=31) DS I (N=1) DS II (N=3)
PM10 250±79 (58–420) 263±90 (110–415) 527 589±273 (358–890)
pHa −0.3±0.3 (−1.1–0.2) −0.4±0.3 (−1.0–0.1) 0.4 0.0±0.1 (−0.1–0.1)
F− 0.5±0.3 (0.0–1.3) 0.5±0.3 (0.1–1.1) 0.3 0.4±0.2(0.1–0.6)
Cl− 2.9±2.5 (0.4–11) 6.1±3.9 (0.6–15) 4.1 3±1.8 (1.1–4.7)
NO−3 27±17 (4.0–72) 24±18 (4.0–66) 6.0 11±7.0 (5.7–19)
SO24− 33±17 (8.0–88) 30±18 (8.9–82) 17 17±10 (7.5–27)
Na+ 1.1±0.6 (0.1–3.1) 1.3±0.8 (0.2–3.9) 5.0 2.1±1.5 (0.4–3.4)
NH+4 11±5.0 (2.0–24) 10±5.2 (2.1–23) 1.8 3.9±4.0 (1.6–8.6)
K+ 2.1±1.0 (0.6–5.3) 2.4±1.0 (1.1–4.8) 1.4 1.3±0.5 (0.8–1.8)
Mg2+ 0.5±0.2 (0.1–1.1) 0.6±0.3 (0.1–1.2) 1.1 1.3±0.6 (0.9–1.9)
Ca2+ 8.5±3.5 (0.8–14) 8.0±3.8 (0.9–16) 16 13±2.7 (11–16)
WSOCb 16±4.4 (4.7–25) 17±5.3 (8.1–29) 6.4 16±5.6 (13–23)
WSICb 4.6±2.7 (1.2–11) 4.7±3.2 (1.3–14) 13 13±10 (3.8–24)
WSTNc 20±7.3 (11–42) 20±7.1 (11–39) 11 24±7.0 (16–31)
WSONc 5.6±1.1 (3.8–8.1) 6.5±3.4 (3.7–22) 8.1 19±12 (5.5–28)
EC 10±4.8 (2.6–23) 14±7.5 (4.9–29) 5.5 5.2±2.9 (2.3–8.1)
OC 23±7.4 (7.9–38) 28±12 (12–67) 29 35±12 (21–43)
OC/EC 2.5±0.6 (1.6–4.7) 2.3±0.7 (1.5–4.5) 5.3 7.5±2.2 (5.0–9.1)
WSOC/OC 0.7±0.2 (0.4–0.9) 0.6±0.2 (0.3–0.9) 0.2 0.5±0.1 (0.3–0.6)
WSON/WSTN 0.3±0.2 (0.1–0.7) 0.4±0.2 (0.1–0.8) 0.7 0.8±0.3 (0.3–0.9)
apH=pH value of water-extracts of sample−pH value of the field blank; bWSOC and WSIC are water-soluble organic and inorganic carbon; cWSTN is water-soluble total nitrogen and WSON is WSTN−N of NH+
4 and NO
−
3.
showed comparable concentrations in Xi’an and Mt. Hua in the occurrence of the DS II event. Therefore, we believe that both sites were dominated by a same air mass during the DS II episode and differences in chemical compositions of the dust samples from Xi’an and Mt. Hua in the dust event were mostly caused by adsorption/reaction of the lowland pollu-tants with dust.
3 Results and discussion
3.1 Chemical composition
3.1.1 Chemical composition of PM10in Xi’an during
the non-dust and dust episodes
Temporal variation of PM10 is presented in Fig. 4, and the
chemical component concentrations are summarized in Ta-ble 1. PM10ranged from 58 to 420 µg m−3in the nonevent
time with EC and OC as high as 29 and 67 µg m−3, respec-tively, suggesting a high loading of pollutants in the city. As seen in Table 1, there is no significant difference in the concentrations between day and night during the non-dust storm period, which is mostly due to the stagnant meteoro-logical conditions within the basin-like region. The daytime and nighttime OC/EC ratios were 2.5±0.6 and 2.3±0.7
during the nonevent period, respectively. Relative abundance of water-soluble organic nitrogen (WSON) to water-soluble total nitrogen (WSTN) were 0.3±0.2 and 0.4±0.2 in the
day and night samples during the non-dust storm period (Ta-ble 1), suggesting that inorganic nitrogen compounds, i.e., nitrate and ammonium, are the major nitrogen-containing species in the atmosphere during the non-dust event pe-riod. However, WSON/WSTN ratios increased to 0.7 and 0.8±0.3 in the DS I and DS II episodes, respectively,
indi-cating that organic nitrogen species during the events were more abundant than ammonium and nitrate. The absolute concentration of WSON was 8.1 and 19±12 µg m−3
110°
100°
90°
80° 120° 130°E
30°
40°
50°N
20°
30°
40°
50°N
20°
110°
100°
90°
80° 120° 130°E
110°
100°
90°
80° 120° 130°E
30°
40°
50°N
20°
(c) DS II (04/24/2009)
Xi’an Mt. Hua (Red: Xi’an; Blue:Mt. Hua)
(b) Non-dust event, Mt. Hua (03/25-04/25,2009) (a) Non-dust event, Xi’an (03/25-04/25,2009)
Figure 3. Backward trajectories of air masses reaching Xi’an and Mt. Hua during (a, b) the non-dust event (24h interval, air masses transported from northerly are in red while those from southerly are in blue) and (c) the dust storm event II (DS II, 0:00-18:00, local time, 6h interval, air massese reaching Xi’an
are in red while those reaching Mt. Hua are in blue) (The yellowish shadow in Figure c is the Gobi desert region)
Figure 4. Temporal variation of PM10 in Xi’an during the spring of 2009 (DS I and DS II in red colour represent the two dust storm events occuring on April 20th and 24th, respectively)
0 100 200 300 400 500 600 700 800 900 1000
0325 0326 0327 0328 0329 0330 0331 0401 0402 0403 0404 0405 0406 0407 0408 0409 0410 041
1
0412 0413 0414 0415 0416 0417 0418 0419 0420 0421 0422 0423 0424 0425
DS I DS II
rainy
rainy rainy rainy foggy rainy
PM 10 concentration, µ g m -3
Sampling date in 2009
Fig. 3.Backward trajectories of air masses reaching Xi’an and Mt. Hua during(a, b)the non-dust event (24 h interval, air masses transported
from northerly are in red while those from southerly are in blue) and(c)the dust storm event II (DS II, 00:00–18:00, local time, 6 h interval,
air masses reaching Xi’an are in red while those reaching Mt. Hua are in blue) (The yellowish shadow in(c)is the Gobi desert region).
110°
100°
90°
80° 120° 130°E
30°
40°
50°N
20°
30°
40°
50°N
20°
110°
100°
90°
80° 120° 130°E
110°
100°
90°
80° 120° 130°E
30°
40°
50°N
20°
(c) DS II (04/24/2009)
Xi’an Mt. Hua (Red: Xi’an; Blue:Mt. Hua)
(b) Non-dust event, Mt. Hua (03/25-04/25,2009)
(a) Non-dust event, Xi’an (03/25-04/25,2009)
Figure 3. Backward trajectories of air masses reaching Xi’an and Mt. Hua during (a, b) the non-dust event
(24h interval, air masses transported from northerly are in red while those from southerly are in blue)
and (c) the dust storm event II (DS II, 0:00-18:00, local time, 6h interval, air massese reaching Xi’an
are in red while those reaching Mt. Hua are in blue) (The yellowish shadow in Figure c is the Gobi desert region)
Figure 4. Temporal variation of PM10 in Xi’an during the spring of 2009 (DS I and DS II in red colour represent the two dust storm events occuring on April 20th and 24th, respectively)
0 100 200 300 400 500 600 700 800 900 1000
0325 0326 0327 0328 0329 0330 0331 0401 0402 0403 0404 0405 0406 0407 0408 0409 0410 041
1
0412 0413 0414 0415 0416 0417 0418 0419 0420 0421 0422 0423 0424 0425
DS I DS II
rainy
rainy rainy rainy foggy rainy
PM 10 concentration, µ g m -3
Sampling date in 2009
Fig. 4.Temporal variation of PM10 in Xi’an during the spring of
2009 (DS I and DS II in red color represent the two dust storm events occurring on 20 and 24 April, respectively).
regions in the world, which warrants a further exploration. In addition, the WSON level is higher in the dust event than in the non-dust period, probably due to an additional WSON source upwind that was not present in the non-dust periods. Mass closure analysis further showed that the sum of total inorganic ions, EC and organic matter (OM) accounted for over 70 % of PM10mass with the remaining being insoluble
mineral dust (Fig. 5a, b), in contrast to that in the dust peri-ods, which was only 23 % and 24 % in the DS I and DS II events, respectively (Fig. 5c, d).
10% 13% 4% other ions 6% Carbonate ion 11% OM 23% EC 4% remaining 29%
NO3
-SO42
-NH4+
10% 12% NH 4% other ions 7% Carbonate ion 9% OM 26% EC 5% remaining 27%
NO3
-SO42
-4 + OM 10% remaining 67% 1% Carbonate ion 13% other ions 5% 0.3% 3% EC 1%
NH4+
SO42
-NO3
-OM 12% remaining 66% 1% 3%
2% other ions4%
Carbonate ion 11%
EC 1%
NH4+
SO42
-NO3
-(I) Non-dust period
(II) Dust storm period
(a)
Daytime Nighttime(b)
(c)
DS I DS II (d)
Figure 5. Mass closure of PM10 during the sampling periods (OM: organic matter=OC X 1.6)
Fig. 5.Mass closure of PM10 during the sampling periods (OM:
0 15 30 45 60 75 90
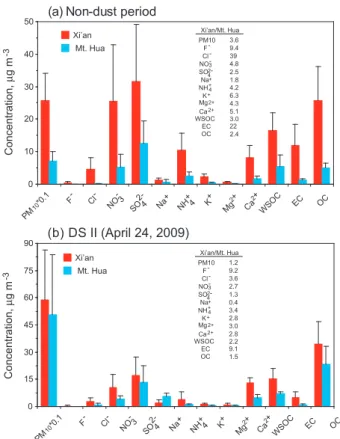
Figure 6. Difference in concentration of airborne species in Xi’an and Mt. Hua during the non-dust and dust storm periods (inserted numbers are the concentration ratios of Xi’an to Mt. Hua)
(a) Non-dust period
(b) DS II (April 24, 2009)
Concentration,
µ
g m
-3
Xi’an Mt. Hua 0
10 20 30 40 50
4 PM10 3.6
F 9.4 Cl 39 NO 4.8 SO 2.5 Na 1.8 NH 4.2 K 6.3 Mg 4.3 Ca 5.1 Xi’an/Mt. Hua
-3 2 -+ 4 + + 2+ 2+ EC 22 OC 2.4 WSOC 3.0 Xi’an
Mt. Hua
EC OC
Ca2 + Mg2
+
F- Na+ NH+4 K+
SO 4 2-Cl- NO-3 PM
10*0.
1
Concentration,
µ
g m
-3
WSOC
EC OC
Ca2 + Mg2
+ F- Cl- NO-3 SO 42- Na+ NH+4 K+
PM
10*0.
1
WSOC
4 PM10 1.2
F 9.2 Cl 3.6 NO 2.7 SO 1.3 Na 0.4 NH 3.4 K 2.8 Mg 3.0 Ca 2.8 Xi’an/Mt. Hua
-3 2 -+ 4 + + 2+ 2+ EC 9.1 OC 1.5 WSOC 2.2
Fig. 6.Differences in concentrations of components of PM10from
Xi’an and Mt. Hua during the non-dust and dust storm periods (in-serted numbers are the concentration ratios of Xi’an to Mt. Hua).
3.1.2 Difference in chemical composition between Xi’an and Mt. Hua
Figure 6 compares differences in the concentrations of ma-jor aerosols in Xi’an with those in Mt. Hua during the same periods. In the nonevent time PM10 in Xi’an was 3.6 times
that in Mt. Hua (Fig. 6a), and the most abundant species in the PM10samples at both sites was SO24−, followed by NO−3,
OC and NH+4. On the contrary, in the DS II time the most abundant species in the PM10samples at both sites was OC,
followed by SO24−, Ca2+and NO−3 (Fig. 6b). Our previous study (Wang et al., 2012b) found that compared to that in the non-dust event the increased OC in the Mt. Hua dust samples mainly originated from Gobi plants.
NO−3/SO24−molar ratio was 1.22±0.48 (range, 0.20−2.2) in Xi’an and 0.60±0.36 (range, 0.19–1.4) in Mt. Hua during the dust storm period. Compared to those in the non-dust event the ratio of NO−3/SO24− during the DS II period decreased to 0.97±0.26 (range, 0.67–1.2) in Xi’an but was
almost constant in Mt. Hua (0.68±0.32, 0.43–1.0) (Wang
et al., 2011c). The major formation pathways of NO−3 and SO24− in the atmosphere are the photo-oxidation of NO2
and SO2 with OH radical (Formenti et al., 2011; J¨ockel et
al., 2003; Seinfeld and Pandis, 1998), but the NO−3
forma-tion is about 10 times faster than that of SO24− (Rodhe et al., 1981; Vrekoussis et al., 2004, 2007). Field observation showed that ground surface levels of NO2and SO2are
sim-ilar in inland China. For example, annual means of NO2
and SO2in Xi’an were 43 and 41 µg m−3during 2006–2007
(Shen et al., 2008), 0.7±0.4 and 0.6±0.4 ppbv in Waliguan
during 2007–2008 (Meng et al., 2010), and 2.7±1.6 and
2.2±0.7 ppbv in Qinghai Lake in March–April, 2012
(un-published data). Therefore, relative abundance of nitrate to sulfate higher in the urban air and lower in the mountain atmosphere can be explained firstly by the different forma-tion rates and secondly by cloud processing at the summit of Mt. Hua, which favors sulfate formation. The different reac-tion rates also suggest that nitrate formareac-tion is only signif-icant close to the source area but sulfate formation is con-tinuous during the transport. Sulfate is non-volatile and the strongest acid, once formed in the dust it may prevent other weaker acids like HNO3 and HCl accumulate onto the dust
(Sullivian et al., 2007). Therefore, compared to that in the nonevent the smaller NO−3/SO24− ratio in Xi’an during the DS II time further reveals a continuous formation of sulfate during the long-range transport of dust storm.
As shown in Fig. 7a, particles in the mountain troposphere during the non-dust event contained more sulfate compared to those in the urban air, but relative abundance of ammo-nium in the alpine PM10 samples was similar to that in
the urban samples and nitrate was less than that in the ur-ban samples, probably indicating a displacement of ammo-nium nitrate by ammoammo-nium bisulfate/sulfate in the moun-tain aerosols, which may occur during the transport of pol-lutants onto the mountaintop. During the DS II period the most significant differences in relative abundance between the ground surface and the mountain troposphere were found for F−and EC, 9 times more abundant in the urban area than in the alpine region (Fig. 7b), because both pollutants in Guanzhong Basin are largely originated from lowland sources such as coal combustion and vehicle exhaust. Com-pared with those on the mountaintop, relative abundances of NO−3, Mg2+ and Ca2+ in the DS II time at the urban site were much more abundant (Fig. 7b), which can be at-tributed to heterogeneous reactions of gaseous HNO3, N2O5
and NOxwith the crustal alkaline metals in the dust (Arimoto
et al., 2004; Geng et al., 2009; Tobo et al., 2010; Triendl, 1998; Zamora et al., 2011). Xi’an and Mt. Hua are located in the same latitude with a distance about 80 km, and transport velocity of dust storm is generally very fast. Furthermore, DS II event simultaneously occurred in Xi’an and Mt. Hua with a similar pattern of particle size distribution (see the de-tails in Fig. 9s and t and more discussion later). Therefore, it is plausible that the differences in relative abundances of components of PM10 between the urban and mountain sites
OC EC Ca
2+
Mg2 + F- Na+ NH+4 K+
SO 4 2-Cl- NO-3
WSO C
Pe
rc
en
ta
ge
o
f c
om
po
ne
nt
in
P
M
10
, %
0 2 4 6 8 10
OC EC Ca
2+
Mg2 + F- Na+ NH+4 K+
SO 4 2-Cl- NO-3
WSO C
0 5 10 15 20 25 30
Pe
rc
en
ta
ge
o
f c
om
po
ne
nt
in
P
M
10
, %
x10 x10
Figure 7. Relative abunance of component to PM10 from Xi’an and Mt. Hua during (a) the non-dust storm and (b) the dust storm periods
(a) Non-dust period
(b) DS II (April 24, 2009) Mt. Hua
Xi’an
Mt. Hua Xi’an
x10
x10
Fig. 7.Relative abundances of components of PM10 from Xi’an
and Mt. Hua during(a)the non-dust storm and(b)the dust storm
periods.
pollutants during the event using the following equation.
A=CiXi′an−
"
CiMt.Hua
PMMt.10 Hua
#
×PMXi10′an (1)
where A is the pollutant i formed from lowland sources (µg m−3),CXii ’anandCiMt.Huaare the concentrations of pol-lutantiin the Xi’an and Mt. Hua dust samples.
We found that in the DS II event 6.1, 2.1, 2.6, 7.7, 7.5, 4.5 and 7.6 µg m−3of NO−3, SO42−, NH+4, Ca2+, WSOC, EC and OC originated from local sources, accounting for 57 %, 12 %, 66 %, 59 %, 48 %, 87 % and 22 % of those in PM10,
respectively (see Table 2). Compared with that (2.1 µg m−3, Table 2) of sulfate the nitrate formed from the local sources (6.1 µg m−3, Table 2) during the DS II was about three times
higher, again confirming a faster heterogeneous formation of nitrate on the dust, which largely occurs on particles with di-ameter larger than 3.3 µm (see more discussion below) and is consistent with the results reported previously (Phadnis and Carmichael, 2000). Interestingly, in the event abundance of WSOC formed from the local sources is almost entirely equal to that of OC (7.5 µg m−3versus 7.6 µg m−3, Table 2). This is reasonable because compared to Mt. Hua samples, an increase in OC of the Xi’an samples resulted from
heteroge-neous reactions of gaseous acids and amines with dust, which are water-soluble. Moreover, as shown in Table 2, same level increases of K+(59 %), Mg2+(61 %), and Ca2+(59 %) were
observed for the urban dust samples, which were caused by heterogeneous reactions of acidic gases with the urban dust particles. In comparison to those in the mountain samples the above similar levels of increases of WSOC, OC, K+, Mg2+ and Ca2+ again confirm that Xi’an and Mt. Hua were pre-dominated by a same air mass in the DS II period.
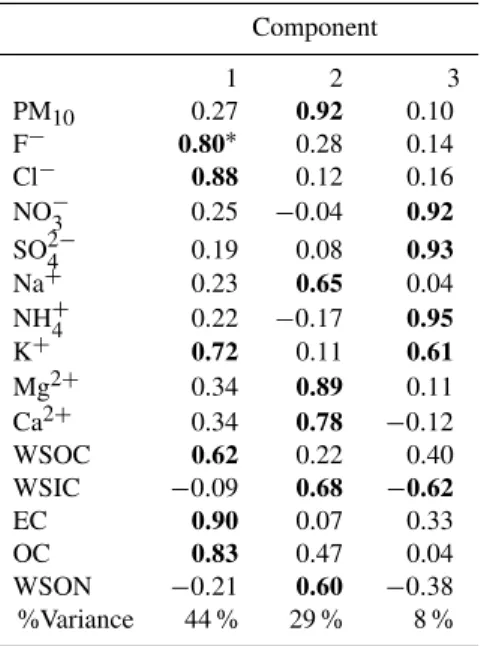
To further recognize the sources of pollutants in Xi’an, major species in PM10 were analyzed using the statistic
method of principal component analysis (PCA). As shown in Table 3, component 1 is associated with F−, Cl−, K+, WSOC, EC and OC, respectively, and represents fossil fuel and biomass combustion source, because F−, K+, WSOC
and EC are largely derived from fossil fuel and biomass burn-ing emission in China (Dan et al., 2004; Kline et al., 2004; Zhang et al., 2011). Component 2 represents dust emissions, because crustal species such as Na+, Mg2+, Ca2+, and WSIC showed strong correlations with this factor. The coefficient of WSON with component 2 is 0.60, indicating soil/dust is an important source especially in the dust storm periods. Com-ponent 3 displays high loadings with NO−3, SO24−and NH+4, and thus represents a source of secondary formation. These three components explain 44 %, 29 % and 8 % of the total variance, respectively, and indicate fossil fuel/biomass com-bustion, soil/dust suspension and secondary formation as the major sources of PM10in the city.
3.2 Size distribution
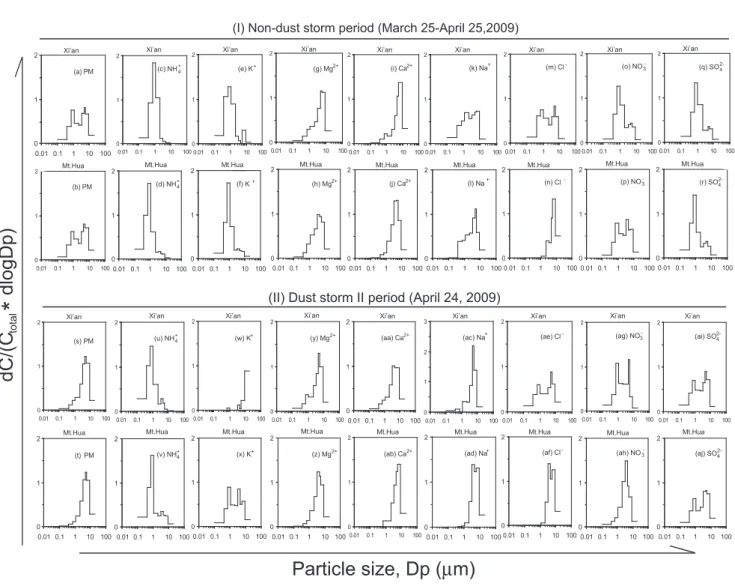
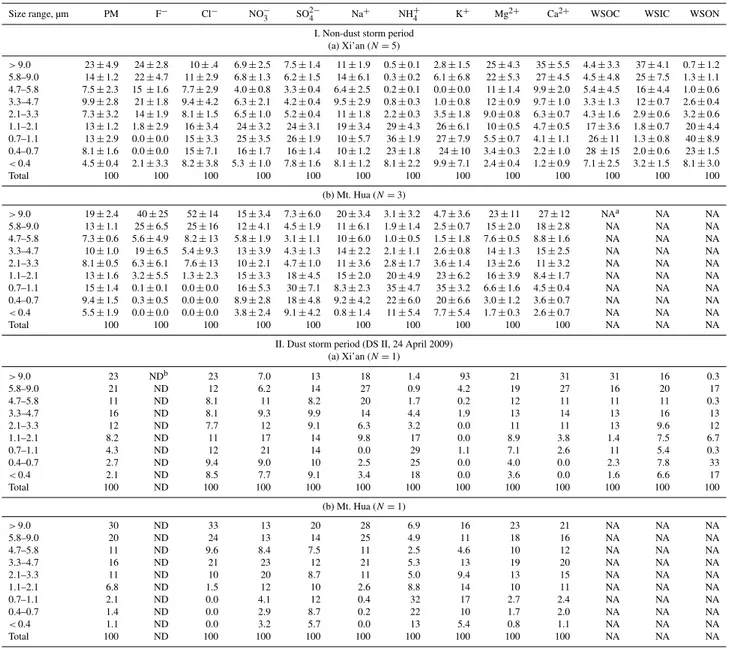
Almost all physicochemical and optical properties of aerosol are size-dependent (Hinds, 1999). The size of ambient aerosol varies during transport due to various atmospheric processes such as coagulation, evaporation, and adsorp-tion/absorption (Herner et al., 2006). Detailed size distribu-tions of particle mass (PM), inorganic ions and water-soluble organic (WSOC) and inorganic (WSIC) carbon during the nonevent and the event (DS II) are illustrated in Fig. 8 and Fig. 9, respectively. Their relative abundances in each size range are summarized in Table 4. Details in size distribu-tions of major species during the same period in the tropo-sphere over Mt. Hua have been reported elsewhere (Wang et al., 2011c) and are cited here for a comparison.
3.2.1 Difference in size distribution of aerosols from Xi’an and Mt. Hua during the non-dust storm period
Table 2.Concentrations of species derived from local sources and their relative abundance to the total in PM10samples of Xi’an during the
dust storm event (DS II, 24 April 2009).
F− Cl− NO−3 SO24− NH+4 K+ Mg2+ Ca2+ WSOC EC OC Concentrations of species from local sources, µg m−3 0.3 2.0 6.1 2.1 2.6 0.8 0.8 7.7 7.4 4.5 7.6
Relative abundance to the total in PM10, % 87 67 57 12 66 59 61 59 48 87 22
0 1 2
0.01 0.1 1 10 100 0 1 2
0.01 0.1 1 10 1000 1 2
0.01 0.1 1 10 100 0 1 2
0.01 0.1 1 10 1000 1 2
0.01 0.1 1 10 1000 1 2
0.01 0.1 1 10 100 0 1 2
0.01 0.1 1 10 1000 1 2
0.01 0.1 1 10 100 0 1 2
0.01 0.1 1 10 100
(I) Non-dust storm period (March 25-April 25,2009)
0 1 2
0.01 0.1 1 10 100 0 1 2
0.01 0.1 1 10 100 0 1 2
0.01 0.1 1 10 100 (d) NH4+ (f) K+ (h) Mg2+
0 1 2
0.01 0.1 1 10 100 (p) NO -3
0 1 2
0.01 0.1 1 10 100 (r) SO4
2-0 1 2
0.01 0.1 1 10 100 (j) Ca2+
0 1 2
0.01 0.1 1 10 100 (n) Cl
-0 1 2
0.01 0.1 1 10 100 (l) Na+ 0
1 2
0.01 0.1 1 10 100
(b) PM
0 1 2
0.01 0.1 1 10 1000 1 2
0.01 0.1 1 10 100 0 1 2
0.01 0.1 1 10 1000 1 2
0.01 0.1 1 10 100
0 1 2
0.01 0.1 1 10 100 0 1 2 3
0.01 0.1 1 10 100 0 1 2
0.01 0.1 1 10 100 0 1 2
0.01 0.1 1 10 1000 1 2
0.01 0.1 1 10 100
Particle size, Dp (
µ
m)
01 2
0.1 1 10 100 0 1 2
0.01 0.1 1 10 1000 1 2
0.01 0.1 1 10 100 0
1 2
0.01 0.1 1 10 100 0 1 2
0.01 0.1 1 10 100
Mt.Hua Mt.Hua Mt.Hua Mt.Hua Mt.Hua
(II) Dust storm II period (April 24, 2009)
0 1 2
0.01 0.1 1 10 100
0 1 2
0.01 0.1 1 10 100 0 1 2
0.01 0.1 1 10 100
Mt.Hua Mt.Hua Mt.Hua
(v) NH+4 (x) K+ (z) Mg2+ (ab) Ca2+ (ad) Na+ (af) Cl- (ah) NO -3 (aj) SO4
2-0 1 2
0.01 0.1 1 10 100 0.01 Mt.Hua
(t) PM
Mt.Hua Mt.Hua Mt.Hua Mt.Hua Mt.Hua Mt.Hua Mt.Hua Mt.Hua
Mt.Hua
Xi’an Xi’an Xi’an Xi’an Xi’an Xi’an Xi’an Xi’an
Xi’an
Xi’an Xi’an Xi’an Xi’an Xi’an Xi’an Xi’an Xi’an
Xi’an
(c) NH4+ (e) K+ (g) Mg2+ (o) NO3
- (q) SO
4 2-(i) Ca2+ (k) Na+ (m) Cl
-(a) PM
(u) NH4+ (w) K+ (y) Mg2+ (ag) NO3
- (ai) SO 4 2-(aa) Ca2+ (ac) Na+ (ae) Cl
-(s) PM
C(/
Cd
)p
Dg
ol
d
*
lat otFigure 8. Difference in size distributions of particle mass (PM) and inorganic ions in the atmospheres of Xi’an and Mt. Hua during (I) the non-dust storm and (II) the dust storm periods
Fig. 8.Differences in size distributions of particle mass (PM) and inorganic ions in the atmospheres of Xi’an and Mt. Hua during (I) the non-dust storm and (II) the dust storm periods.
Guanzhong Basin in spring. Ammonium presented a uni-modal pattern in the urban air with the highest peak at the size of 0.7–1.1µm (Fig. 8c). Potassium ion showed a bimodal pattern with a major peak in the fine mode (<2.1µm) and small peak in the coarse mode (>2.1µm) (Fig. 8e). Particu-late ammonium is formed by a homogeneous reaction of am-monia with acidic gasses such HNO3and HCl and a
subse-quent partition into solid phase and/or a heterogeneous reac-tion of ammonia with aqueous sulfuric acid. Therefore, a fine mode of ammonium was found at both sites (Fig. 8c, d). The small fraction of ammonium in the coarse fraction is mostly
derived from suspended soil containing fertilizer. Generally, fine mode of K+ is mostly derived from biomass burning while the coarse mode K+ can be attributed to suspended soil (Fig. 8e) (Zhang et al., 2011). Such a soil-derived K+ is less significant at the mountaintop, thus only a unimodal pattern was observed in the elevated troposphere (Fig. 8f). Mg2+ and Ca2+ have dominant crustal origins, and both showed a coarse mode between the boundary layer and the elevated troposphere (Fig. 8q–j). Na+is an important
Table 3.Principal component analysis for PM10 of Xi’an during
the whole sampling period (N=64).
Component
1 2 3
PM10 0.27 0.92 0.10
F− 0.80∗ 0.28 0.14
Cl− 0.88 0.12 0.16
NO−3 0.25 −0.04 0.92
SO24− 0.19 0.08 0.93
Na+ 0.23 0.65 0.04
NH+4 0.22 −0.17 0.95
K+ 0.72 0.11 0.61
Mg2+ 0.34 0.89 0.11
Ca2+ 0.34 0.78 −0.12
WSOC 0.62 0.22 0.40
WSIC −0.09 0.68 −0.62
EC 0.90 0.07 0.33
OC 0.83 0.47 0.04
WSON −0.21 0.60 −0.38
%Variance 44 % 29 % 8 %
∗Absolute values more than 0.5 are highlighted in bold.
fine fraction of Na+ can be explained by a biomass burn-ing contribution, because biomass smoke contains a signifi-cant amount of Na2SO4(Andreae et al., 1998). Cl−showed
an accumulation mode and a coarse mode in the urban area (Fig. 8m) but only exhibited a coarse mode in the mountain atmosphere (Fig. 8n). KCl is one of major species of airborne particulate Cl−, which is produced in the biomass
combus-tion process and emitted into the air as fine particles. During the ageing process of biomass burning plume KCl can react with gaseous HNO3and H2SO4 and release HCl into the air
(Ikegami et al., 2001; Li et al., 2003; Posfai et al., 2003). The gaseous HCl further transforms into aerosol phase by reaction with coarse particles (Hand et al., 2005; Tobo et al., 2010). Therefore, a bimodal pattern of Cl−was obtained in the urban region (Fig. 8m). That the fine mode peak of Cl− was not evident at the mountain site indicates that the biomass burning derived aerosols was more aged when they arrived at the mountaintop (Fig. 8n). Because both are sec-ondarily produced in the atmosphere, nitrate and sulfate are largely distributed in fine particles (Fig. 8o–r). The coarse mode of nitrate and sulfate can be attributable to uptake of gaseous HNO3 and H2SO4 onto coarse particles. In
addi-tion, sulfate in the coarse mode also has a soil primary emis-sion source, since loess and desert dust also contain a certain amount of sulfate (Sun et al., 2010). Ammonium nitrate is the major form of particulate NO−3, which is volatile and easily converts to gaseous NH3and HNO3. As discussed above the
reaction of SO2with OH radical to produce H2SO4is slower
compared to that of NOx with OH to form HNO3, thus it
is expected that sulfate may be continuously formed during the transport of the precursors from the boundary layer to
the free troposphere. The newly formed sulfate can displace the pre-existing nitrate into the air, because sulfuric acid is the strongest and nonvolatile (Sullivian et al., 2007). Due to the above reasons nitrate continuously redistributes from fine particles onto coarse particle during long-range transport while sulfate remains in fine particles, resulting in the size distribution of nitrate changing into a bimodal pattern with two equivalent peaks in the fine and coarse fractions in the mountain air but no significant change for sulfate (Fig. 8p, r).
3.2.2 Difference in size distribution of aerosols from Xi’an and Mt. Hua during dust storm on 24 April 2009 (DS II)
When dust was present all species in the urban air shifted to-ward larger sizes (Fig. 8s–ai), similar to those on the moun-taintop (Fig. 8–aj). Compared to particle size distribution sampled in the nonevent, a greater portion of particles during the dust event was present in the coarse mode (Fig. 8s, t). As in the nonevent, ammonium was enriched in the fine mode, but a minor peak occurred in the coarse fraction (Fig. 8u, v), which can be attributed to fertilizer and biota in the dust. Ammonium in the size of 1.1–2.1 µm in Xi’an (Fig. 8u) and Mt. Hua (Fig. 8v) during the dust episode became less abun-dant compared to that in the nonevent at both sites (Fig. 8c, d), which is in part resulted from a less significant fine par-ticle coagulation due to reduced residence time in the event compared with that in the nonevent (Wang et al., 2012b). Be-cause K+, Mg2+, Ca2+and Na+ are originated from Gobi
desert dust, these four ions dominated in the coarse mode in Xi’an during the event (Fig. 8w–ac), which is similar to those in the mountain atmosphere except K+(Fig. 8x–ad) and
Table 4.Concentration percentages (%) of particle mass (PM), inorganic ions, water-soluble organic carbon (WSOC), water-soluble inor-ganic carbon (WSIC) and water-soluble orinor-ganic nitrogen (WSON) in the size-resolved aerosols from Xi’an and Mt. Hua during the spring of 2009.
Size range, µm PM F− Cl− NO−
3 SO2
−
4 Na
+ NH+
4 K
+ Mg2+ Ca2+ WSOC WSIC WSON
I. Non-dust storm period (a) Xi’an (N=5)
>9.0 23±4.9 24±2.8 10±.4 6.9±2.5 7.5±1.4 11±1.9 0.5±0.1 2.8±1.5 25±4.3 35±5.5 4.4±3.3 37±4.1 0.7±1.2
5.8–9.0 14±1.2 22±4.7 11±2.9 6.8±1.3 6.2±1.5 14±6.1 0.3±0.2 6.1±6.8 22±5.3 27±4.5 4.5±4.8 25±7.5 1.3±1.1 4.7–5.8 7.5±2.3 15±1.6 7.7±2.9 4.0±0.8 3.3±0.4 6.4±2.5 0.2±0.1 0.0±0.0 11±1.4 9.9±2.0 5.4±4.5 16±4.4 1.0±0.6 3.3–4.7 9.9±2.8 21±1.8 9.4±4.2 6.3±2.1 4.2±0.4 9.5±2.9 0.8±0.3 1.0±0.8 12±0.9 9.7±1.0 3.3±1.3 12±0.7 2.6±0.4 2.1–3.3 7.3±3.2 14±1.9 8.1±1.5 6.5±1.0 5.2±0.4 11±1.8 2.2±0.3 3.5±1.8 9.0±0.8 6.3±0.7 4.3±1.6 2.9±0.6 3.2±0.6 1.1–2.1 13±1.2 1.8±2.9 16±3.4 24±3.2 24±3.1 19±3.4 29±4.3 26±6.1 10±0.5 4.7±0.5 17±3.6 1.8±0.7 20±4.4 0.7–1.1 13±2.9 0.0±0.0 15±3.3 25±3.5 26±1.9 10±5.7 36±1.9 27±7.9 5.5±0.7 4.1±1.1 26±11 1.3±0.8 40±8.9 0.4–0.7 8.1±1.6 0.0±0.0 15±7.1 16±1.7 16±1.4 10±1.2 23±1.8 24±10 3.4±0.3 2.2±1.0 28±15 2.0±0.6 23±1.5
<0.4 4.5±0.4 2.1±3.3 8.2±3.8 5.3±1.0 7.8±1.6 8.1±1.2 8.1±2.2 9.9±7.1 2.4±0.4 1.2±0.9 7.1±2.5 3.2±1.5 8.1±3.0
Total 100 100 100 100 100 100 100 100 100 100 100 100 100
(b) Mt. Hua (N=3)
>9.0 19±2.4 40±25 52±14 15±3.4 7.3±6.0 20±3.4 3.1±3.2 4.7±3.6 23±11 27±12 NAa NA NA
5.8–9.0 13±1.1 25±6.5 25±16 12±4.1 4.5±1.9 11±6.1 1.9±1.4 2.5±0.7 15±2.0 18±2.8 NA NA NA 4.7–5.8 7.3±0.6 5.6±4.9 8.2±13 5.8±1.9 3.1±1.1 10±6.0 1.0±0.5 1.5±1.8 7.6±0.5 8.8±1.6 NA NA NA 3.3–4.7 10±1.0 19±6.5 5.4±9.3 13±3.9 4.3±1.3 14±2.2 2.1±1.1 2.6±0.8 14±1.3 15±2.5 NA NA NA 2.1–3.3 8.1±0.5 6.3±6.1 7.6±13 10±2.1 4.7±1.0 11±3.6 2.8±1.7 3.6±1.4 13±2.6 11±3.2 NA NA NA 1.1–2.1 13±1.6 3.2±5.5 1.3±2.3 15±3.3 18±4.5 15±2.0 20±4.9 23±6.2 16±3.9 8.4±1.7 NA NA NA 0.7–1.1 15±1.4 0.1±0.1 0.0±0.0 16±5.3 30±7.1 8.3±2.3 35±4.7 35±3.2 6.6±1.6 4.5±0.4 NA NA NA 0.4–0.7 9.4±1.5 0.3±0.5 0.0±0.0 8.9±2.8 18±4.8 9.2±4.2 22±6.0 20±6.6 3.0±1.2 3.6±0.7 NA NA NA
<0.4 5.5±1.9 0.0±0.0 0.0±0.0 3.8±2.4 9.1±4.2 0.8±1.4 11±5.4 7.7±5.4 1.7±0.3 2.6±0.7 NA NA NA
Total 100 100 100 100 100 100 100 100 100 100 NA NA NA
II. Dust storm period (DS II, 24 April 2009) (a) Xi’an (N=1)
>9.0 23 NDb 23 7.0 13 18 1.4 93 21 31 31 16 0.3
5.8–9.0 21 ND 12 6.2 14 27 0.9 4.2 19 27 16 20 17
4.7–5.8 11 ND 8.1 11 8.2 20 1.7 0.2 12 11 11 11 0.3
3.3–4.7 16 ND 8.1 9.3 9.9 14 4.4 1.9 13 14 13 16 13
2.1–3.3 12 ND 7.7 12 9.1 6.3 3.2 0.0 11 11 13 9.6 12
1.1–2.1 8.2 ND 11 17 14 9.8 17 0.0 8.9 3.8 1.4 7.5 6.7
0.7–1.1 4.3 ND 12 21 14 0.0 29 1.1 7.1 2.6 11 5.4 0.3
0.4–0.7 2.7 ND 9.4 9.0 10 2.5 25 0.0 4.0 0.0 2.3 7.8 33
<0.4 2.1 ND 8.5 7.7 9.1 3.4 18 0.0 3.6 0.0 1.6 6.6 17
Total 100 ND 100 100 100 100 100 100 100 100 100 100 100
(b) Mt. Hua (N=1)
>9.0 30 ND 33 13 20 28 6.9 16 23 21 NA NA NA
5.8–9.0 20 ND 24 13 14 25 4.9 11 18 16 NA NA NA
4.7–5.8 11 ND 9.6 8.4 7.5 11 2.5 4.6 10 12 NA NA NA
3.3–4.7 16 ND 21 23 12 21 5.3 13 19 20 NA NA NA
2.1–3.3 11 ND 10 20 8.7 11 5.0 9.4 13 15 NA NA NA
1.1–2.1 6.8 ND 1.5 12 10 2.6 8.8 14 10 11 NA NA NA
0.7–1.1 2.1 ND 0.0 4.1 12 0.4 32 17 2.7 2.4 NA NA NA
0.4–0.7 1.4 ND 0.0 2.9 8.7 0.2 22 10 1.7 2.0 NA NA NA
<0.4 1.1 ND 0.0 3.2 5.7 0.0 13 5.4 0.8 1.1 NA NA NA
Total 100 ND 100 100 100 100 100 100 100 100 NA NA NA
aNA: not available due to limited materials on the sample filter;bND: not determined.
in the nonevent (Fig. 8ai, aj). The coarse mode of sulfate can be explained by an increasing input of dust, because dust par-ticles from deserts in Northwest China and Gobi region con-tain a cercon-tain amount of sulfate (Sun et al., 2010). In addi-tion, heterogeneous reaction of SO2with dust and/or uptake
of H2SO4onto dust may also be responsible for the shift
to-wards the coarse mode (Huang et al., 2012; Li et al., 2011; Sun et al., 2010; Takahashi et al., 2010; Zhang et al., 2003).
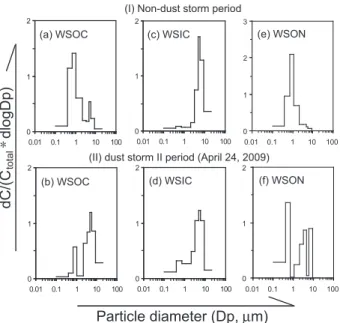
3.2.3 Size distribution of WSOC, WSIC and WSON in
Xi’an
Figure 9. Size distribution of water-soluble organic carbon (WSOC), inorganic carbon (WSIC) and organic nitrogen (WSON) in Xi’an during (I) the non-dust storm and (II) the dust storm II periods.
0 1 2
0.01 0.1 1 10 100
0 1 2
0.01 0.1 1 10 100
(a) WSOC
0 1 2
0.01 0.1 1 10 100
(b) WSOC (d) WSIC
0 1 2
0.01 0.1 1 10 100
(c) WSIC
dC/(C
dlogDp)
total
Particle diameter (Dp,µm)
(I) Non-dust storm period
(II) dust storm II period (April 24, 2009) *
0 1 2 3
0.01 0.1 1 10 100
0 1 2
0.01 0.1 1 10 100
(f) WSON (e) WSON
Fig. 9.Size distribution of water-soluble organic carbon (WSOC), inorganic carbon (WSIC) and organic nitrogen (WSON) in Xi’an during (I) the non-dust storm and (II) the dust storm periods.
from photochemical oxidation of organic gases (Agarwal et al., 2010; Ram and Sarin, 2010; Salma et al., 2007; Wang et al., 2012a; Yu et al., 2004, 2005). Moreover, biomass burning is also an important source of WSOC. Thus a ma-jor peak in the fine mode was found in Xi’an during the non-dust storm period (Fig. 9a). The small peak of coarse mode of WSOC can be explained by a nature source such as pollen and soil (Fig. 9a), because water-soluble organic compounds like glucose (Graham et al., 2002; Wang et al., 2006b, 2009, 2011a, b) and humic acid (Brooks et al., 2004; Dinar et al., 2006; Havers et al., 1998) are enriched in these sources, in addition to deposition of anthropogenic pollu-tants onto dust. During the dust storm period WSOC still displayed a bimodal pattern, but the fine mode significantly decreased while the coarse mode sharply increased as a dom-inant peak. Our previous study (Wang et al., 2012b) found that during the DS II period secondary organic aerosols in the Mt. Hua air were mostly formed from the local sources rather than being transported from the upwind region, and are of a size within the fine mode. However, during the event primary organic aerosols such as water-soluble organic com-pounds, such as glucose and trehalose and water-insoluble organic compounds like high molecular weight (HMW)n -alkanes, fatty acids and fatty alcohols, were mostly derived from biota, e.g. pollen, spore, invertebrate animals and plants in Gobi desert (Wang et al., 2012b). Those Gobi dust de-rived organic aerosols are of larger sizes and dominated in the downwind atmosphere in the event, resulting in a sharp increase in OC in the atmospheres of Mt. Hua and Mt. Tai in comparison to those in the nonevent (Wang et al., 2011c;
Wang et al., 2012b). Therefore, a large peak in the coarse fraction and a small peak in the fine fraction were observed for WSOC in Xi’an in the DS II event (Fig. 9b).
As the major species of WSIC in the atmosphere, both car-bonate (CO23−) and bicarbonate (HCO−3) ions are derived from soil and thus show a coarse mode in the nonevent (Fig. 9c). In the DS II time WSIC exhibited a bimodal pat-tern with a small peak in the fine mode and a large peak in the coarse mode (Fig. 9d). Such an increase of WSIC in the fine mode can be ascribed to an aqueous phase reaction of HNO3/H2SO4with fine calcite particles (Dunlea et al., 2009;
Leaitch et al., 2009; McNaughton et al., 2009; Sullivan et al., 2007, 2009b), which was 3.4 µg m−3in the DS II event and 10 times higher than that (0.3±0.1 µg m−3)in the nonevent. Water-soluble organic nitrogen (WSON) are a class of complex nitrogen-containing compounds such as urea, amines, amino acids, peptides and proteins, which are de-rived from urban pollution, biomass burning, dust and sea spray (Altieri et al., 2012; Cape et al., 2011; Chen and Chen, 2010; Mace et al., 2003b; Violaki and Mihalopoulos, 2011; Zhang and Anastasio, 2003). WSON concentrated in fine particles as a unimodal pattern during the nonevent with 90 % of the total mass enriched in fine mode (<2.1 µm) (Fig. 9e and Table 4), which is similar to NH+4 (Fig. 8c). When dust was present WSON exhibited a bimodal pattern with one peak in the fine mode and two peaks in the coarse mode (Fig. 9f). The coarse mode fraction accounts for 43 % of the total WSON, much more than that in the nonevent time (Table 4). Zamora et al. (2011) observed that compared to that in Barbados, WSON in Miami increased by a factor of two when Sahara dust was present, although the actual dust concentrations at both cities were almost the same. Sim-ilar results were also observed in Mediterranean (Mace et al., 2003c). The sharply enhanced WSON in Xi’an and the above documented phenomena can be explained by an in-creased deposition of volatile alkylamines onto dust parti-cles via adsorption and/or heterogeneous reaction (Mace et al., 2003a; Qiu et al., 2011). In addition, the coarse mode of WSON may also be directly originated from biological or-ganisms in Gobi dust, which contains a certain amount of WSON species (Mace et al., 2003a).
3.3 Difference in aerosol acidity between Xi’an and Mt. Hua
<0.4 0.4-0.7 0.7-1.1 1.1-2.1 2.1-3.3 3.3-4.7 4.7-5.8 5.8-9.0 >9.0 Size range, µm
0 50 100 150 200
0 50 100 150 200 0
10 20 30
0 10 20 30
y=0.9x - 2.4
R =0.992
y=0.6x + 6.3 R =0.992
(a) Fine particles, Xi’an (b) Fine particles, Mt. Hua
0 100 200 300 400
0 100 200 300 400 y= 0.8x + 0.7
R2 = 0.99
y= 0.37x - 12 R = 0.742
0 50 100 150 200 250 300 350
0 50 100 150 200 250 300 350
(c) Coarse particles, Xi’an
y = 1.1x + 15 R = 0.95
0 20 40 60 80
0 20 40 60 80
(d) Coarse particles, Mt. Hua
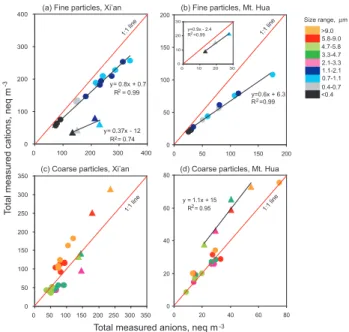
Figure 10. Acidity of size-segregated samples in Xi’an and Mt. Hua during the non-dust storm (circle points) and dust storm (April 24,2009, triangle points) periods
Total measured anions, neq m-3
Total measured cations, neq m
-3
1:1 line 1:1 line
1:1 line 2 1:1 line
Fig. 10.Acidity of size-segregated samples in Xi’an and Mt. Hua during the non-dust storm (circle symbols) and dust storm (24 April 2009, triangle symbols) periods.
inserted figure), which means fine particles in the free tropo-sphere became less acidic when dust was present. To our best knowledge, such an opposite trend of aerosol acidity between the boundary layer and free troposphere is found for the first time. We believed it is mostly caused by the difference in NO−3 production. As mentioned above, NO−3 is largely formed by oxidation of NO2with OH radical, which is much
faster than the oxidation of SO2 with OH to form SO24−
(J¨ockel et al., 2003; Rodhe et al., 1981; Seinfeld and Pandis, 1998). Atmospheric SO24−can also be produced via hetero-geneous reaction of SO2with H2O2in cloud/aqueous phase,
but the reaction rate (k=6×10⁻¹⁶cm3molecules−1s−1)is also much lower than the NO−3 production rate (k=8×
10−12cm3molecules−1s−1) (Rodhe et al., 1981). Labora-tory study (Sullivan et al., 2009b) showed that calcite, which abundantly exists in East Asian dust, can rapidly convert to Ca(NO3)2less than 3 min under 1 ppbv HNO3. Ca(NO3)2is
hydrophilic and fine particulate Ca(NO3)2can deliquescence
above∼10 % relative humidity (Tobo et al., 2010). During
the dust storm period, the fast formed Ca(NO3)2can form a
liquid film on the dust surface, which further promotes for-mation of nitric acid on the liquid phase by hydrolysis of other nitrogen oxides like N2O5(He et al., 2012; Pathak et
al., 2009) and adsorption of gaseous HNO3(Goodman et al.,
2000). Such a positive feedback resulted in a significant for-mation of NO−3 even in the dry condition of the dust storm period. In addition, gaseous ammonia is sharply decreased due to the dilution effect of the prevailing winds in the event time. Therefore, the enhanced heterogeneous formation of NO−3 and the decreased NH+4 led to the urban fine particles
more acidic in the event than in the nonevent. However, the prevailing winds in the dust storm time prevented the bound-ary layer NOx from being transported onto the mountain free
troposphere, thus NO−3 formation was depressed, resulting in the alpine fine particles becoming less acidic when dust was present. Such an increased acidity of airborne particles was also observed in other Chinese mega-cities such as Shanghai (Huang et al., 2010), Beijing and Chongqing (He et al., 2012) in the presence of dust storm.
Inorganic cations/anions ratios of the nonevent fine par-ticles are smaller in Mt. Hua than in Xi’an (0.6 vs. 0.8) (Fig. 10a,b), suggesting that fine particles in Mt. Hua dur-ing the non-dust event are more acidic, which is most likely due to increased formation of sulfate during the transport of pollutants from lowland areas to the mountain tropo-sphere. During the nonevent coarse particles showed simi-lar acidic characteristic at both sites; particles in the size of 2.1–5.8 µm are slightly acidic or neutral, but particles with a size larger than 5.8 µm are basic (Fig. 10c). On the con-trary, all the coarse particles in the mountain air were almost neutral during the nonevent and became basic when dust oc-curred (Fig. 10d). Because NO−3, SO24−, NH+4 and Ca2+are major ions of aerosols at both sites, here we compare their relative abundance to further discuss the acidity difference of aerosols between the urban ground surface and the moun-tain troposphere (Fig. 11). Equivalent ratio of NO−3/SO24−in fine particles from Xi’an was 0.51±0.13 (Fig. 11a) and 0.63
(Fig. 11c) in the nonevent and the event periods, respectively, again demonstrating an enhanced production of NO−3during the dust storm period. Although NH+4 relative to the sum of [NO−3+SO2−
4 ] decreased in the event at Mt. Hua, the
to-tal abundance of NH+4 plus Ca2+relative to [NO−3+SO2−
4 ]
increased in the event (Fig. 11c), being opposite to those in Xi’an. During ageing process NH4NO3 can be
evapo-rated into the air and decomposed as NH3and HNO3, while
NH4HSO4 and (NH4)2SO4 are chemically stable and
en-riched in fine particles. The gaseous HNO3further react with
coarse particle and enhances the coarse fractions of NO−3 and Ca2+in the non-dust period (Fig. 11b and Table 4). Such a significant segregation of nitrate from sulfate was also ob-served in the outflow region of East Asia (Sullivian et al., 2007). Nitrate is formed at a faster rate than sulfate and long-range transport of nitrate is less pronounced than that of sul-fate. Therefore, NO−3/SO24− in the coarse mode was lower when dust storm occurred especially in the mountainous area (Fig. 11d). NH+4, NO−3 and SO24− are the three major ions in fine particle. As shown in Fig. 12, the equivalent ratio of [NO−3+HSO2−
4 ] to NH +
4 is close to unity, thus it seems
plausible that ammonium in the nonevent existed mainly as NH4NO3 and NH4HSO4 rather than (NH4)2SO4. As
SO4
2-NO3- Ca2+
NO3-+SO4
2-NH4+
NO3-+SO4
2-0.0 0.2 0.4 0.6 0.8 1.0 1.2
1.4 (a) Non-dust storm, Fine particles
Xi’an Mt. Hua
0.0 0.2 0.4 0.6 0.8 1.0 1.2
1.4 (b) Non-dust storm, Coarse particles
Xi’an Mt. Hua
0.0 0.2 0.4 0.6 0.8 1.0 1.2
1.4 (c) Dust storm, Fine particles
Xi’an Mt. Hua
0 0.2 0.4 0.6 0.8 1.2
1.4 (d) Dust storm, Coarse particles
Xi’an Mt. Hua 1.0
SO2-4
NO3- Ca2+
NO3-+SO2-4
NH4+
NO3-+SO2-4
Equivalent ratio, neq m / neq m
-3
-3
Figure 11. Equivalent ratios of major inorganic ions in fine (<2.1µm) and coarse (>2.1 µm) particles
from Xi’an and Mt. Hua during (a,b) non-dust storm and (c,d) dust storm (April 24, 2009) periods
Fig. 11.Equivalent ratios of major inorganic ions in fine (<2.1µm)
and coarse (>2.1 µm) particles from Xi’an and Mt. Hua during(a,
b)non-dust storm and(c, d)dust storm (24 April 2009, DS II)
pe-riods.
between the nonevent and the event occurred only in the fine mode.
4 Summary and conclusion
Springtime PM10 and size-segregated samples collected in
Xi’an were determined for EC, OC, WSOC, WSON and in-organic ions, and compared with those simultaneously mea-sured on the mountaintop of Mt. Tai. Particle mass (PM), EC, OC and inorganic ions in Xi’an were 1.8–22 times higher than those in the Mt. Hua air during the non-dust storm pe-riod and 1.2–9.2 times higher than those in the mountainous air during the DS II period. High levels of WSON were found in the DS II samples, due to the deposition of anthropogenic WSON onto dust and/or an input of biological organism in Gobi desert dust. Since many known WSON components are highly toxic to humans, a future research on their sources and formation mechanisms is necessary. Compared with those in Xi’an during the nonevent aerosols in the mountaintop free troposphere contains more sulfate and less nitrate, which is due to continuous formation of sulfate during aerosol trans-port. In the nonevent time sulfate was the most abundant species in aerosols from Xi’an and Mt. Hua, followed by ni-trate, OC and ammonium. On the contrary, OC became the highest in the event at both sites, followed by SO24−, Ca2+ and NO−3, indicating the importance of input of biota in Gobi desert.
In the nonevent time PM showed a similar size distribu-tion between the urban boundary layer and the mountain free troposphere with two equivalent peaks in the fine and coarse modes. In contrast, PM became a unimodal pattern in both re-gions in the DS II period, dominating in coarse mode. NH+4, K+, Mg2+, Ca2+, Na2+in Xi’an exhibited similar size dis-tribution patterns to those in the mountain air. Cl−and NO−3
Figure 12. Linear fit regression for ions in fine particles (< 2.1 µm) during the non-dust storm (circle points) and dust storm (April 24, 2009, triangle points) periods in Xi’an
NO + SO , neq m
3
2 4
_
-3
_
NH , nequ m4+ -3
NO + HSO , neq m
3
_ 4
_
-3
<0.4 0.4-0.7 0.7-1.1 1.1-2.1 Size range, µm
0 50 100 150 200 250
0 50 100 150 200 250
y = 0.9x + 5.9 R = 0.982
0 50 100 150 200 250 300 350
0 50 100 150 200 250 300 350 y = 1.4x + 8.7
2 R = 0.97
(b)
(a)
Fig. 12.Linear fit regression for ions in fine particles (<2.1 µm) during the non-dust storm (circle symbols) and dust storm (24 April 2009, triangle symbols) periods in Xi’an.
showed a bimodal pattern on the ground surface and shifted onto large particles in the mountain troposphere during the nonevent period. Such a redistribution was significantly en-hanced when dust occurred, resulting in Cl− and NO−3 al-most entirely staying in the coarse mode in the mountain air. Compared to those in the nonevent fine particles in the event became more acidic in the urban air and less acidic in the mountain troposphere. The increased acidity in Xi’an is largely ascribed to an enhanced heterogeneous formation of NO−3 and a decreased level of NH3caused by a dilution
effect of the prevailing northerly winds in the DS II time. However, such a NO−3 formation was depressed in the moun-tain air in the event, because the prevailing northerly winds prohibited NOxfrom being transported from ground surface
to the mountain atmosphere.
Acknowledgements. We thank the three anonymous referees for their comments and suggestion, which are very helpful for improving our paper quality. This work was financially supported by the “Strategic Priority Research Program” of the Chinese Academy of Sciences (Grant No. XDA05100103, XDB05020401) and the Knowledge Innovation Program of Chinese Academy of Sciences (No. KZCX2-YW-148) of Chinese Academy of Sciences.
References
Agarwal, S., Aggarwal, S. G., Okuzawa, K., and Kawamura, K.: Size distributions of dicarboxylic acids, ketoacids, a-dicarbonyls, sugars, WSOC, OC, EC and inorganic ions in atmospheric par-ticles over Northern Japan: implication for long-range transport of Siberian biomass burning and East Asian polluted aerosols, Atmos. Chem. Phys., 10, 5839–5858, doi:10.5194/acp-10-5839-2010, 2010.
Altieri, K. E., Hastings, M. G., Peters, A. J., and Sigman, D. M.: Molecular characterization of water soluble organic nitrogen in marine rainwater by ultra-high resolution electrospray ioniza-tion mass spectrometry, Atmos. Chem. Phys., 12, 3557–3571, doi:10.5194/acp-12-3557-2012, 2012.
Andreae, M. O., Andreae, T. W., Annegarn, H., Beer, J., Cachier, H., leCanut, P., Elbert, W., Maenhaut, W., Salma, I., Wienhold, F. G., and Zenker, T.: Airborne studies of aerosol emissions from savanna fires in southern Africa: 2. Aerosol chemical composi-tion, J. Geophys. Res., 103, 32119–32128, 1998.
Arimoto, R., Zhang, X. Y., Huebert, B. J., Kang, C. H., Savoie, D. L., Prospero, J. M., Sage, S. K., Schloesslin, C. A., Khaing, H. M., and Oh, S. N.: Chemical composition of atmospheric aerosols from Zhenbeitai, China, and Gosan, South Korea, during ACE-Asia, J. Geophys. Res.-Atmos., 109, D19S04, doi:10.1029/2003JD004323, 2004.
Arimoto, R., Kim, Y. J., Kim, Y. P., Quinn, P. K., Bates, T. S., An-derson, T. L., Gong, S., Uno, I., Chin, M., Huebert, B. J., Clarke, A. D., Shinozuka, Y., Weber, R. J., Anderson, J. R., Guazzotti, S. A., Sullivan, R. C., Sodeman, D. A., Prather, K. A., and Sokolik, I. N.: Characterization of Asian Dust during ACE-Asia, Global Planet. Change, 52, 23–56, 2006.
Brooks, S. D., DeMott, P. J., and Kreidenweis, S. M.: Water uptake by particles containing humic materials and mixtures of humic materials with ammonium sulfate, Atmos. Environ., 38, 1859– 1868, 2004.
Cape, J. N., Cornell, S. E., Jickells, T. D., and Nemitz, E.: Organic nitrogen in the atmosphere — Where does it come from? A re-view of sources and methods, Atmos. Res., 102, 30–48, 2011. Chen, H. Y. and Chen, L. D.: Occurrence of water soluble organic
nitrogen in aerosols at a coastal area, J. Atmos. Chem., 65, 49– 71, 2010.
Chow, J. C., Watson, J. G., Chen, L.-W. A., Arnott, W. P., Moos-muller, H., and Fung, K. K.: Equivalence of elemental carbon by thermal/optical reflectance and transmittance with different tem-perature protocols, Environ. Sci. Technol., 38, 4414–4422, 2004. Chow, J. C., Watson, J. G., Chen, L.-W. A., Chang, M. C. O., Robin-son, N. F., Trimble, D., and Kohl, S.: The IMPROVE temperature protocol for thermal/optical carbon analysis: maintaining consis-tency with a long-term database, J. Air Waste Manage. Assoc., 57, 1014–1023, 2007.
Dan, M., Zhuang, G., Li, X., Tao, H., and Zhuang, Y.: The charac-teristics of carbonaceous species and their sources in PM2.5 in Beijng, Atmos. Environ., 38, 3443–3452, 2004.
Dillner, A. M., Schauer, J. J., Zhang, Y., Zeng, L., and Cass, G. R.: Size-resolved particulate matter composition in Beijing dur-ing pollution and dust events, J. Geophys. Res., 111, D05203, doi:10.1029/2005JD006400, 2006.
Dinar, E., Mentel, T. F., and Rudich, Y.: The density of humic acids and humic like substances (HULIS) from fresh and aged wood burning and pollution aerosol particles, Atmos. Chem. Phys., 6,
5213–5224, doi:10.5194/acp-6-5213-2006, 2006.
Dunlea, E. J., DeCarlo, P. F., Aiken, A. C., Kimmel, J. R., Peltier, R. E., Weber, R. J., Tomlinson, J., Collins, D. R., Shinozuka, Y., McNaughton, C. S., Howell, S. G., Clarke, A. D., Emmons, L. K., Apel, E. C., Pfister, G. G., van Donkelaar, A., Martin, R. V., Millet, D. B., Heald, C. L., and Jimenez, J. L.: Evolution of Asian aerosols during transpacific transport in INTEX-B, At-mos. Chem. Phys., 9, 7257–7287, doi:10.5194/acp-9-7257-2009, 2009.
Formenti, P., Sch¨utz, L., Balkanski, Y., Desboeufs, K., Ebert, M., Kandler, K., Petzold, A., Scheuvens, D., Weinbruch, S., and Zhang, D.: Recent progress in understanding physical and chem-ical properties of African and Asian mineral dust, Atmos. Chem. Phys., 11, 8231–8256, doi:10.5194/acp-11-8231-2011, 2011. Geng, H., Park, Y., Hwang, H., Kang, S., and Ro, C.-U.: Elevated
nitrogen-containing particles observed in Asian dust aerosol samples collected at the marine boundary layer of the Bohai Sea and the Yellow Sea, Atmos. Chem. Phys., 9, 6933–6947, doi:10.5194/acp-9-6933-2009, 2009.
Goodman, A. L., Underwood, G. M., and Grassian, V. H.: A labora-tory study of the heterogeneous reaction of nitric acid on calcium carbonate particles, J. Geophys. Res., 105, 29053–29064, 2000. Graham, B., Mayol-Bracero, O. L., Guyon, P., Roberts, G. C.,
Decesari, S., Facchini, M. C., Artaxo, P., Maenhaut, W., Koll, P., and Andreae, M. O.: Water-soluble organic compounds in biomass burning aerosols over Amazonia – 1. Characterization by NMR and GC-MS, J. Geophys. Res.-Atmos., 107, 8047, doi:10.1029/2001JD000336, 2002.
Griffin, D., Kellogg, C., and Shinn, E.: Dust in the Wind: Long Range Transport of Dust in the Atmosphere and Its Implications for Global Public and Ecosystem Health, Global Change & Hu-man Health, 2, 20–33, 2001.
Hand, J. L., Malm, W. C., Laskin, A., Day, D., Lee, T., Wang, C., Carrico, C., Carrillo, J., Cowin, J. P., Collett Jr., J., and Iedema, M. J.: Optical, physical, and chemical proper-ties of tar balls observed during the Yosemite Aerosol Char-acterization Study, J. Geophys. Res.-Atmos., 110, D21210, doi:10.1029/2004JD005728, 2005.
Havers, N., Burba, P., Lambert, J., and Klockow, D.: Characterisa-tion of humic-like substances in airborne particulate matter, J. Atmos. Chem., 29, 45–54, 1998.
He, K., Zhao, Q., Ma, Y., Duan, F., Yang, F., Shi, Z., and Chen, G.:
Spatial and seasonal variability of PM2.5acidity at two Chinese
megacities: insights into the formation of secondary inorganic aerosols, Atmos. Chem. Phys., 12, 1377–1395, doi:10.5194/acp-12-1377-2012, 2012.
Herner, J. D., Ying, Q., Aw, J., Gao, O., Chang, D. P. Y., and Klee-man, M. J.: Dominant mechanism that shape the airborne particle size and composition distribution in central California, Aerosol Sci. Technol., 40, 827–844, 2006.
Hinds, W. C.: Aerosol Technology: Properties, behavior, and mea-surement of airborne particles, John Willy & Sons, New York, 1999.