Journal of Engineering Science and Technology Review 9 (2) (2016) 31-38
Research Article
A Markov Random Field Model for Image Segmentation of Rice Planthopper in Rice
Fields
Hongwei Yue1, Ken Cai2,*, Hanhui Lin3, Hong Man1 and Zhaofeng Zeng4
1School of Information Engineering, Wuyi University, Jiangmen, China
2School of Information Science and Technology, Zhongkai University of Agriculture and Engineering, Guangzhou, China 3
Center for Educational Technology, Guangdong University of Finance and Economics, Guangzhou, China
4
Department of Mathematics and Computer Science, California State University, East Bay, U.S.A.
___________________________________________________________________________________________
Abstract
It is meaningful to develop the automation segmentation of rice planthopper pests based on imaging technology in precision agriculture. However, rice planthopper images affected by light and complicated backgrounds in open rice fields make the segmentation difficult. This study proposed a segmentation approach of rice planthopper images based on the Markov random field to conduct effective segmentation. First, fractional order differential was introduced into the extraction process of image texture features to gain complete texture information of rice planthopper images. Observation data modeling was established by a combination of image color features and texture features to overcome the disadvantages of insufficient image texture information. Finally, the improved potential function models, the neighborhood relationship between the pixel labels, and the attributes of pixels were defined. The segmentation results were assessed by quantitative evaluation. The experiments showed that the proposed improved approach in the study was more robust, especially with the changes in the illumination condition. This approach can effectively improve segmentation accuracy and promote vision segmentation results of rice planthopper images.
Keywords:Rice Planthopper Pests, Fractional Order Differential,Markov Random Field, Image Segmentation
__________________________________________________________________________________________
1. Introduction
Rice planthopper is an insect with widespread distribution worldwide; its exclusively plant-based diet causes more harm than good for humans. Several species are pests that endanger agricultural and forest plants; these pests can cause heavy economic loss because of the widespread range of damage [1], [2], [3]. The brown planthopper (Nilaparvata lugens), whiteback planthopper (Sogatella furcifera), and small brown planthopper (Laodelphax striatellus) are collectively referred to as rice planthopper, which are the chief rice pests. These insect pests occurred frequently during the 1990s in Zhejiang Province and caused great yield loss in the Zhejiang, Jiangsu, and Shandong Provinces of east China [4]. In 2008, more than 267,000 hectares of rice fields were infested by the rice planthopper in Jiangsu Province [5]. Furthermore, the maize rough dwarf disease and dwarfing disease occurred in cereal crops, and Gramineae weeds might also be infected [6]. Moreover, the disease has been found in some areas of Japan [7]. Since the 1990s, the rice planthopper has risen as a main threat to rice production because high-yielding hybrid rice was widely released in China, and its population has been strongly exacerbated by the misuse of pesticides.
Given their tiny shape and similar forms, rice planthoppers are easily confused with each other. The identification of rice planthopper requires professional classification by researchers on the retrieval table to
determine the type. This method of identification has low-efficiency and depends more on experts, which affects the accuracy and efficiency of the rice planthopper identification. The current published literature on rice planthopper diagnosis mainly focused on the relationship between the ecological environment and the growth of rice planthopper, as well as forecasting the scale of rice planthopper outbreaks [2], [8].
Although image segmentation is an extremely important component in the field of artificial intelligence, image-based research on rice planthopper pests may be a quick and efficient approach. However, the literature on segmentation, with the recognition of rice planthopper as the research object, is still rare.
2. State of the Art
Given the improvement of computer hardware and software, as well as machine vision technology, the use of computer vision to achieve automatic diagnosis of rice planthopper infection has become a novel development in precision agriculture. Zou et al. [9] designed a recognition system to count the rice planthoppers trapped by a lamp on a white cloth. Park et al. [10] photographed brown planthoppers in paddy fields with a camera and used some image-processing methods to count pests on rice plants. Martin et al. [11] proposed a vision sensor network for detecting whiteflies and aphids based on visual cues such as size, shape, and color to reduce the amount of pesticides used in crops. Vision sensors were also used to count whiteflies by principal component analysis and mixture-of-Gaussians method. Huddar et al. [12] proposed a method that can
J
estr
JOURNAL OF Engineering Science andTechnology Review
www.jestr.org
______________
* E-mail address: [email protected]
segment insects in greenhouses and open farms based on the relative difference in pixel intensities. The method of object extraction proposed by Pokharkar [13] comprised of a sequence of operations, such as background subtraction, filtering (Gaussian blur and Laplacian), and segmentation.
Despite these efforts, the methods proposed in the literature still cannot deal with several challenges involved in segmenting rice planthoppers. Consequently, the use of the abovementioned methods is limited to specific conditions.
Machine vision technology in agricultural research started relatively late to achieve high efficiency. The high-precision segmentation algorithm is a hot research problem to realize automatic identification. Our study aimed to find a suitable method of rice planthopper segmentation to eliminate the irrelevant information in images and enhance the detection of relevant information and maximally simplify data. In the statistical model based on object segmentation, an object is assumed to be a realization of a random process, which is governed by the model parameters. Object features obtained from these methods, especially Markov random field (MRF), have been proven to offer a powerful framework for image segmentation. MRFs were been introduced by Besag [14] via their pseudo-likelihood approximation. The Gibbs distribution inherent to MRFs was then exploited. Since this pioneer work, MRFs have been actively used in the image-processing community for modeling spatial correlations. Examples of applications include the segmentation of SAR or brain magnetic resonance images [15], [16]. Other interesting works involving MRFs for segmentation and classification have been published [17], [18], [19].
As a widely used approach in image segmentation, MRF theory provides a convenient and consistent modeling method to describe the constraint relations between the image adjacent pixels [20], [21], [22]. The first problem for MRF image segmentation that needs to be solved is to extract one (or some) characteristic value of a characterization texture attribute to establish the MRF characteristic field model. Given that the MRF model based on image color information considers only the context relation between the pixel and its neighborhood pixels, the model lacks a description of overall image texture information. Thus, the ideal effect cannot be achieved while performing segmentation of rice planthopper image.
To overcome this problem, this paper proposes a suitable segmentation method for rice planthopper images collected in open rice fields. The sensitivity to the image detail information was used to extract image texture detail and edge contour information, and the fractional order differential operation was introduced in the extraction of image texture features. The texture information was combined with the color features of the image for the defects of the traditional MRF algorithm with insufficient description for image texture information.
This paper is organized as follows. Section 3 presents an overview of the fractional order differential and MRF. Subsequently, the proposed segmentation scheme for rice planthopper images with heterogeneous textures is described. Section 4 presents the experimental results, and conclusions are summarized in Section 5.
3. Methodology
3.1 Rice Planthopper Image Acquisition in Rice Paddies Under an open-field environment, the system hardware consists of a white curtain as background, a light source, an
imaging device, and communication equipment, among others. The light source device is chosen based on the phototaxis of rice planthoppers (i.e., yellow and green). According to their preferences, self-ballasted (high-pressure) fluorescent mercury lamps are used as a background light source to trap the insects. An acquisition system of the rice planthopper image is presented in Figure 1.
Fig.1. Acquisition system of rice planthopper image
3.2 Fractional Order Differential and Texture Feature Extraction
In this paper, the feature field model was adopted for segmentation of collected agricultural rice planthopper images; this model combines image color with texture features. The first priority is to complete texture feature extraction of the rice planthopper image. The fractional order differential operation is generated by an integer order differential operation. As a general form of the integer order differential, this operation retains the enhancement effect of differential operation on high-frequency signals. However, unlike the integer order differential, its low-frequency component was not weakened, but nonlinear retention was achieved when the signal comes through the fractional order differential filtering. The introduction of fractional order differential filtering into the extraction of texture features can effectively obtain image texture detail and edge contour information, thereby improving the segmentation results of the texture image. The fractional order differential is also called a non-integer order differential. Several scientists have made different attempts with different approaches to obtain different definitions of fractional calculus, including the Caputo definition, Grunwald–Lentikov (G-L) definition, and the Riemann–Liouville (R-L) definition. These definitions are all common forms of the definition in time domain. The G-L definition is more accurate for achieving the signal value. Therefore, the said definition is adopted in this paper for our research.
According to the definition of an integral derivative of a continuous function, the fractional order differential definition of G-L was obtained to provide a novel theoretical foundation for the development of integer order calculus.
) ( ) 1 (
) 1 ( ) 1 ( 1 lim ) (
0
0 v m f t hm
v
H t f D
h a t
m m v
h v t G
a −
+ − Γ
+ Γ −
=
∑
−
=
33
Among these values, the function
)! 1 ( )
( 1
0
−
= =
Γn
∫
∞e−ttn−dt n , if the continuity interval ofsignal f(t) is t∈[a,t]. By equally dividing the continuity interval [a,t] according to the unit h=1, the differential expression of the fractional order differential signal is deduced as
) ( ) 1 ( !
) 1 (
) 2 ( 2
) 1 )( ( ) 1 ( ) ( ) ( ) (
n t f v n n
v
t f v v t
f v t f dt
t f d
v v
− − + Γ
− Γ +
+ − − − + − − + ≈
!
(2)
Let the two-dimensional rice planthopper image f be N
M× , and the formula of linear filtering by a mask filter of
size m×n is
∑ ∑
−
= =−
+ + =
a
a s
b
b t
t y s x f t s w y
x
g( , ) ( , ) ( , ) (3)
where a=(m−1)/2 , b=(n−1)/2 are the radius on the
x ,y axis of the fractional differential operator template,
respectively. Let x=0,1,!,M−1 and y=0,1,!,N−1, and an image after filtering processing can be obtained.
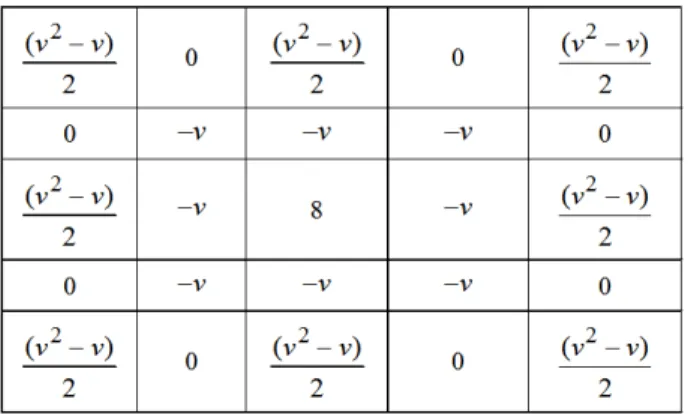
Let x∈[x1,x2], y∈[y1,y2] be the duration of x , y , respectively, in a two-dimensional digital image signal. For a digital image, the scale of the fractional order differential mask reaches the scale of the image itself, which is also the biggest approximation for the analytic value of the fractional order differential. To achieve the filter and concurrently minimize error, the first three terms of the definition of the fractional order differential are selected. A fractional order differential mask of size 5×5 is selected to construct an isotropous filter. Eight neighborhood regions of the center pixel are selected to establish an isotropous filter. The fractional order differential cover w(s,t) is shown in Figure
2; this term is called the Tiansi operator.
Fig. 2. Fractional differential mask operator
The abovementioned fraction differential mask operators possess rotation isotonicity. After normalized processing for filtering operations on the image, the output image can preserve gray flat areas of the primary image. Simultaneously, the texture details and edge contour of the original gray image, which drastically changed, have been
greatly enhanced. The resulting f0 acts as a set of texture
characteristic values to reflect the image texture details and edge contour information. The fractional differential operator order is continuous and adjustable. The selection of different orders has some effect on the results of image filter processing. When the fractional differential order is too small, the overall effect is very weak but details of the image can be preserved. With the increasing order, the enhancement effect on the image detail texture and edge contour becomes more apparent. However, if the order is too large, noise can be introduced. Theoretically, fractional differential order can achieve the best effect of enhancing the rice planthopper image within the scope of [0.4,0.6]. In this paper, the fractional differential order is 0.5.
3.3 Rice Planthopper Image Segmentation Based on MRF
Recently, the MRF approach has been widely used in precision agriculture because of its good segmentation results and theoretical basis. Image segmentation can be seen as a category mark question, namely, the process of marking each pixel as the target or background according to the pixel attributes and neighboring domain attributes. Each pixel in the MRF can be interconnected by the neighborhood system. Therefore, the prior knowledge of the MRF and neighborhood correlation can effectively achieve the segmentation of rice planthopper pest.
3.3.1 MRF Model
Let an input image Ω={ϖi|i=1,2,!,M×N} . M×N
represents the size of the pest image f . The label field }
, , 2 , 1 |
{x i M N
X = i = ! × . X represents the set of all
possible label fields. Y={yi|i=1,2,!,M×N}is observation
data (or the characteristics of observation image), namely, observation field. The purpose of this paper is to determine
the optimal label of observation data (presented by xopt).
According to the maximum a posteriori criterion (MAP),
) | ( max arg P X Y
xopt= (4)
where P(X|Y) represents the posterior probability of the label field X under the condition of observation data Y . According to Bayes’ formula, the posterior probability
) | (X Y
P can be obtained from the following formula:
) ( ) | ( ) |
(X Y PY X P X
P ∝ (5)
By combining Equations (5) and (4),
)] ( log ) | ( log min[ arg ) | ( max
arg P X Y PY X P X
xopt∝ ∝ − − (6)
where P(Y|X) is the likelihood function of observation data; P(X) is the prior distribution of label field. Therefore, the key terms of Equation (4) are P(Y|X) and P(X).
3.3.2 Observation Data Modeling
of color features alone cannot express the complexity of the image. The description of the image edge information can effectively compensate for the inadequate color features. This paper fuses the edge contour features and the RGB space color features to represent observation image data as
} , , , {RG B f0
ys= (7)
We assumed that each dimension or features of rice planthopper and its background obey a Gaussian distribution with different average values and variance. For a certain category, its dimensional feature distribution is unimodal; thus, the Gaussian distribution is used to imitate its actual distribution: ] ) ( 2 ) ( exp[ 2 1 ) | ( 2 2 k m k m k i k m i k i y m x y P σ µ σ π − − =
= (8)
where m∈Λ={1,2,!,L} represents a label category
(m∈Λ={1,2}, among which 1 represents rice planthopper and 2 represents background). k∈1,2,3,4 represents the
k-dimension feature; µmk and k m
σ are respectively the average
value and variance of the k-dimension feature of the m category. We assume that each feature is independent with each other, and the probability distribution of observation data is ) | ( ) |
(y x m 41P y x m
P ik i= =Πk= ik i= (9)
3.3.3 Prior Model
The elements of the location set S exert their influence via a neighboring domain system, which is defined in Figure 3. For the prior probability P(X) of the label field, the second-order neighborhood system (eight-neighborhood domain) is adopted to describe its spatial relationship to the label field model. According to the equivalence property of Gibbs’s distribution and MRF,
)) ( 1 exp( )
( 1 U X
T Z
X
P = − − (10)
where Z=
∑
exp(−U(X)) is a normalization constant. Theenergy function Uis defined as
∑
=
= 8
1 (,j) )
(
j vi X
U .
Fig.3. Neighborhood system
General potential function models consider only the neighborhood relationship between the pixel labels but ignore the attributes of the relationship between pixels, thereby often causing error markers [23]. The potential function is defined as
) , ( ) ) ( 1 1 exp( ) , (
2 i j e e d j i v j i RGB δ β − + + −
= (11)
In the abovementioned formula, exp() represents the attribute variance between neighborhood pixels, namely, the
variance of color scale and the marginal value; β is the parameter of potential function; dRGB is the distance between pixel points i,j in the RGB space; ei and ej
represent the marginal values at the pixel locations i and j, respectively, which can be gained in the edge detection of original image. Among these values, i represents the center pixel point, whereas j is the pixel point in the neighborhood domain of i. The function δ(i,j) is defined as ⎪⎩ ⎪ ⎨ ⎧ ≠ = − = j i j i x x x x j i , 1 , 1 ) , (
δ (12)
Clearly, if the distance of the color scale and the gradient are larger, the energy between two pixels is greater, whereas the probability of their being in same category is lower. According to Equation (11), prior distribution can be represented as: ) ) ( 1 ) , ( exp( ) | ( 2
∑
− + + − = j i RGB j i e e d j i x xP β δ (13)
3.3.4 Parameter Estimation
For the established MRF model, the feature vectors are
} , {µσ
λ= , mk =
∑
ymk N1
µ , 2
1 2 ] ) ( 1 1 [
∑
− −= km mk
k
m y
N µ
σ ,
where N represents the number of pixels belong to label m
and ykm is the k-dimension feature value of pixels labeled as m.
The expectation maximization algorithm (EM) is used to complete the unsupervised segmentation of color images. The EM algorithm is a general method for finding the maximum likelihood estimation in incomplete data sets. In this paper, the EM algorithm is applied to estimate the variance and expectation model. The algorithm is divided into two steps: the E step and the M step. The specific algorithm steps are as follows:
(1) Initialize clustering number L (simply distinguish the target from the background and assume L=2).
(2) Use the K-means algorithm for the initial segmentation to determine each initial average and variance, as well as initial segmentation results.
E step: Calculate the conditional expectation:
∑
++ = =
x
t
t E P y x P x y Px y
Q(λ 1|λ') (log ( | ,λ')) [ln (( , )|λ) ( | ,λ 1)].
M step: Calculate λt+1=argmaxQ(λt+1|λ') then replace parameter t+1
λ with λ' and update λ={µ,σ}; both steps are repeated until the algorithm converges.
3.3.5 Segmentation Algorithm Process
In the algorithm, the iteration method is adopted to calculate the model for improving the segmentation algorithm performance. During iteration, parameters should be modified, and results are constantly tagged until the condition is met. Based on the abovementioned analysis, the proposed algorithm can be outlined as follows:
1 1 1
1 x 1
35
(1) Input the original image of rice planthopper pests to solve for the feature vector, namely the observation data information.
(2) Adopt the K-means algorithm for initial segmentation of rice planthopper images, with β=0.5.
(3) Conduct the E step of the EM algorithm to estimate model parameters.
(4) Conduct the M step of the EM algorithm to gain the segmentation results.
(5) Update parameters at each iteration.
(6) Determine whether the maximum number of iterations is achieved; if not, then return to step 3; if so, then end.
3.4 Segmentation Quality Quantitative Evaluation Standards
To evaluate the segmentation accuracy of rice planthopper pests, this paper adopts the normalized probabilistic Rand (NPR) index, the global consistency error (GCE) index, and the variation of information (VOI) index for segmentation algorithm evaluation. The clustering S is a partition of a set of points or a data set D with mutually disjoint subsets
1
S , ..., Sk , which are called clusters. Formally,
} , , ,
{S1 S2 SK
S= ! such that Sl∩Sk=∅ and Sk D
K
k =
∪
=1
.
Let the number of data points in D and cluster Sk be n and
k
n , respectively, such that
∑
= = K k k n n 1
. That is, K represents
the number of non-empty clusters. Let a test segmentation of the same data set D be { 1 , , ktest' }
test test S S
S = ! , with a cluster
size of nk''. Note that the two clusterings may have a
different number of clusters.
NPR counts the fraction of pairs of pixels whose labeling is consistent between the computed segmentation and the ground truth segmentations. For any pair of pixels xi and
j
x , the labels of those pixels Stest i
l and Stest
j
l are the same in
the test segmentation if the labels Sk i
l and Sk
j
l are the same
in the ground truth segmentations, and vice versa. Inconsistencies between the test and ground truth by relationships are also proportionally penalized. These requirements lead to the NPR index:
∑
< − ≠ + = = j i j i ij S j S i ij S j S i ktest S N l l p l l p
S
PR test test test test
, )] 1 )( ( ) ( [ ) 2 ( 1 }) { ,
( φ φ (14)
where N is the number of pixels. Let ( test Stest) j S i ij l l c =φ =
and pij be the ground truth probability, such that
∑
==1 ( k Sk) j S i
ij l l
k
p φ , which is the mean pixel pair
relationship among the ground truth images. The NPR index can be written as
∑
< − − + = j i j i ij ij ij ij ktest S N c p c p
S PR , )] 1 )( 1 ( [ ) 2 ( 1 }) { ,
( (15)
GCE measures the extent that one segmentation can be viewed as a refinement of the other [24]. Related segmentations are considered consistent because they could represent the same image segmented at different scales. Segmentation is simply a division of the pixels of an image into sets. The segments are sets of pixels. If one segment is a proper subset of the other, then the pixel lies in an area of refinement, and the error should be zero. When a subset relationship is absent, the two regions overlap in an inconsistent manner. The formula for GCE is
} ) , , ( , ) , , ( min{ 1
∑
∑
= i i test i itest p ES S p
S S E n
GCE (16)
The VOI metric defines the distance between two segmentations as the average conditional entropy of one segmentation given the other, thereby roughly measuring the amount of randomness in one segmentation, which cannot be explained by the other.
) , ( 2 ) ( ) ( ) ,
(S Stest H S H Stest I S Stest
VI = + − (17)
where H and I represent the entropies and the mutual information between the two clusterings, respectively; and
∑∑
= = = K k K k test k P k P k k P k k P S S I 1 ' 1 ' ( ) '( ') ) ' , ( log ) ' , ( ) ,( . The uncertainty is
equal to the entropy of this random
variable: ( ) ( )log ( )
1 k P k P S H K k
∑
= − = , n n k P( )= k.4. Results
4.1 Comparison with Other Segmentation Methods
Fig.4. Image segmentation results of different methods. (a) Original image. (b) Segmentation standard. (c) OTSU method. (d) FCM method. (e) Traditional MRF method. (f) The proposed method.
Fig.5. Image segmentation results of different methods. (a) Original image. (b) Segmentation standard. (c) OTSU method. (d) FCM method. (e)
Traditional MRF method. (f) The proposed method.
The abovementioned segmentation results of the OTSU method and the FCM segmentation algorithm only use gray information but do not describe the pixel space information. Consequently, these methods cannot achieve the ideal effect for texture region segmentation of some local areas with apparent gray differences. The MRF segmentation method with color features is introduced to describe the context constraint between adjacent pixels of image, thereby
improving the texture segmentation. The effect of image segmentation depends on the color values to a certain extent. For instance, Figure 5(e) did not extract the small rice planthopper area.
37
details. The figures show that the proposed method can obtain good segmentation effects and solve the segmentation problem of rice planthopper under an open-field environment.
4.2 Objective Evaluation Index
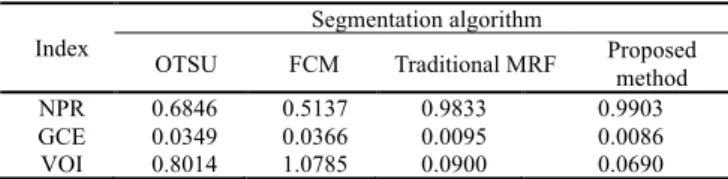
Tables 1 and 2 present a quantitative evaluation of the segmentation results of Figures 4(a) and 5(a), respectively. The NPR index selects a value in the interval [0,1]. A score of 0 indicates that each pixel pair in the test image has an opposite relationship as every pair in the ground truth segmentations, whereas a score of 1 indicates that each pixel pair in the test image has the same relationship as every pair in the ground truth segmentations. The GCE index produces really valuable output in the range of [0,1], where zero signifies no error. The VOI metric is nonnegative, with lower values indicating greater similarity. A comparison of Tables 1 and 2 shows that the uneven illumination, background, and texture cause several errors in areas similar to the rice planthopper color. The results illustrate that the OTSU method and FCM method with gray information can achieve lower segmentation performance. The proposed method and traditional MRF method achieved good results because the MRF model can better describe image features within a probabilistic framework. In addition, the combination of complementary color features with texture characteristics by the proposed algorithm can better describe the complexities of the acquisition environment of rice field; thus, the algorithm has better overall segmentation performance compared with the MRF algorithm.
Based on Figures 4 and 5, as well as Tables 1 and 2, the introduction of texture information characteristics can greatly improve algorithm performance because a single feature cannot fully express the complexities of the acquisition environment of rice fields. The use of color and edge contour information is complementary and can better express complex scenes. For example, the rice planthopper pests and their background may have a similar color; thus, the use of color features alone cannot properly label the rice planthopper and its background.
Table 1. Image segmentation quantitative evaluation of Fig. 4
Index
Segmentation algorithm
OTSU FCM Traditional MRF Proposed method
NPR 0.6846 0.5137 0.9833 0.9903
GCE 0.0349 0.0366 0.0095 0.0086
VOI 0.8014 1.0785 0.0900 0.0690
Table 2. Image segmentation quantitative evaluation of Fig.
5
Index
Segmentation algorithm
OTSU FCM Traditional MRF Proposed method
NPR 0.6954 0.5128 0.9721 0.9819
GCE 0.0493 0.0530 0.0141 0.0124
VOI 0.8152 1.1131 0.1350 0.1007
5 Conclusion
The collected images of rice planthopper are more easily affected by noise under field conditions; thus, a large number of false segmentations may occur. To obtain complete segmentation of rice planthopper images with field acquisition characteristics, the fractional order differential was analyzed and the MRF method based on multiple-feature fusion was proposed to achieve automation segmentation. The following conclusions were reached: 1) MRF segmentation with color features can obtain better segmentation results than certain image segmentation methods that only have gray information. For under an open-field environment, the collected images for background and rice planthopper have overlapping gray level information, the methods only with gray information cannot achieve the ideal effect for segmentation of a region with similar gray information.
2) Observation data modeling that is established by combining texture information with color features can better describe texture information. Results of image segmentation also showed that modeling had the ability to improve the segmentation of rice planthopper.
Combined with field-measured images, the segmentation of rice planthopper images was studied to provide a foundation for feature extraction and identification; some useful conclusions were obtained. Given the complexity of the task, further in-depth study in the future should include multi-scale processing technology to achieve fast segmentation of the rice planthopper images with large sizes. The characteristics of different features should be taken into consideration to strengthen the identification of rice planthopper and realize the remote real-time identification of the organism under field conditions.
Acknowledgements
This work was supported by the National Spark Program of China under Grant No.2014GA780009, the Features Innovative Program in Colleges and Universities of Guangdong under Grant No.2015KTSCX069, the Pearl River S&T Nova Program of Guangzhou under Grant No.201506010035, the State Scholarship Fund under Grant CSC No.201408440326, the Project of Outstanding Young Teachers' Training in Colleges and Universities of Guangdong under Grant No.YQ2015091, the Natural Science Foundation of Wuyi University under Grant No.2014zk10 and No.2015zk11, the PhD Start-up Fund of Natural Science Foundation of Wuyi University under Grant No.2015BS10 and No.2015BS11,the Science and Technology Planning Project of Jiangmen City under Grant No.201501003001581 and No. 201501003001556.
______________________________ References
1. Gurr, G. M., Liu, J., Read, D. M., Catindig, J. L. A., Cheng, J. A., Lan, L. P., and Heong, K. L., “Parasitoids of Asian rice planthopper (Hemiptera: Delphacidae) pests and prospects for enhancing biological control by ecological engineering”, Annals of Applied Biology, 158 (2), 2011, pp. 149-176.
3. Matsukawa, M., Ito, K., Kawakita, K., and Tanaka, T.,“Current status of the occurrence and farmer perceptions of rice planthopper in Cambodia”,Japan Agricultural Research Quarterly: JARQ, 48 (2), 2014, pp. 167-173.
4. Chen, S., and Zhang, Q., “Advance in researches on rice black--streaked dwarf disease and maize rough dwarf disease in China”, Acta Phytophylacica Sinica, 32 (1), 2005, pp. 97-103. 5. YingHua, J., ChunMei, R., ZhaoBang, C., Tong, Z., and YiJun, Z.,
“Preliminary identification of a newly occurred rice stunt disease in Jiangsu Province”, Jiangsu Journal of Agricultural Sciences, 25 (6), 2009, pp.1263-1267.
6. Fang, S., Yu, J., Feng, J., Han, C., Li, D., and Liu, Y., “Identification of rice black-streaked dwarf fijivirus in maize with rough dwarf disease in China”, Archives of Virology, 146 (1), 2001, pp. 167-170.
7. Matsukura, K., Towata, T., Sakai, J., Onuki, M., Okuda, M., and Matsumura, M., “Dynamics of Southern rice black-streaked dwarf virus in rice and implication for virus acquisition”, Phytopathology, 103 (5), 2013, pp.509-512.
8. Otuka, A., Zhou, Y., Lee, G. S., Matsumura, M., and Zhu, Y., “Prediction of overseas migration of the small brown planthopper, Laodelphax striatellus (Hemiptera: Delphacidae) in East Asia”,
Applied Entomology and Zoology, 47 (4), 2012, pp.379-388. 9. Zou, X. G., and Ding, W. M., “Design of processing system for
agricultural pests with digital signal processor”, Journal of Information & Computational Science, 9 (15), 2012, pp.4575-4582. 10. Park, Y. S., Han, M. W., Kim, H. Y., Uhm, K. B., Park, C. G., Lee, J. M., and Chon, T. S., “Density estimation of rice planthoppers using digital image processing algorithm”, Korean Journal of Applied Entomology, 42 (1), 2003, pp.57-63.
11. Martin, V., Moisan, S., Paris, B., and Nicolas, O., “Towards a video camera network for early pest detection in greenhouses”. In:
Proceedings of International Conference on Endure Diversifying Crop Protection, La Grande Motte, France: ENDURE, 2008, pp. 12-15.
12. Huddar, S. R., Gowri, S., Keerthana, K., Vasanthi, S., and Rupanagudi, S. R., “Novel algorithm for segmentation and automatic identification of pests on plants using image processing”.
Computing Communication & Networking Technologies (ICCCNT), 2012 Third International Conference on, Coimbatore, India: IEEE, 2012, pp. 1-5.
13. Pokharkar, S. R., and Thool, V. R., “Early pest identification in greenhouse crops using image processing technique”, International Journal of Computer Science and Network, 1 (3), 2012, pp. 1-6. 14. Besag, J., “Spatial interaction and the statistical analysis of lattice
systems”, Journal of the Royal Statistical Society, Series B (Methodological), 36 (2), 1974, pp. 192-236.
15. Geman, S., and Geman, D., “Stochastic relaxation, Gibbs distributions, and the Bayesian restoration of images”, Pattern Analysis and Machine Intelligence, IEEE Transactions on, 1 (6), 1984, pp. 721-741.
16. Voisin, A., Krylov, V. A., Moser, G., Serpico, S. B., and Zerubia, J., “Classification of very high resolution SAR images of urban areas using copulas and texture in a hierarchical Markov random field model”, Geoscience and Remote Sensing Letters, IEEE, 10 (1), 2013, pp. 96-100.
17. Ryali, S., Chen, T., Supekar, K., and Menon, V., “A parcellation scheme based on von Mises-Fisher distributions and Markov random fields for segmenting brain regions using resting-state fMRI”, Neuroimage, 65 (2), 2013, pp. 83-96.
18. Ashraf, A. B., Gavenonis, S. C., Daye, D., Mies, C., Rosen, M. A., and Kontos, D., “A multichannel markov random field framework for tumor segmentation with an application to classification of gene expression-based breast cancer recurrence risk”, Medical Imaging, IEEE Transactions on, 32 (4), 2013, pp.637-648.
19. Sridhar, B., Reddy, K. V. V. S., and Prasad, A. M., “Automated Medical image segmentation for detection of abnormal masses using Watershed transform and Markov random fields”, International Journal on Signal and Image Processing, 4 (3) , 2013, pp. 56.
20. Simmons, J., Przybyla, C., Bricker, S., Kim, D. W., and Comer, M., “Physics of MRF regularization for segmentation of materials microstructure images”. Image Processing (ICIP), 2014 IEEE International Conference on, Paris, France: IEEE, 2014, pp. 4882-4886.
21. Yousif, O., and Ban, Y., “Improving SAR-Based Urban Change Detection by Combining MAP-MRF Classifier and Nonlocal Means Similarity Weights”, IEEE Journal of Selected Topics in Applied Earth Observations and Remote Sensing, 7 (10), 2014, pp.4288-4300.
22. Ocegueda, O., Fang, T., Shah, S. K., and Kakadiaris, I. A., “3D face discriminant analysis using Gauss-Markov posterior marginals”,
Pattern Analysis and Machine Intelligence, IEEE Transactions on, 35 (3), 2013, pp.728-739.
23. Liu Xiaopei, Lu Zhaoyang, and Li Jing, “Segmentation of scene text image using color and MGD feature and MRF model”, Journal of Optoelectronics, 25 (9), 2014, pp.1824-1829.