AR
TICLE
1 Departamento de Medicina Legal, Ética Médica e Medicina Social e do Trabalho, Faculdade de Medicina, Universidade de São Paulo (USP). Av. Dr. Arnaldo 455, Cerqueira Cesar. 01246-903 São Paulo SP Brasil.
[email protected] 2 Departamento de Estatística, Instituto de Matemática e Estatística, USP. São Paulo SP Brasil.
Truck drivers’ traffic accidents in the State of São Paulo:
prevalence and predictors
Abstract The mortality rate of traffic accidents (TA) is high in Brazil. Trucks are the second cate-gory of motor vehicles most often involved in TA. However, few studies have addressed the issue of TA among these professionals. The study aimed to estimate the prevalence of TA and their predictors in a sample of 684 truck drivers recruited in the state of São Paulo during 2012 and 2013. We re-quested participants to answer a research instru-ment on their personal and occupational data and their involvement in TA and traffic violations. A logistic regression model was developed to identify TA predictors. Almost 11% of the respondents suf-fered at least one TA in that timeframe. We identi-fied the following TA predictors: having few years of experience as professional drivers (OR = 1.86; CI 95% = 1.05-3.38; p = 0.036); receiving some traffic tickets (OR = 1.91; CI 95% = 1.04-3.66; p = 0.043) and working more than 12 hours dai-ly (OR = 1.84; CI 95% = 1.04-3.24; p = 0.034). Given those results, we suggest the development of a joint action among all the involved social stake-holders in order to negotiate truck drivers’ work organization aiming at reducing behaviors that may lead to traffic accidents.
Key words Traffic accidents, Automobile driving, Motor vehicles, Cross-sectional studies, Epidemi-ology
Lucio Garcia de Oliveira 1
Carlos Vinícius Dias de Almeida 1
Lucia Pereira Barroso 2
Marcela Julio Cesar Gouvea 1
Daniel Romero Muñoz 1
O
liv
eir
Introduction
The World Health Organization (WHO) point-ed out that trafic accidents (TA) causpoint-ed the loss of 1.3 million lives in 2010 (2.2% of all deaths worldwide), placing TA among the ten major causes of death. Furthermore, in that same year, some 20 million to 50 million people were in-jured due to the TA1.
In particular, the high number of deaths and injuries is due to the increase of TA in low- and middle-income countries. Thus, these countries have concentrated 80% of deaths from TA in the world, despite having only 52% of the world mo-tor vehicles’ leet1.
In fact, the lack of effective action shall lead TA to be the ifth leading cause of death world-wide by year 20302. Thus, in order to save ive
million lives, the United Nations (UN) pro-claimed the period 2011-2020 as the “Decade of Action for Road Safety”1.
In Brazil, the estimated TA mortality rate for the year 2010 was 22.5 deaths / 100,000 in-habitants, higher than the corresponding rate of middle-income countries and the Americas3. In
this setting, from 1980 to 2011, 980,838 TA-re-lated deaths were recorded in the country, and this igure has been increasing exponentially4.
In addition, more recently, in 2012, the Uniied Health System (SUS), through the Mortality Information System (SIM) and the Hospital In-formation System (SIH) recorded 44,812 deaths in the country from some TA, as well as 159,152 hospitalizations were recorded for the care of TA victims5. Overall, this has resulted in the loss of
1,230,944 years of useful life due to premature death or injury among Brazilians due to TA, es-pecially among men6.
Also recently, in 2011, the report on “Acci-dent Statistics” of the National Department of Transport Infrastructure (DNIT) pointed out that 331,652 TA occurred on federal highways, discriminated by type of vehicle, as follows: (a) 179,206 TA involved passenger vehicles; (b) 93,066 were freight vehicles; and (c) 34,635 motorcycles. Thus, according to this informa-tion, trucks made up the second largest catego-ry of vehicles involved in TA, which also means that three out of ten TA in the country involved freight vehicles7. Again, this data is alarming if we
consider that just over 3% of the national leet consists of trucks8. In addition, the number of
deaths and truck occupants’ mortality rate in-creased by 103.2% and 66% respectively in the
period 1996-2011 in the country4. Furthermore,
truck drivers are the second category of workers with most sick leave due to temporary disability (32.5%), disability (27.9%) and death (33.2%)9.
The Ministry of Health (MOH) classiies TA as preventable or avoidable causes of death10. On
the other hand, as well illustrated by Waiselisz4,
TA cannot be seen as accidental causes of death, such that identifying TA-related factors would lead to a better understanding of this phenom-enon, thus enabling the development of speciic health and safety policies. In this setting, apart from surveys on statistics of accidents in our country4,7,11, few publications have addressed TA
in Brazil12, and rarely among truck drivers. Few
studies available on this topic have suggested that the organization of occupational activity of these professionals is a factor that makes them vulnerable to accidents and diseases13-15. Thus,
sleep deprivation, excessive daytime sleepiness, psychiatric disorders and substance abuse have already been mentioned as TA-associated factors in this social segment16-19, however, these health
conditions were collected separately from other possible risk factors.
Engaging in trafic violations has also been mentioned as TA-inluencing factor20, but both
its prevalence and its association with TA in truck drivers samples remains unknown. Whereas this knowledge gap hinders a comprehensive under-standing of TA in our country, this study assessed the prevalence of TA in a sample of truck drivers and their related factors by developing a logistic regression model, verifying impacts resulting from the interference of sociodemographic and occupational data, the use of psychoactive sub-stances, emotional stress, sleep deprivation and poor sleep, psychiatric disorders and engaging in trafic violations. Thus, in this study, we pro-posed to evaluate these factors in an integrated manner, raising hypotheses about the conditions that could interfere with the ability of profession-al truck drivers to drive safely in the public roads of our country.
Methodology
e C
ole
tiv
a,
21(12):3757-3767,
2016
Since the research that originated this study aimed to evaluate the impact of psychoactive substance use on truck drivers’ level of attention, individuals who presented at least one health condition that interfered in this assessment were excluded from the sample, namely: (a) has dif-iculty in viewing colors; (b) is under the thera-peutic use of psychoactive drugs; (c) has reported a head injury event (TCE) in life; (d) has suffered an episode of loss of consciousness in life; (e) has a history of neurological diseases; as well as (f) has tested positive for HIV.
Truck drivers were approached by a staff re-cruiter at SEST-SENAT service stations, in the above highways and informed about the research. Following their consent to participate, drivers were sent to interviewers who explained study objectives, the time needed to answer research instruments, always emphasizing the principles of voluntariness and conidentiality of informa-tion. The informed consent form was read by interviewers and, when agreement, signed by the participants. All participants were evaluated in-dividually in indoor, safe and quiet rooms whose use had been intended solely to carry out the ac-tivities of this study.
Truck drivers who actually participated in the study were then asked to answer a research tool already used with Brazilian truck drivers by Ley-ton et al.21 for recording demographic and
occu-pational information. As part of this instrument, we asked participants about their personal expe-rience with the use of alcohol and other drugs, as well as engaging in transit and TA violations. The identiication of these three variables was made according to three indicators: involvement in life
(“at least once in a lifetime”), over the year (“at least once in the twelve months preceding the in-terview”) and during the month.
Involvement in trafic violations include: (a) driving without wearing a seatbelt; (B) driving at higher speed than the maximum allowed on public roads; (c) bickering or ighting in trafic; (D) having received some trafic ticket for any reason; and (e) drunk-driving.
Involvement in TA was considered only during the truck driver performance of profes-sional activity through the question “have you ever been involved in some TA?” The deinition of TA explained to participants was used by the WHO22, that is, a TA is a fatal or non-fatal
dam-age that would have occurred from a collision involving at least one moving vehicle on public roads.
Participants were also asked to answer re-search tools for evaluating other mental health variables, whose effect was controlled in the lo-gistic regression model detailed later in this pa-per, which include: (a) Emotional stress (“Lipp’s Stress Symptoms Inventory” – LSSI); (b) psychi-atric disorders (“Mini International Neuropsy-chiatric Interview” – MINI): we used the sections related to major depression, mania, hypomania, generalized anxiety, panic disorder, agoraphobia, and posttraumatic stress disorder); sleep depri-vation and quality (“Pittsburgh Sleep Quality Index” – PSQI); and (d) daytime excessive sleepi-ness (“Epworth Sleepisleepi-ness Scale”- ESS).
Later, all the research instruments were cor-rected and submitted for double entry in Epi-In-fo v.6.0 software. InEpi-In-formation consistency veri-ications and relevant corrections were made. Then data were transferred and analyzed in the R software, version 2.15.1. Categorical variables were expressed as percentages (%) and numerical variables (initially expressed as mean ± standard deviation) were categorized according to the me-dian value, except for the variable “working day”, whose cutoff point (equal to 12 daily hours) fol-lowed proposal by Law No. 12.619/2012, which regulates the working day of truck drivers of our country. The outcome variable of this study was the involvement in TA in the year, enabling the clustering of participants into: TA Yes; TA No.
Bivariate analyzes were conducted using Pearson 2 test and Fisher’s exact test. Variables that achieved p <0.25 were included in a logistic regression model and selected through the “back-ward elimination” method. Odds ratio (OR, CI = 95%) was calculated as a measure of association. The null hypothesis was rejected when p <0.05. The model it was assessed by analyzing the resid-ual component of deviation and Cook’s distance. The diagnosis of multicollinearity was evaluated by the impact on the estimates of parameters and through the Variance Inlation Factor (VIF).
This study is in accordance with the Decla-ration of Helsinki and was approved by the Re-search Ethics Committee (CEP), Faculty of Med-icine, University of São Paulo, USP.
Results
O
liv
eir
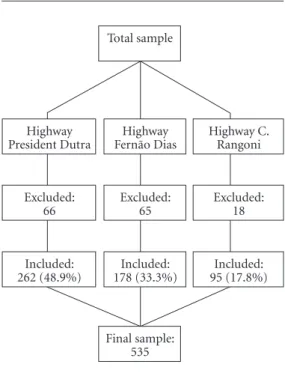
information for 535 truck drivers. The number of included and excluded subjects from the study who originated this study, distributed according to the highway in which they were recruited is shown in Figure 1.
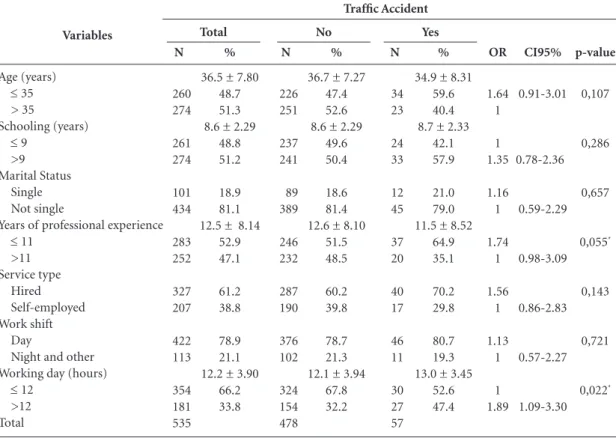
All participants were men, young adults (mean age 36.5 ± 7.8 years) with low school-ing (mean 8.6 ± 2.3 years), and most of them (81.1%) declared being married or having a stable relationship with someone. In relation to occupational conditions, participants reported working as professional truck drivers with an average experience of 12.5 ± 8.1 years; 61.2% of them were hired by some company at the time of interview, 78.9% worked during the day (morn-ing/afternoon) and had an average of 12.2 ± 3.9 daily working hours (Table 1).
Among them, 48.0% reported having suffered some TA at least once in their lifetime, 10.6% in the year and 2.6% in the period of thirty days pri-or to the interview. On the other hand, 98.1% of participants reported having engaged in at least one trafic violation in their lifetime, 89.0% in that year and 73.5% in that month.
Participants who had already suffered some
TA in the year had a higher daily workload (p =
0.022) than peers who reported not having suf-fered a TA. No other sociodemographic or oc-cupational variable was associated with TA out-come in the year (Table 1).
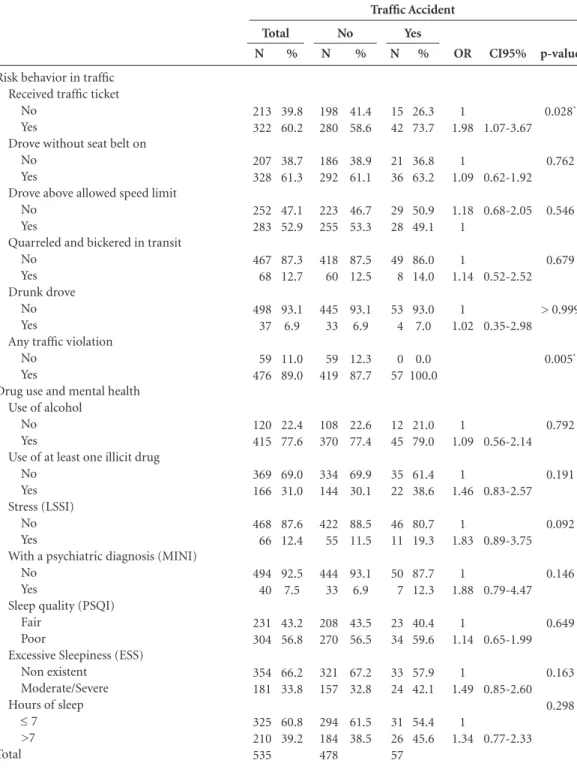
Particularly regarding trafic violations, 60.2% of participants reported having been ined for any reason, 61.3% drove without wearing a seatbelt, 52.9% drove the vehicle at speed greater than the maximum allowed by the public road, 12.7% sparred or discussed in trafic and 6.9% drove under the inluence of alcohol in the pe-riod relating to the twelve months prior to the interview. Almost 90% of participants reported having engaged in any of these behaviors (Table 2) and all participants who had undergone TA in the year had committed at least one trafic viola-tion in the same period.
Regarding the use of drugs, 77.6% of partici-pants reported having used alcohol and 31.0% of any illicit drug in the year. At the time of inter-view, 12.4% of participants would have a possible diagnosis of emotional stress and 7.5% a psychi-atric disorder. Again, six to ten participants slept less than seven hours a day and had poor sleep quality (according to the criteria of the Pitts-burgh Sleep Quality Index – PSQI) and, possibly because of that, 33.8% of respondents would al-ready be suffering from excessive daytime sleep-iness (Table 2).
In addition, drivers who were involved in some TA in the year had received trafic tickets more often than their peers who did not suffer TA (p = 0.028). Otherwise, no mental health variable was associated with TA outcome in the year (Table 2).
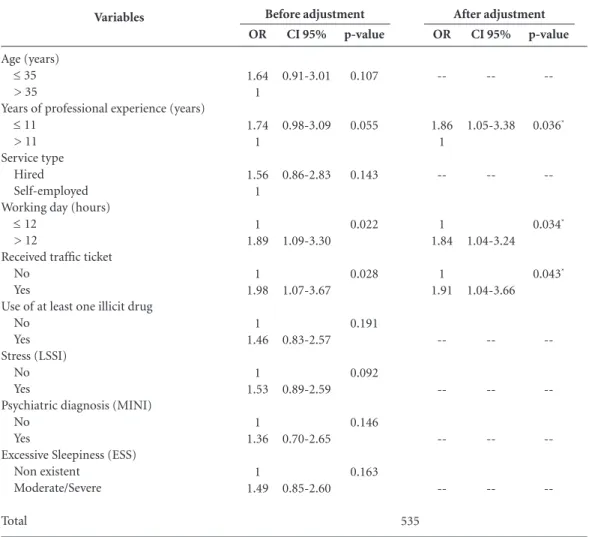
Table 3 shows the results of the logistic regres-sion model developed. The years of experience as a professional driver (p = 0.036), the daily work-ing hours (p = 0.034) and havwork-ing received trafic tickets in the year (p = 0.043) were the variables that emerged as TA-associated factors through the adjusted logistic regression model. Following veriication of the impact of sociodemographic, occupational and mental health variables (in-cluding the use of psychoactive substances), the following results were observed: (a) participants with fewer professional years were more likely to have suffered TA than more experienced profes-sional peers (OR = 1.86); (b) participants who drove more than twelve hours per day were more Figure 1. Illustrative chart of the sample of the distribution of truck drivers driving along the highways of the State of São Paulo, from June 2012 to September 2013, according to the inclusion and exclusion criteria of the research that originated this study (adapted from Eckschmidt23).
Note: Highway C. Rangoni = Highway Canon Domênico Rangoni
Final sample: 535 Total sample
Highway President Dutra
Excluded: 66
Included: 262 (48.9%)
Highway
Fernão Dias Highway C. Rangoni
Excluded:
65 Excluded:18
Included:
e C ole tiv a, 21(12):3757-3767, 2016
likely to engage in TA than those driving less dai-ly hours (OR = 1.84); and inaldai-ly, (c) drivers who had received some trafic ticket were more like-ly to engage in TA than those who had not been ined (OR = 1.91).
Discussion
The sociodemographic description of the conve-nience sample of recruited truck drivers in this study is consistent with previous studies13,15,19,24.
In occupational terms, participants had ex-tensive experience as truck professional drivers, taking excessive daily workload, which is also consistent with previous studies13,15,17,19,24. In this
regard, Souza et al.25 previously pointed out that
almost half of the sample of interviewed truck drivers exceeded 16 daily working hours.
Regarding the outcome variable of this study, 10.6% of participants reported having suffered
some TA in the year. This prevalence is very close to that previously identiied by Ulhoa et al.19,
which is 10.9% in the year. However, it was not possible to compare our results with studies by Souza et al.25 and Silva-Junior et al.24 because of
methodological differences, especially regarding the extent of TA, which then suggests the possi-bility of terms standardization for future studies. As for the TA-related factors among ap-proached truck drivers, we observed that little ex-perience as a professional driver, having received some trafic ticket within one year and, inally, daily workload were associated with the outcome of TA after verifying sociodemographic, occupa-tional and mental health variables.
Almeida et al.26 pointed out that few years
of experience as professional driver increase the likelihood of involvement in TA. In a study con-ducted with motorcycle professional drivers, Di-niz et al.27 pointed out that years of experience
are crucial to the establishment of strategies and OR 1.64 1 1 1.35 1.16 1 1.74 1 1.56 1 1.13 1 1 1.89 Variables Age (years)
≤ 35
> 35
Schooling (years) ≤ 9
>9 Marital Status
Single Not single
Years of professional experience
≤ 11
>11 Service type Hired Self-employed Work shift Day
Night and other Working day (hours)
≤ 12
>12 Total N 260 274 261 274 101 434 283 252 327 207 422 113 354 181 535 %
36.5 ± 7.80 48.7 51.3 8.6 ± 2.29
48.8 51.2
18.9 81.1 12.5 ± 8.14
52.9 47.1 61.2 38.8 78.9 21.1 12.2 ± 3.90
66.2 33.8
Table 1. Sociodemographic and occupational information of truck drivers approached on highways of the State of São Paulo, as per TA event reporting in the twelve months prior to the interview (N = 535). Highways of the State of São Paulo, from June 13, 2012 to September 25, 2013.
%
36.7 ± 7.27 47.4 52.6 8.6 ± 2.29
49.6 50.4
18.6 81.4 12.6 ± 8.10
51.5 48.5 60.2 39.8 78.7 21.3 12.1 ± 3.94
67.8 32.2 N 226 251 237 241 89 389 246 232 287 190 376 102 324 154 478 N 34 23 24 33 12 45 37 20 40 17 46 11 30 27 57 %
34.9 ± 8.31 59.6 40.4 8.7 ± 2.33
42.1 57.9
21.0 79.0 11.5 ± 8.52
64.9 35.1 70.2 29.8 80.7 19.3 13.0 ± 3.45
52.6 47.4
CI 95% = Conidence interval with a conidence coeficient of 95%; * statistically signiicant = p<0,05.
CI95% 0.91-3.01 0.78-2.36 0.59-2.29 0.98-3.09 0.86-2.83 0.57-2.27 1.09-3.30 p-value 0,107 0,286 0,657 0,055* 0,143 0,721 0,022* Traffic Accident
O liv eir OR 1 1.98 1 1.09 1.18 1 1 1.14 1 1.02 1 1.09 1 1.46 1 1.83 1 1.88 1 1.14 1 1.49 1 1.34 Risk behavior in trafic
Received trafic ticket No
Yes
Drove without seat belt on No
Yes
Drove above allowed speed limit No
Yes
Quarreled and bickered in transit No
Yes Drunk drove
No Yes
Any trafic violation No
Yes
Drug use and mental health Use of alcohol
No Yes
Use of at least one illicit drug No
Yes Stress (LSSI)
No Yes
With a psychiatric diagnosis (MINI) No
Yes
Sleep quality (PSQI) Fair
Poor
Excessive Sleepiness (ESS) Non existent
Moderate/Severe Hours of sleep
≤ 7 >7 Total
Table 2. Trafic violations, drug use and mental health of truck drivers on highways of the State of São Paulo, as per the TA event reporting in the twelve months prior to the interview (N = 535). Highways of the State of São Paulo, from June 13, 2012 to September 25, 2013.
LSSI = “Lipp’s Stress Symptoms Inventory”, for the assessment of emotional stress symptoms; MINI = “Mini International Neuropsychiatric Interview”, for the assessment psychiatric disorders; PSQI = “Pittsburgh Sleep Quality Index”, for the Assessment of sleep Quality and sleep disorders; ESS = “Epworth Sleepiness Scale”, for the assessment of daytime excessive sleepiness; CI95% = Conidence interval with a conidence coeficient of 95%; * statistically signiicant = p<0,05.
e C
ole
tiv
a,
21(12):3757-3767,
2016
operating methods that prevent driver’s involve-ment in TA. In any case, although our results are consistent with this information (despite asso-ciation between professional years and TA has arisen only after adjusting the logistic regression model), it is also important to consider the direct relationship between the time of experience in the profession and the driver’s age. In this regard, a review of literature on the association between age and the TA involvement rate among truck drivers found that younger people were more of-ten involved in TA28. In fact, in our country, these
data are conirmed by the fact that young truck
drivers have the highest frequency of Work Acci-dent Report (CAT)9 records, relecting the global
trend, as previously pointed out by the WHO, that TA predominantly affect the youngest4.
In this study, all (100%) truck drivers who reported having suffered TA in the year had en-gaged in at least one trafic violation in the same period, a higher prevalence than the 75% report-ed by Zhang et al.20. Among the surveyed trafic
violations, 60.2% of study participants reported having received some trafic tickets in the year, which emerged as a TA-associated factor in ad-justed logistic regression model.
Variables
Age (years)
≤ 35
> 35
Years of professional experience (years)
≤ 11
> 11 Service type
Hired Self-employed Working day (hours)
≤ 12
> 12
Received trafic ticket No
Yes
Use of at least one illicit drug No
Yes Stress (LSSI)
No Yes
Psychiatric diagnosis (MINI) No
Yes
Excessive Sleepiness (ESS) Non existent
Moderate/Severe
Total
Table 3. Estimates before and after logistic regression model adjustment on factors associated with the
occurrence of TA among truck drivers approached on highways of the State of São Paulo (N = 535). Highways of the State of São Paulo, from June 13, 2012 to September 25, 2013.
LSSI = “Lipp’s Stress Symptoms Inventory”, for the assessment of emotional stress symptoms; MINI = “Mini International Neuropsychiatric Interview”, for the assessment psychiatric disorders; PSQI = “Pittsburgh Sleep Quality Index”, for the assessment of sleep Quality and sleep disorders; ESS = “Epworth Sleepiness Scale”, for the assessment of daytime excessive sleepiness; OR = Odds Ratio; CI95% = Conidence interval with a conidence coeficient of 95%; *statistically signiicant = p<0,05.
p-value
0.107
0.055
0.143
0.022
0.028
0.191
0.092
0.146
0.163
OR
1.64 1
1.74 1
1.56 1
1 1.89
1 1.98
1 1.46
1 1.53
1 1.36
1 1.49
CI 95%
0.91-3.01
0.98-3.09
0.86-2.83
1.09-3.30
1.07-3.67
0.83-2.57
0.89-2.59
0.70-2.65
0.85-2.60
Before adjustment
p-value
--0.036*
--0.034*
0.043*
--OR
--1.86 1
--1 1.84
1 1.91
--CI 95%
--1.05-3.38
--1.04-3.24
1.04-3.66
--After adjustment
O
liv
eir
In this setting, Gates et al.29 argued that
com-mitting any trafic violation increased the likeli-hood of truck drivers’ risky behavior while driv-ing. Consistent with this information, Brodie et al.30 identiied in a study conducted with fatally
injured truck drivers that 85% of those fatalities have resulted from the victim’s reckless behavior in trafic.
Certainly, the issue of trafic violations is as-sociated with drivers’ individual characteristics. In this case, Marin & Queiroz31 had suggested a
direct relationship between the drivers’ person-ality, the issue of trafic violations and the occur-rence of TA. In this regard, the literature system-atic review developed by Araújo et al.32 pointed
out that impulsivity is a personality trait that in-terferes with trafic violations that can then cul-minate in accidents.
However, we believe that drivers’ personality is not per se a prominent factor for the occur-rence of TA, so that one could not blame only the truck driver for its occurrence. In this regard, al-though we have observed that committing trafic violations has been a TA-associated factor, this may have been a professional strategy to dodge aversive occupational contingencies. Thus, it is necessary to proceed with a systematic evalua-tion of these condievalua-tions pervading occupaevalua-tional activities of these workers, so that environmental interventions are developed and implemented in order to reduce the risk of accidents. In a broader sense, one must avoid a reductionist interpreta-tion of accidents, which is driver error-centered, disregarding the social and organizational con-text in which they occur27.
In this setting, it should be noted that ex-cessive workload emerged as a TA-associated factor among truck drivers. In fact, according to Soccolich et al.33, the likelihood of some critical
TA-culminating security event increases with in-creased working hours. Thus, among truck driv-ers, it may be that the impact of increased work-ing hours on the outcome of TA is mediated by physical and mental symptoms stemming from the intense workload. Therefore, it is common for truck drivers who drive for long time periods to have worse perception of the quality of life, as well as many body aches18,34.
This worsened perception of life extends to mental health complaints, such that the extend-ed workday is seen as one of the major stressors of the profession, determining the appearance of minor psychiatric disorders such as depression,
anxiety, fatigue, irritability, insomnia, memory loss and impaired concentration19. In addition, it
is also very possible that the effect of the exces-sive workload on the TA among truck drivers is mediated by the use of psychoactive substances used in order to prolong wakefulness and driv-ing hours35, as well as the sleep debt hours and
its consequences16,25. Anyway, all these variables
(emotional stress, psychiatric disorders, sub-stance abuse, sleep quality and excessive daytime sleepiness) were veriied in the adjusted logistic regression model, suggesting that future studies can further investigate the relationship between them and truck drivers’ working hours.
Van der Beek36 proposed that reducing the
number of daily hours worked is one of the pro-tection strategies to ensure truck drivers’ health and safety, increasing the likelihood of their proper recovery after a typical day of work, thus reducing the likelihood of their involvement in TA. In our country, it has long been suggested to adjust hours worked by truck drivers. In this regard, Law No. 12.619/2012, known as the Rest Law37, recently regulated professional drivers’
driving time, ensuring a minimum one-hour meal interval and daily rest of at least eleven hours, suggesting a daily work period of up to twelve hours.
Thus, we believe that social stakeholders’ compliance with the law in this setting is relevant, however, it will not be enough to change behav-ior in accordance with the previously pointed out by Diniz et al.27. Thus, it is necessary to develop
e C
ole
tiv
a,
21(12):3757-3767,
2016
Study strengths and limitations
This study is unique in the sense that it as-sessed truck drivers’ TA-associated factors, fol-lowing veriication of the confounding effect of sociodemographic and occupational characteris-tics, mental health and the issue of trafic viola-tions. In addition, survey of trafic violations is an underexplored subject among freight vehicle drivers. Thus, the inclusion of this topic in this study walks pari passu to the WHO recommen-dations which have encouraged member coun-tries to develop and monitor compliance with laws that promote best practices regarding driv-ing risk behaviors so that there may be a further overall decrease in number of TA and deaths by 20201. In any case, the results of our study will
O
liv
eir
References
World Health Organization (WHO). Global Status
Re-port on Road Safety 2013: SupRe-porting a Decade of Action.
Geneva: WHO; 2013.
World Health Organization (WHO). The top 10 causes of death. 2014 [acessado 2015 fev 13]. Disponível em: http://www.who.int/mediacentre/factsheets/fs310/en/. World Health Organization (WHO). Road safety: Esti-mated Number of Road Trafic Deaths. 2014 [acessado 2015 fev 13]. Disponível em: http://gamapserver.who. int/gho/interactive_charts/road_safety/road_trafic_ deaths/atlas.html].
Waiselisz JJ. Mapa da violência 2013: acidentes de
trân-sito e motocicletas. Rio de Janeiro: Flacso Brasil; 2013.
Brasil. Ministério da Saúde (MS). DataSUS. 2014. [acessado 2014 dez 3]. Disponível em: http://datasus. saude.gov.br/.
Chandran A, Kahn G, Sousa T, Pechansky F, Bishai DM, Hyder AA. Impact of road trafic deaths on expected years of life lost and reduction in life expectancy in Bra-zil. Demography 2013; 50(1):229-236.
Brasil. Ministério dos Transportes. Ministério da Justiça. Estatísticas de acidentes. 2011. [acessado 2015 fev 13]. Disponível em: http://www.dnit.gov.br/rodo-vias/operacoes-rodoviarias/estatisticas-de-acidentes. Brasil. Departamento Nacional de Trânsito. Frota de
veículos. 2011. [acessado 2014 dez 3]. Disponível em:
http://www.denatran.gov.br/frota.htm.
Teixeira MLP, Fischer FM. Acidentes e doenças do trabalho notiicadas, de motoristas proissionais do Estado de São Paulo. São Paulo em Perspectiva 2008; 22(1):66-78.
Malta DC, Duarte EC, Almeida MF, Dias MAS, Morais Neto OL, Moura L, Ferraz W, Souza MFM. Lista de causas de mortes evitáveis por intervenções do Sistema Único de Saúde do Brasil. Epidemiol Serv Saúde 2007; 16(4):233-244.
Mello-Jorge MHP. Acidentes de trânsito no Brasil: um
atlas de sua distribuição. São Paulo: ABRAMET; 2013.
Bacchieri G, Barros AJD. Acidentes de trânsito no Brasil de 1998 a 2010: muitas mudanças e poucos resultados.
Rev Saude Publica 2011; 45(5):949-963.
Masson VA, Monteiro MI. Estilo de vida, aspectos de saúde e trabalho de motoristas de caminhão. Rev bras
enferm 2010; 63(4):533-540.
Moreno CRC, Rotenberg L. Determinant factors of truck drivers’ work and repercussions on their health from the collective analysis of work perspective. Rev.
bras. saúde ocup. 2009; 34(120):128-138.
Penteado RZ, Gonçalves CGO, Marques JM, Costa DD. Trabalho e saúde em motoristas de caminhão no inte-rior de São Paulo; Work and health of truck drivers in the state of São Paulo. Saúde Soc 2008; 17(4):35-45. 1.
2.
3.
4. 5.
6.
7.
8.
9.
10.
11. 12.
13.
14.
15. Collaborations
LG Oliveira, CVD Almeida, LP Barroso, MJC Gouvea, DR Muñoz and V Leyton participated in the project design, analysis and interpretation of data, wording and critical evaluation of the pa-per, the approval of the inal version of this paper and were jointly responsible for all work aspects.
Acknowledgements
e C
ole
tiv
a,
21(12):3757-3767,
2016
Pinho RS, Silva-Júnior FP, Bastos JP, Maia WS, Mello MT, Bruin VM, Bruin PF. Hypersomnolence and acci-dents in truck drivers: A cross-sectional study.
Chrono-biol Int 2006; 23(5):963-971.
Nascimento EC, Nascimento E, Silva JP. Alcohol and amphetamines use among long-distance truck drivers.
Rev Saude Publica 2007; 41(2):290-293.
Souza JC, Paiva T, Reimão R. Sono, qualidade de vida e acidentes em caminhoneiros brasileiros e portugueses.
Psicol Estud 2008; 13(3):429-436.
Ulhoa MA, Marqueze EC, Lemos LC, Silva LG, Silva AA, Nehme P, Fischer FM, Moreno CR. Minor psychi-atric disorders and working conditions in truck drivers.
Rev Saude Publica 2010; 44(6):1130-1136.
Zhang G, Yau KK, Chen G. Risk factors associated with trafic violations and accident severity in China. Accid
Anal Prev 2013; 59:18-25.
Leyton V, Sinagawa DM, Oliveira K, Schmitz W, An-dreuccetti G, De Martinis BS, Yonamine M, Munoz DR. Amphetamine, cocaine and cannabinoids use among truck drivers on the roads in the State of Sao Paulo, Brazil. Forensic Sci Int 2012; 215(1-3):25-27.
World Health Organization (WHO). Health topics: in-juries, trafic. 2014 [acessado 2015 fev 13]. Disponível em: http://www.who.int/topics/injuries_trafic/en/ Eckschmidt F. Efeitos do consumo de álcool combinado a bebidas energéticas (AmED) entre motoristas de camin-hão no Estado de São Paulo: uma combinação de risco [tese]. São Paulo: USP; 2015.
Silva-Junior FP, Pinho RSN, Mello MT, Bruin VMS, Bruin PFC. Risk factors for depression in truck drivers.
Soc Psychiatry Psychiatr Epidemiol 2009; 44(2):125-129.
Souza JC, Paiva T, Reimão R. Sleep habits, sleepiness and accidents among truck drivers. Arq Neuropsiquiatr 2005; 63(4):925-930.
Almeida RL, Bezerra Filho JG, Braga JU, Magalhães FB, Macedo MC, Silva KA. Man, road and vehicle: risk fac-tors associated with the severity of trafic accidents. Rev
Saude Publica 2013; 47(4):718-731.
Diniz EPH, Assunção AA, Lima FPA. Prevenção de acidentes: o reconhecimento das estratégias operató-rias dos motociclistas proissionais como base para a negociação de acordo coletivo. Cien Saude Colet 2005; 10(4):905-916.
Duke J, Guest M, Boggess M. Age-related safety in pro-fessional heavy vehicle drivers: a literature review. Accid
Anal Prev 2010; 42(2):364-371.
Gates J, Dubois S, Mullen N, Weaver B, Bedard M. The inluence of stimulants on truck driver crash respon-sibility in fatal crashes. Forensic Sci Int 2013; 228(1-3):15-20.
16.
17.
18.
19.
20.
21.
22.
23.
24.
25.
26.
27.
28.
29.
Brodie L, Lyndal B, Elias IJ. Heavy vehicle driver fatal-ities: learning’s from fatal road crash investigations in Victoria. Accid Anal Prev 2009; 41(3):557-564. Marín L, Queiroz MS. A atualidade dos acidentes de trânsito na era da velocidade: uma visão geral. Cad
Saude Publica 2000; 16(1):7-21.
Araújo MM, Malloy-Diniz LF, Rocha FL. Impulsiv-idade e acidentes de trânsito. Rev psiquiatr clín 2009; 36(2):60-68.
Soccolich SA, Blanco M, Hanowski RJ, Olson RL, Mor-gan JF, Guo F, Wo SC. An analysis of driving and work-ing hour on commercial motor vehicle driver safety using naturalistic data collection. Accid Anal Prev 2013; 58:249-258.
Andrusaitis SF, Oliveira RP, Barros Filho TEP. Study of the prevalence and risk factors for low back pain in truck drivers in the state of São Paulo, Brazil. Clinics 2006; 61(6):503-510.
Girotto E, Mesas AE, de Andrade SM, Birolim MM. Psychoactive substance use by truck drivers: a system-atic review. Occup Environ Med 2014; 71(1):71-76. van der Beek AJ. World at work: truck drivers. Occup
Environ Med 2012; 69(4):291-295.
Brasil. Lei nº 12.619, de 30 de abril de 2012. Dispõe so-bre o exercício da proissão de motorista; altera a Con-solidação das Leis do Trabalho - CLT, aprovada pelo Decreto-Lei no 5.452, de 1o de maio de 1943, e as Leis nos 9.503, de 23 de setembro de 1997, 10.233, de 5 de junho de 2001, 11.079, de 30 de dezembro de 2004, e 12.023, de 27 de agosto de 2009, para regular e disci-plinar a jornada de trabalho e o tempo de direção do motorista proissional; e dá outras providências. Diário
Oficial da União 2012; 2 maio.
International Labor Organization (ILO). Decent Worg Agenda. 2013 [acessado 2015 fev 13]. Disponível em: http://www.ilo.org/global/about-the-ilo/decent-work -agenda/lang--en/index.htm].
Article submitted 06/03/2015 Approved 03/09/2015
Final version submitted 05/09/2015 30.
31.
32.
33.
34.
35.
36. 37.