Influence of magnification and superimposition
of structures on cephalometric diagnosis
Leonardo Koerich de Paula1, Priscilla de Almeida Solon-de-Mello2,
Claudia Trindade Mattos3, Antônio Carlos de Oliveira Ruellas4, Eduardo Franzotti Sant'Anna5
How to cite this article: Paula LK, Solon-de-Mello PA, Mattos CT, Ru-ellas ACO, Sant'Anna EF. Influence of magnification and superimposition of structures on cephalometric diagnosis. Dental Press J Orthod. 2015 Mar-Apr;20(2):29-34. DOI: http://dx.doi.org/10.1590/2176-9451.20.2.029-034.oar
Submitted: July 17, 2013 - Revised and accepted: January 19, 2014
» The authors report no commercial, proprietary or financial interest in the prod-ucts or companies described in this article.
Contact address: Leonardo Koerich de Paula 9528 Meredith Creek Lane, Glen Allen, Virginia, 23060. E-mail: [email protected]
1 MSc in Orthodontics, Universidade Federal do Rio de Janeiro (UFRJ), Rio de
Janeiro, Rio de Janeiro, Brazil.
2 DDS, Universidade Federal do Rio de Janeiro (UFRJ), Rio de Janeiro, Rio de
Janeiro, Brazil.
3 Adjunct professor, Universidade Federal Fluminense (UFF), Department of
Orthodontics, Rio de Janeiro, Rio de Janeiro, Brazil.
4 Associate professor, Universidade Federal do Rio de Janeiro (UFRJ),
Department of Orthodontics, Rio de Janeiro, Rio de Janeiro, Brazil.
5 Professor, Universidade Federal do Rio de Janeiro (UFRJ), Department of
Orthodontics, Rio de Janeiro, Rio de Janeiro, Brazil.
» Patients displayed in this article previously approved the use of their facial and intraoral photographs.
Objective: The purpose of this study was to assess the influence of magnification and superimposition of structures on CBCT-gen-erated lateral cephalometric radiographs (LCR) using different segments of the cranium. Methods: CBCT scans of 10 patients were selected. Four LCR were generated using Dolphin Imaging® software: full-face, right side, left side and center of the head. A total of
40 images were imported into Radiocef Studio 2®, and the angles of the most common cephalometric analyses were traced by the same
observer twice and within a 10-day interval. Statistical analyses included intraexaminer agreement and comparison between methods by means of intraclass correlation coefficient (ICC) and Bland-Altman agreement tests. Results: Intraexaminer agreement of the angles assessed by ICC was excellent (> 0.90) for 83% of measurements, good (between 0.75 and 0.90) for 15%, and moderate (be-tween 0.50 and 0.75) for 2% of measurements. The comparison be(be-tween methods by ICC was excellent for 68% of measurements, good for 26%, and moderate for 6%. Variables presenting wider confidence intervals (> 6o) in the Bland-Altman tests, in
intraex-aminer assessment, were: mandibular incisor angle, maxillary incisor angle, and occlusal plane angle. And in comparison methods the variables with wider confidence interval were: mandibular incisor, maxillary incisor, GoGn, occlusal plane angle, Frankfort horizontal plane (FHP), and CoA. Conclusion: Superimposition of structures seemed to influence the results more than magnifica-tion, and neither one of them significantly influenced the measurements. Considerable individual variability may occur, especially for mandibular and maxillary incisors, FHP and occlusal plane.
Keywords:Cone-beam computed tomography. Diagnosis. Radiography. Reproducibility of results.
DOI: http://dx.doi.org/10.1590/2176-9451.20.2.029-034.oar
Objetivo: o objetivo do presente estudo foi avaliar a influência da sobreposição estrutural e da magnificação nas radiografias cefalo-métricas laterais (RCL) geradas por meio de tomografias computadorizadas de feixe cônico (TCFC), usando diferentes segmentos do crânio. Métodos: foram selecionadas 10 tomografias de pacientes. Quatro RCL foram geradas usando Dolphin Imaging, sendo face total, lado direito, lado esquerdo e o centro da cabeça. Um total de 40 imagens foi importado para o Radiocef Studio, e os ângulos das análises cefalométricas mais comuns foram medidos pelo mesmo observador, duas vezes, em um intervalo de 10 dias. As análises estatísticas incluíram concordância intraexaminador e comparação entre os métodos por meio do coeficiente de correlação intraclasse (ICC) e testes de concordância de Bland-Altman. Resultados: a concordância intraexaminador dos ângulos avaliados pelo ICC foi excelente (> 0,90) para 83% das medições, boa (entre 0,75 e 0,90) para 15%, e moderada (entre 0,50 e 0,75) para 2% das medições. A comparação entre os métodos por ICC foi excelente para 68% das medições, boa para 26% e moderada para 6%. As variáveis que apresentaram intervalos de confiança mais amplos (> 6°) nos testes de Bland-Altman, na avaliação intraexaminador, foram: incisivo superior, incisivo inferior e plano oclusal, enquanto nos métodos de comparação, as variáveis com intervalos de confiança mais amplos foram: incisivo inferior, incisivo superior, GoGn, ângulo do plano oclusal, plano horizontal de Frankfort e CoA. Conclusão: a sobreposição estrutural pareceu influenciar os resultados mais do que a magnificação, mas os métodos não influenciaram significativamente as medições. Considerável variabilidade individual pode ocorrer especialmente para os incisivos supe-riores e infesupe-riores, plano horizontal de Frankfort e plano oclusal.
INTRODUCTION
Lateral cephalogram (LC) has been used as a diagnos-tic tool since its introduction in 1931 by Broadbent and Hofrath. Baumrind and Frantz1,2 were among the irst
authors to highlight potential errors related to this exam. First, there are “errors of projection” resulting from the fact that a LC is a superimposed two-dimensional (2D) shadow of a three-dimensional (3D) structure. There are also issues related to magniication, deined by Chad-wick et al3 as the “enlargement between a distance that
is displayed on an image of an object and the distance measured on the actual object.” Beyond these items are “errors of identiication” related to the process of cor-rectly identifying landmarks that will provide the values for interpretation. Furthermore, errors arise from the dif-iculty of reliably positioning patients in the cephalostat, and authors have shown that this may afect angular mea-surements.4,5,6 All these limitations with
two-dimension-al radiographs undoubtably have an efect on the mea-surements obtained from them, and, therefore, can afect viewer’s diagnosis.
The introduction of cone-beam computed tomogra-phy (CBCT) in Orthodontics7 has been ground-breaking
for diagnosis and treatment planning in speciic cases.8
Although visualization in multiplanar views and 3D re-construction were made possible with medical computed tomography, the lower radiation dose and lower cost of CBCT scans have helped to propel this imaging modality into part of the routine diagnostic measures used in Den-tistry. Today many companies continue to invest in the development of sotware to improve the viewer’s ability to manipulate and visualize structures in three dimensions.
One of the most useful tools of these types of sotware is the ability to create 2D LC from CBCT.9 Studies have
shown that most measurements are reliable in diferent situations, such as comparison between CBCT-gener-ated and conventional LC,10,11 and comparison between
CBCT-generated hemifacial and full-face LC to con-ventional LC.12 In addition, with CBCT, it is possible to
generate a LC of diferent structures of the head. With the tools that have been made available by computer sotware, it is possible to eliminate one of the drawbacks of tradi-tional 2D cephalograms (head orientation) and understand how “errors of projection” can inluence “errors of identi-ication”. The purpose of this study was to use these tools to assess the inluence of magniication and superimposi-tion of structures on cephalometric angular measurements.
MATERIAL AND METHODS
Walter et al13 reported that for reliability studies,
a sample of CBCTs from nine subjects is suicient, considering ρ0 = 0.5 (minimum acceptable level of reli-ability), ρ1 = 0.9 (expected level of reliability), α = 0.05, β = 0.2 (which implies a power test of 80%), n = 2 (in-traexaminer) and n = 4 (comparison of methods).
Ten patients (seven males and three females with mean age of 12.9 years old, ranging from 11 to 15 years) who had records taken at Universidade Federal do Rio de Janeiro were selected for this retrospective study. The study was approved by the University Institutional Review Board (protocol #69/2008), and an informed consent form was signed by all subjects. The following inclusion criteria were applied: patients with fully erupted molars and incisors and at least partially erupted canines. Exclusion criteria were: patients missing central incisors or irst molars, presence of crossbite, presence of any sig-niicant skeletal asymmetry (deviation of the chin, ramus or asymmetric condylar growth) or pathology that afects structures where the landmarks were placed.
CBCT scans were taken using iCat (Imaging Scienc-es, Hatield, PA, USA), 13 x 17 cm ield of view, voxel size of 0.4 mm and 20 seconds exposure time. The im-ages were collected at 120 kVp and 5 mA. All patients were in maximum intercuspation during the scan.
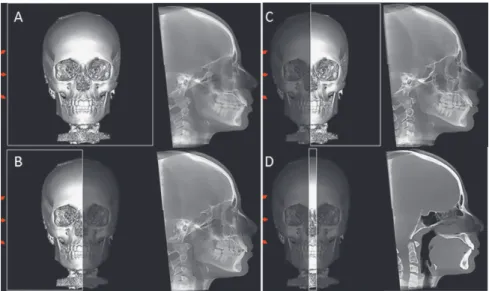
Ater acquisition, the DICOM (Digital Images and Communication in Medicine) iles were imported into Dolphin 3D (Dolphin Imaging version 11.0, Chatsworth, CA, USA). The head was reoriented us-ing the Frankfort horizontal plane (FHP) as the hori-zontal reference and the midsagittal plane and transpo-rionic plane as the vertical reference. Four diferent LCs were constructed using the perspective projection with the center ray going through the porion to simulate a 2D conventional LC: (1) full-face cephalogram (FFC); (2) right side cephalogram (RSC – full right side to the midsagittal plane); (3) let side cephalogram (LSC – full let side to the midsagittal plane); (4) center of the head cephalogram (CHC – area between the distal surface of maxillary right and let central incisors) (Fig 1).
Figure 1 - Lateral cephalogram acquisition us-ing Dolphin Imagus-ing. A) Full-face cephalogram,
B) right side cephalogram, C) left side cephalo-gram, D) center-of-the-head cephalogram.
Figure 2 - Lines used to obtain angles with a true vertical line.
McNamara (CoA, CoGn), Steiner (SN, NA, NB, ND, GoGn, maxillary incisors, palatal and occlusal planes) and Tweed (FHP, Tweed mandibular plane and man-dibular incisors) analyses were used to obtain lines/ planes to measure angles with a true vertical line (Fig 2). One previously trained observer plotted 22 landmarks to measure 15 angles in FFC, RSC, LSC, and 15 landmarks to
measure nine angles in CHC. The angular measurements were exported to a spreadsheet. All measurements were re-peated ater ten days by the same observer.
STATISTICAL ANALYSES
Intraexaminer agreement and comparison between methods were assessed by means of intraclass correlation coeicient (ICC) and Bland-Altman agreement tests, with conidence intervals set at 95%. The second mea-surements (T2) were used in the comparison between methods which were compared two by two.
RESULTS
ICC and Bland-Altman tests results are presented in Table 1 (intraexaminer agreement) and in Table 2 (agreement between methods).
Intraexaminer agreement assessed by ICC was ex-cellent (above 0.90) for 83% (45 of 54) variables test-ed, good (between 0.75 and 0.90) for 15% (8), and moderate (between 0.50 and 0.75) for only one variable (2%). The variable which presented the lowest ICC value for intraexaminer agreement was the mandibular incisor angle measured when only the right side of the head was used to generate the lateral cephalogram.
Variables presenting wider conidence intervals (greater than 6 o) in the Bland-Altman tests for
intraex-aminer assessment were: mandibular incisor angle (in all four methods); maxillary incisor angle (all methods ex-cept when CHC was used); and the occlusal plane angle when the FFC was used.
Table 1 - ICC and Bland-Altman results for intraexaminer agreement.
Li = mandibular incisors axis, Ui = maxillary incisors axis, Palatal = ANS-PNS, Occlusal = mesiobuccal cusp tip of the maxillary molar to maxillary incisor edge, FHP = PoOr, TwMP = Tweed Mandibular Plane (Me to lower border ramus); CI = confidence interval.
Full-face Right side Left side Center-of-the-head
ICC Bland-Altman ICC Bland-Altman ICC Bland-Altman ICC Bland-Altman Mean ± SD CI 95% Mean ± SD CI 95% Mean ± SD CI 95% Mean ± SD CI 95%
SN 0.966 -0.22 ± 0.56 -1.32; 0.88 0.971 0.12 ± 0.45 -0.77; 1.0 0.964 0.01 ± 0.52 -1.02; 1.03 0.915 -0.07 ± 0.99 -2.01; 1.88 NA 0.972 0.28 ± 0.78 -1.24; 1.80 0.941 0.32 ± 1.11 -1.86; 2.51 0.988 -0.01 ± 0.52 -1.02; 0.99 0.994 0.18 ± 0.36 -0.53; 0.89 NB 0.989 0.04 ± 0.25 -0.45; 0.53 0.983 -0.03 ± 0.29 -0.60; 0.54 0.987 0.12 ± 0.28 -0.43; 0.66 0.988 0.07 ± 0.25 -0.41; 0.56
ND 0.989 0.02 ± 0.38 -0.72; 0.77 0.997 -0.17 ± 0.19 -0.54; 0.20 0.991 0.04 ± 0.31 -0.57; 0.66 0.991 -0.17 ± 0.33 -0.83; 0.48 Li 0.876 -0.92 ± 1.87 -4.58; 2.75 0.632 -0.91 ± 3.38 -7.53; 5.72 0.896 -0.50 ± 2.02 -4.46; 3.46 0.929 -1.19 ± 1.66 -4.45; 2.07 Ui 0.873 0.64 ± 2.04 -3.35; 4.64 0.883 1.04 ± 2.35 -3.55; 5.64 0.899 1.89 ± 1.89 -1.83; 5.60 0.994 -0.10 ± 0.64 -1.36; 1.16
GoGn 0.980 -0.24 ± 1.23 -2.65; 2.17 0.982 0.37 ± 1.28 -2.14; 2.89 0.996 -0.01 ± 0.54 -1.08; 1.06 - - -Palatal 0.862 -0.02 ± 1.28 -2.54; 2.50 0.968 0.03 ± 0.65 -1.25; 1.32 0.953 -0.26 ± 0.87 -1.97; 1.44 0.928 -0.28 ± 1.06 -2.35; 1.79
Occlusal 0.929 0.05 ± 1.70 -3.28; 3.38 0.972 0.85 ± 1.10 -1.32; 3.01 0.973 -0.02 ± 1.08 -2.14; 2.09 - - -FHP 0.834 0.01 ± 0.80 -1.57; 1.59 0.771 -0.91 ± 1.29 -3.44; 1.62 0.944 0.15 ± 0.51 -0.85; 1.14 - - -TwMP 0.998 -0.07 ± 0.46 -0.98; 0.84 0.999 -0.01 ± 0.35 -0.69; 0.67 0.997 -0.07 ± 0.51 -1.06; 0.92 - -
-Y-Axis 0.989 -0.04 ± 0.43 -0.89; 0.81 0.992 -0.02 ± 0.38 -0.77; 0.72 0.993 0.26 ± 0.36 -0.44; 0.96 0.992 -0.06 ± 0.39 -0.83; 0.70 NPog 0.989 0.04 ± 0.27 -0.49; 0.58 0.988 0.03 ± 0.27 -0.49; 0.55 0.990 -0.01 ± 0.26 -0.53; 0.50 0.992 -0.18 ± 0.22 -0.61; 0.26
CoA 0.943 -0.60 ± 0.76 -2.08; 0.88 0.937 0.29 ± 0.87 -1.42; 2.00 0.935 0.21 ± 0.82 -1.81; 1.39 - - -CoGn 0.966 -0.17 ± 0.92 -1.98; 1.65 0.974 0.17 ± 0.81 -1.42; 1.76 0.992 0.01 ± 0.43 -0.84; 0.86 - -
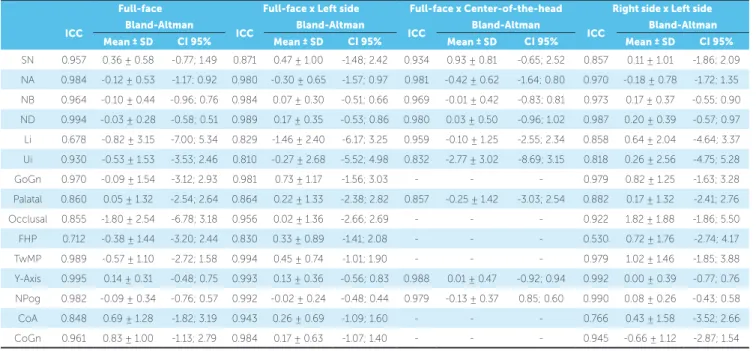
-Table 2 - ICC and Bland-Altman results comparing different methods.
Li = mandibular incisors axis, Ui = maxillary incisors axis, Palatal = ANS-PNS, Occlusal = mesiobuccal cusp tip of the maxillary molar to maxillary incisor edge, FHP = PoOr, TwMP = Tweed mandibular plane (Me to lower border ramus); CI = confidence interval.
Full-face Full-face x Left side Full-face x Center-of-the-head Right side x Left side
ICC Bland-Altman ICC Bland-Altman ICC Bland-Altman ICC Bland-Altman Mean ± SD CI 95% Mean ± SD CI 95% Mean ± SD CI 95% Mean ± SD CI 95%
SN 0.957 0.36 ± 0.58 -0.77; 1.49 0.871 0.47 ± 1.00 -1.48; 2.42 0.934 0.93 ± 0.81 -0.65; 2.52 0.857 0.11 ± 1.01 -1.86; 2.09
NA 0.984 -0.12 ± 0.53 -1.17; 0.92 0.980 -0.30 ± 0.65 -1.57; 0.97 0.981 -0.42 ± 0.62 -1.64; 0.80 0.970 -0.18 ± 0.78 -1.72; 1.35
NB 0.964 -0.10 ± 0.44 -0.96; 0.76 0.984 0.07 ± 0.30 -0.51; 0.66 0.969 -0.01 ± 0.42 -0.83; 0.81 0.973 0.17 ± 0.37 -0.55; 0.90
ND 0.994 -0.03 ± 0.28 -0.58; 0.51 0.989 0.17 ± 0.35 -0.53; 0.86 0.980 0.03 ± 0.50 -0.96; 1.02 0.987 0.20 ± 0.39 -0.57; 0.97
Li 0.678 -0.82 ± 3.15 -7.00; 5.34 0.829 -1.46 ± 2.40 -6.17; 3.25 0.959 -0.10 ± 1.25 -2.55; 2.34 0.858 0.64 ± 2.04 -4.64; 3.37
Ui 0.930 -0.53 ± 1.53 -3.53; 2.46 0.810 -0.27 ± 2.68 -5.52; 4.98 0.832 -2.77 ± 3.02 -8.69; 3.15 0.818 0.26 ± 2.56 -4.75; 5.28
GoGn 0.970 -0.09 ± 1.54 -3.12; 2.93 0.981 0.73 ± 1.17 -1.56; 3.03 - - - 0.979 0.82 ± 1.25 -1.63; 3.28
Palatal 0.860 0.05 ± 1.32 -2.54; 2.64 0.864 0.22 ± 1.33 -2.38; 2.82 0.857 -0.25 ± 1.42 -3.03; 2.54 0.882 0.17 ± 1.32 -2.41; 2.76
Occlusal 0.855 -1.80 ± 2.54 -6.78; 3.18 0.956 0.02 ± 1.36 -2.66; 2.69 - - - 0.922 1.82 ± 1.88 -1.86; 5.50
FHP 0.712 -0.38 ± 1.44 -3.20; 2.44 0.830 0.33 ± 0.89 -1.41; 2.08 - - - 0.530 0.72 ± 1.76 -2.74; 4.17
TwMP 0.989 -0.57 ± 1.10 -2.72; 1.58 0.994 0.45 ± 0.74 -1.01; 1.90 - - - 0.979 1.02 ± 1.46 -1.85; 3.88
Y-Axis 0.995 0.14 ± 0.31 -0.48; 0.75 0.993 0.13 ± 0.36 -0.56; 0.83 0.988 0.01 ± 0.47 -0.92; 0.94 0.992 0.00 ± 0.39 -0.77; 0.76
NPog 0.982 -0.09 ± 0.34 -0.76; 0.57 0.992 -0.02 ± 0.24 -0.48; 0.44 0.979 -0.13 ± 0.37 0.85; 0.60 0.990 0.08 ± 0.26 -0.43; 0.58
CoA 0.848 0.69 ± 1.28 -1.82; 3.19 0.943 0.26 ± 0.69 -1.09; 1.60 - - - 0.766 0.43 ± 1.58 -3.52; 2.66
CoGn 0.961 0.83 ± 1.00 -1.13; 2.79 0.984 0.17 ± 0.63 -1.07; 1.40 - - - 0.945 -0.66 ± 1.12 -2.87; 1.54
26% (19), and moderate for 6% (4). Variables present-ing the lowest ICC for method comparison were the FHP angle, when the right side was compared to the let side (ICC = 0.530) and to both halves (0.712); and the mandibular incisor angle when the right side was compared to full-face (ICC = 0.678).
side was compared to full-face and to the let side); FHP angle (when RSC and LSC were compared); and CoA angle (when RSC and LSC were compared).
DISCUSSION
CBCTs were not used to enhance the precision of measurements or to compare data of 3D-generated LCs with conventional 2D exams. In our study, CBCTs were used instead of 2D conventional images because the method could not be applied to 2D conventional LCs, even if dry skulls were used.
Diferent from other studies12,14 that compared the
changes between two variable lines, we used one true vertical line as reference which always had the same position (90o to FHP). For example, if the interincisal
angle has a signiicant variation, we cannot know if it was due to changes in maxillary incisors, mandibular incisors or both. With the current method, we could evaluate lines independently.
In our study, for the four LC modalities, all measure-ments, except for the mandibular incisor (Li), maxillary in-cisor (Ui), palatal plane and FHP, had excellent correlation. Li and Ui were the only measurements that were ex-cellent only with the center of the head cephalogram. This suggests that both measurements are inluenced by image superimposition. Ramirez-Sotele et al12 reported
that the location of the incisor apices could be diicult because of the contrast of the tooth apex and surround-ing bone, and that this landmark identiication is mostly based on the observer’s knowledge of tooth length. They also discussed that it is easier to locate these landmarks with an individual slice of the CBCT examination rather than with the entire image. In our study, the results were excellent for Li and Ui; however, the conidence interval showed diferences of up to 4 o with center-of-the-head
cephalograms. This means that, for certain individuals, the measurement error could be clinically signiicant, especially when comparing pre and post-treatment. The diiculty in locating landmarks in maxillary and mandibular incisors were also shown by Baumrind and Frantz,1 and corroborate our indings. Although 100%
and 96% of landmarks plotted in the maxillary and man-dibular incisors edge were within 1.5 mm from each other, only 83% and 49%, respectively, were within the same distance in terms of apex location. When compar-ing diferent imagcompar-ing modalities, the diferences in mea-surements for incisors could also be attributed to errors
in the current method. Because we divided the skull at the midsagittal plane, the incisors used for let and right side cephalograms could have had diferent positions. The slices used to create the center-of-the-head cepha-logram presented both central incisors. Therefore, the side which contained the most prominent incisor would probably be more similar to the other methods (center-of-the-head and full-face cephalograms).
The palatal plane showed good reproducibility with full-face cephalograms, and had excellent reproducibil-ity with the other modalities. In addition to that, the conidence interval was higher in the full-face cepha-logram, suggesting that it is easier to identify ANS and PNS with less superimposition of structures. The same assumption could be made for measurements such as FHP that use Porion and Orbitale for the occlusal plane which uses the tip of the irst maxillary molar and edge of maxillary incisors and the Co-A point. To our un-derstanding, superimposition of structures seemed to have more inluence on diferences in measurements than magniication. Most of these points are in ar-eas with dense structures, wherar-eas GoGn and Tweed Mandibular Plane, both of which have diferent bilat-eral points at the mandibular ramus in less dense areas, had excellent reproducibility using the same method and comparing between diferent methods. Baumrind and Frantz1 found that 73% of the times the error of
plotting Or was within 1 mm. Grauer et al10 found for
the same landmark (Or) an average error of 1.26 ± 1.88, for Po 1.04 ± 2.10 and for Co 1.23 ± 2.18. All the other landmarks used in our study had lower average error than those mentioned in Grauer et al’s study.10
In our study, for all LC modalities, measurements related to points S, N, A, B, D, Pog and Gn (SN, NA, NB, ND, NPog and Y-Axis) showed excellent repro-ducibility (ICC ≥ 0.9 for all measurements). When the modalities were compared to each other (Table 2), ICC was still considered excellent (ICC ≥ 0.9) for 22 of the 24 measurements and good for the other two. Ramirez-Sotelo et al12 found that the diference of
measurements between full-face, let, and right side cephalogram for SNA was ≤ 0.5o and for SNB ≤ 0.3o.
Baumrind and Frantz2 found that a variation of 1.5o or
the percentages of measurements with 1.5o of variation
were 91%, 92% and 74%, respectively.
Although we strove to correctly orient CBCT, the human head is not symmetric and small variations could contribute to diferences in lines depending on bilateral landmarks.
Reproducibility of angles was better with the cen-ter-of-the-head cephalogram (better ICC and smaller range conidence interval). In cases in which canines are still unerupted or there are impacted teeth, it may be a useful option to visualize incisor inclination. How-ever, we do not support the use of CBCT for this pur-pose only. As mentioned by Kapila et al8 in a literature
review, CBCT should be taken in speciic cases only when the diagnostic beneit outweighs the x-ray dos-age, with some examples being for orthognathic sur-gery, impacted teeth, airway evaluation and temporo-mandibular joint assessment.
Full-face cephalogram provides a more accurate representation of the patient as the way they exist in life: in three dimensions. However, in cases in which there is no evident asymmetry, using let or right side
cephalogram may be another option to clearly visualize the cranial structures.12 While patients selected for the
study were considered symmetric, we believe that if the same study were to be done with asymmetric patients, more variation would be found in mandibular measure-ments such as GoGn and Tweed Mandibular Plane.
CONCLUSION
In our sample, superimposition of structures seemed to inluence the results more than magniication did, and neither one of them signiicantly inluenced mea-surements taken in the same patient by comparing dif-ferent cephalometric methods. However, individual variability may occur in some cases, and the most criti-cal angles are related to mandibular and maxillary inci-sors, FHP and occlusal plane.
Acknowledgments
The authors would like to thank Radio Memory for providing the sotware Radiocef Studio 2 for research purposes.
1. Baumrind S, Frantz RC. The reliability of head ilm measurements. 1. Landmark
identiication. Am J Orthod. 1971;60(2):111-27.
2. Baumrind S, Frantz RC. The reliability of head ilm measurements. 2.
Conventional angular and linear measures. Am J Orthod. 1971;60(5):505-17.
3. Chadwick JW, Prentice RN, Major PW, Lam EW. Image distortion and
magniication of 3 digital CCD cephalometric systems. Oral Surg Oral Med Oral Pathol Oral Radiol Endod. 2009;107(1):105-12.
4. Malkoc S, Sari Z, Usumez S, Koyuturk AE. The efect of head rotation on
cephalometric radiographs. Eur J Orthod. 2005;27(3):315-21.
5. Yoon YJ, Kim KS, Hwang MS, Kim HJ, Choi EH, Kim KW. Efect of head rotation
on lateral cephalometric radiographs. Angle Orthod. 2001;71(5):396-403.
6. Adams GL, Gansky SA, Miller AJ, Harrell WE Jr, Hatcher DC. Comparison
between traditional 2-dimensional cephalometry and a 3-dimensional approach on human dry skulls. Am J Orthod Dentofacial Orthop. 2004;126(4):397-409.
7. Mozzo P, Procacci C, Tacconi A, Martini PT, Andreis IA. A new volumetric CT
machine for dental imaging based on the cone-beam technique: preliminary results. Eur Radiol. 1998;8(9):1558-64.
8. Kapila S, Conley RS, Harrell WE Jr. The current status of cone beam computed
tomography imaging in orthodontics. Dentomaxillofac Radiol. 2011;40(1):24-34.
REFERENCES
9. Grauer D, Cevidanes LS, Proit WR. Working with DICOM craniofacial images.
Am J Orthod Dentofacial Orthop. 2009;136(3):460-70.
10. Grauer D, Cevidanes LS, Styner MA, Heulfe I, Harmon ET, Zhu H, et al. Accuracy and landmark error calculation using cone-beam computed tomography-generated cephalograms. Angle Orthod. 2010;80(2):286-94.
11. Kumar V, Ludlow J, Cevidanes LHS, Mol A. In vivo comparison of conventional
and cone beam CT synthesized cephalograms. Angle Orthod. 2008;78(5):873-9. 12. Ramirez-Sotelo LR, Almeida S, Ambrosano GM, Boscolo F. Validity and
reproducibility of cephalometric measurements performed in full and hemifacial reconstructions derived from cone beam computed tomography. Angle Orthod. 2012;82(5):827-32.
13. Walter SD, Eliasziw M, Donner A. Sample size and optimal designs for reliability studies. Stat Med. 1998;17(1):101-10.