ORIGINAL ARTICLE
Portuguese version of the PTSD Checklist-Military Version
(PCL-M) –
– II: diagnostic utility
Teresa Carvalho, Jose´ Pinto-Gouveia, Marina Cunha, Joana Duarte
Cognitive-Behavioral Center for Research and Intervention (CINEICC), School of Psychology and Education Sciences, Universidade de Coimbra, Coimbra, Portugal.
Objective:War veterans are at high risk of developing posttraumatic stress disorder (PTSD), and the development of brief self-report instruments that enable screening for PTSD in this population is crucial. The PTSD Checklist-Military Version (PCL-M) is widely used for this purpose. This study sought to explore the diagnostic utility of the Portuguese version of the PCL-M.
Methods:The participants were 86 Portuguese Colonial War veterans (42 with a PTSD diagnosis and 44 without PTSD). Participants completed a self-report instrument designed to collect sociodemographic data, the PCL-M, and the Clinician-Administered PTSD Scale (CAPS).
Results: The area under the receiver operator characteristic (ROC) curve showed excellent discriminant ability between subjects with and without PTSD (AUC = 0.94). To achieve a positive PTSD diagnosis, an optimal cutoff point of 49 for the PCL-M total score and cutoff points for each of its 17 items are recommended.
Conclusions: This work is a relevant contribution for research and clinical practice in the vast population of Portuguese Colonial War veterans. Use of the PCL-M as a screening tool for PTSD symptoms will allow easier, resource-aware targeting of subjects with a potential PTSD diagnosis, adding to the improvement of public health in Portugal.
Keywords: Posttraumatic stress disorder; diagnosis and classification; military psychiatry; tests/ interviews; psychometric, statistics
Introduction
In research and clinical settings, two types of measure-ment instrumeasure-ments are normally used to assess posttrau-matic stress disorder (PTSD): structured clinical interviews that allow assessment of all PTSD diagnostic criteria and self-report questionnaires that contemplate PTSD symptom clusters. One such questionnaire is the PTSD Checklist (PCL),1 which is currently among the most widely used instruments for this purpose.
The PTSD Checklist-Military Version (PCL-M)1 is the PCL version most suitable for the screening of PTSD in war veterans. The 17 items of the PCL-M describe each of the DSM-IV2 symptoms for this disorder, and are associated with stress-induced military experiences. This instrument can be used for diagnostic purposes based both on the cutoff points for the total score and on the endorsement of each of the symptomatic items. An item is considered symptomatic when its score is equal to or greater than a given cutoff point, ranging from 1 (not at all) to 5 (extremely). According to DSM-IV,2the
endorse-ment of at least one reexperiencing item, three avoidance items, and two hyperarousal items is required for a PTSD
diagnosis. The utility of this instrument for clinical and research purposes is evident, given that prolonged exposure to war/combat is reported in the literature as one of the events that most contribute to the lifetime development of PTSD.3,4 As a brief self-report instru-ment, the PCL-M is particularly suited for this setting, as it allows easy screening of war veterans with a potential PTSD diagnosis. In fact, war combatant populations are at high risk of developing PTSD3,5,6 and may largely benefit from diagnostic instruments that are easily and rapidly applied. This is particularly true for Portuguese Colonial War veterans, given that, between 1961 and 1974, this war led to the deployment of Portuguese male citizens en masse to several simultaneous theaters of operations in Africa. It is estimated that approximately 10% of this population has a diagnosis of chronic PTSD.3 Several studies offer strong evidence for the good psychometric properties of the PCL-M.1,7This instrument is often used as a continuous measure for PTSD screening, by following recommended optimal cutoff points for the total scale. In this sense, in the Weathers et al. study1 of 123 male Vietnam War veterans, the optimal efficient cutoff score recommended for a PTSD diagnosis was 50. In turn, Yeager et al.8support a cutoff score of 31 in a sample of primary care veterans (79% male). Other studies using PCL measures other than the military version in samples of war veterans have reported cutoff points between 28 and 60 for the total scale.9-11 Furthermore, these studies and others showed that the
Correspondence: Teresa Carvalho, CINEICC, Faculdade de Psicologia e de Cieˆncias da Educac¸a˜o da Universidade de Coimbra, Rua do Cole´gio Novo, Apartado 6153, 3001-802, Coimbra, Portugal.
E-mail: [email protected]
Submitted Nov 17 2013, accepted Feb 19 2014.
ß2015 Associac¸a˜o Brasileira de Psiquiatria
PCL has adequate utility for PTSD screening, with area under the receiver operator characteristic (ROC) curve values ranging from 0.88 to 0.90 for the PCL-M,8,12from 0.86 to 0.89 for the PCL-C,9-11and from 0.76 to 0.84 for other versions of the PCL in different populations.13,14
However, to be considered definitive, a PTSD diag-nosis should combine a cutoff point for the total score and endorsement of the minimum number of symptomatic items for each symptom cluster, as determined by the DSM.1,15,16 In this regard, there is a lack of studies reporting cutoff points for the 17 items of the PCL in general and for the PCL-M in particular. The properties of the individual items are important if one seeks to make diagnostic judgments about the possible presence of PTSD based on the PCL.
Although Weathers et al.1suggest a cutoff point of 3 (moderately) for each item, Blanchard et al.15 urge caution on this point and argue that this cutoff point might be insufficient for several items, particularly those with low diagnostic efficiency, suggesting instead that cutoff points of 3 (moderately) and 4 (quite a bit) be considered for each item.
The present study sought to explore the diagnostic utility of the Portuguese version of the PCL-M in the screening of war veterans with a potential PTSD diagnosis resulting from exposure to the Portuguese Colonial War. Using the Clinician-Administered PTSD Scale (CAPS)16as the criterion measure, optimal cutoff points for the total scale and the 17 individual items were calculated.
Methods
Participants
A convenience sample of 86 male Portuguese Colonial War veterans was recruited. Considering that PTSD symptoms vary along a continuum of severity, the total sample comprised individuals from the general population of war veterans without a PTSD diagnosis and individuals from the clinical population with PTSD. The clinical group
was composed of 42 soldiers who, at the time of assessment, met DSM-IV diagnostic criteria for PTSD as a consequence of war exposure. Participants were recruited from several outpatient psychiatric services. The non-clinical group (without a current PTSD diag-nosis) was composed of 44 participants recruited from the general population of Portuguese Colonial War veterans. Participants from both groups were clinically assessed by a trained therapist using the CAPS, a structured interview for PTSD diagnosis.16 The demo-graphic characteristics of the total sample are described in Table 1.
Measures
The Social and Clinical Characterization Questionnaire of Portuguese Colonial War veterans (Carvalho et al., unpublished material, 2010) is a self-report instrument designed to collect personal, military, and clinical information regarding the present time, the period before the first military deployment, and the time spent during completed military deployments. For the purpose of this study, only personal and military information was used.
The PTSD Checklist-Military Version (PCL-M17; Portuguese version by Carvalho et al., unpublished material, 2013) is a self-report questionnaire designed specifically for military populations. It is composed of 17 items that refer to the 17 PTSD symptoms outlined in DSM-IV.2Respondents are asked to rate, on a five-point Likert scale (where 1 = not at all and 5 = extremely), the extent to which they have experienced each of the 17 diagnostic symptoms of PTSD in the past month as a result of their stressful military experiences. As men-tioned above, this scale can be used as a continuous measure to evaluate symptom intensity and as a dichotomous measure to assess PTSD diagnosis. The combination of these procedures is required to establish a PTSD diagnosis. The authors suggested optimal cutoff points of 50 for the total scale and 3 (moderately) for an item to be considered symptomatic.1,17The Portuguese version of the PCL-M was translated and adapted using
Table 1 Demographic characteristics of the sample
Total sample (n=86) Clinical group (n=42) Non-clinical group (n=44)
M SD Md Min Max M SD Md Min Max M SD Md Min Max
Age 64.29 4.36 64.00 55 77 64.12 4.04 64.00 58 77 64.46 4.68 64.50 57 74 Years of education 6.70 3.65 4.00 4 17 5.86 3.07 4.00 4 16 7.50 3.99 6.50 4 17 Time deployed (months) 23.83 11.22 24.00 4 85 26.49 10.60 25.50 11 85 21.30 11.33 22.50 4 72
n % n % n %
Marital status
Married/cohabiting 78 90.70 40 95.24 38 86.36
Divorced 7 8.14 1 2.38 6 13.64
Widowed 1 1.16 1 2.38 0 0.00
Occupational status
Employed 14 16.28 6 14.29 8 18.18
Retired 7 82.56 35 83.33 36 81.82
Unemployed 1 1.16 1 2.38 0 0.00
the back-translation method by two clinical psychologists fluent in English and Portuguese and having clinical experience in PTSD. The two Portuguese versions were compared and a final version of the scale was obtained, which was subject to back-translation by a native English speaker fluent in Portuguese. This process ensured linguistic and semantic equivalence between the original PCL-M and the translated version.18,19 Weathers et al.1 reported that the original PCL-M has high internal consis-tency both for the total scale (alpha = 0.97 in study one and alpha = 0.96 in study two) and for the three symptom clusters (alpha values ranged from 0.89 to 0.93). Similar results were found for the Portuguese version, namely 0.96 for the total scale, 0.95 for the reexperiencing cluster, 0.92 for the hyperarousal cluster, and 0.91 for the avoidance/ numbing cluster (Carvalho et al., unpublished data, 2013). The Clinician-Administered PTSD Scale (CAPS16; Portuguese version by Pinho & Coimbra)20is a structured clinical interview designed to diagnose, in adults, current and lifetime PTSD and/or to measure symptom severity in the last week. This instrument assesses all DSM-IV2 diagnostic criteria, as well as the presence of additional symptoms associated with guilt and dissociation. Frequency (0 = never; 4 = daily or almost every day) and intensity (0 = none; 4 = extreme) ratings may be added for each symptom to yield a severity score of 0 to 8. There are currently nine different scoring rules for CAPS,21 with the Blake et al.22 proposal being most widely used in clinical and research settings. According to this scheme, which was used in the present study, a symptom is considered present if an item has a frequency of at least 1 (once or twice) and an intensity of 2 (moderate) or more. Weathers et al.21argue that this rule is best for differential diagnosis, as it minimizes the overall number of diagnostic errors by giving equal weight to false positives and false negatives.
The CAPS is considered the ‘‘gold standard’’ for assessing PTSD diagnosis, having excellent psycho-metric properties and diagnostic utility.7
Methodological procedure
All participants were provided a description of the aims of the study and signed an informed consent form. One week after completion of the questionnaires (Social and Clinical Characterization Questionnaire of Portuguese Colonial War veterans and PCL-M), the CAPS was administered to the participants by a clinician with extensive expertise (over 10 years) in its application and blinded to PTSD diagnosis. The voluntary nature of the participants’ cooperation was stressed, and the study was approved by the ethics committees or review boards of the institutions from which participants were recruited. The general ethical principles of scientific research were followed.
Statistical analyses
All statistical procedures were performed in SPSS for Windows version 20.
Preliminary data analyses were conducted to assess violation of test assumptions. The normality of the distribution was tested using the Kolmogorov-Smirnov test and skewness and kurtosis values (skewness,|3| and kurtosis , |10| are acceptable values).23 Levene’s test was used to assess the equality of variances in different samples. For comparison of variable means, t-tests for independent samples and the nonparametric Wilcoxon-Mann-Whitney test were used. The chi-square test was used to compare categorical variables. To calculate ROC curves, we compared the actual diag-nosis, established through the CAPS (criterion measure), and the diagnosis predicted by the PCL-M. Quantitative analysis of the areas under the ROC curves (AUCs) followed Hosmer & Lemeshow’s critical values.24 According to the authors, an AUC value of 50 indicates no discriminative value, an AUC value o 70 and ,80
indicates acceptable discriminatory power, a valueo80 and, 90 indicates excellent discriminatory power, and values o 90 indicate outstanding discriminatory power.
Based on correspondence statistics, we calculated sensitivity (proportion of individuals diagnosed as true positives out of the total positive cases), specificity (proportion of individuals diagnosed as true negatives out of the total negative cases), diagnostic efficiency (proportion of individuals accurately diagnosed as having or not having PTSD), and positive and negative predictive power (proportion of individuals with positive or negative PTSD diagnosis that are true positives or negatives, respectively).25,26
The kappa was used as a measure of agreement between the PCL-M and the CAPS. The optimal cutoff point for the total scale was selected from the different scores within the optimal range of the ROC curve, obtained on the basis of CAPS results. Thus, we analyzed the diagnostic utility indicators described above for each score. However, the diagnostic efficiency and the positive and negative predictive power may be biased by the prevalence of the disease in the sample,27,28and thus may be less reliable determinants for the identifica-tion of the ideal cutoff point to discriminate between diseased and healthy subjects. Given this limitation, we used the Youden index (YI) as an additional indicator. The YI is the maximum difference between the true positive rate and the false positive rate26; it maximizes the global rate of correct classifications regardless of disease prevalence, and is thus an alternative to the diagnostic efficiency obtained through the AUC. This index ranges from 0 to 1. A complete separation of the distributions of the marker values for the diseased and normal popula-tions results in an index of 1, whereas complete overlap gives an index of 0.29 Use of this index allows adminis-tration of the PCL-M to different populations and in different settings, regardless of sensitivity and specificity. In addition, we compared the AUCs for the cutoff point recommended by the authors in the original version of the PCL-M1 with the AUCs for the optimal cutoff point
obtained in the present study.
previously, we followed the suggestion of Blanchard et al.30 and only considered scores of 3 (moderately) and 4 (quite a bit) for this analysis, as these are considered necessary for a positive diagnosis. Pursuant to the authors’ analytical procedure, different cutoff points for different items were obtained, based mainly on diagnostic efficiency.
Results
Demographic characteristics of the sample
The demographic characteristics of the sample are described in Table 1. Data for the clinical and non-clinical groups are presented separately for better characteriza-tion of the participants. No statistically significant differ-ences were found between the two groups regarding age (t(84) = 0.36, p = 0.723), marital status (x2(2) = 4.58, p =
0.101), or occupational status (x2(2) = 0.53, p = 0.758).
We found statistically significant differences regarding years of education (U = 710.00, z = -2.04, p = 0.041) and duration of deployment (U = 659.50, z = -2.29; p = 0.022), with individuals from the non-clinical group having higher median values for both parameters.
Diagnostic information for the sample
The total sample did not present a bimodal distribution for the CAPS or for the PCL-M, suggesting that PTSD severity varied along a continuum between the clinical and non-clinical groups. These results legitimize the use of a single sample comprising these two groups.
The characteristics of the groups regarding their PCL-M and CAPS scores are presented in Table 2. As expected, individuals with and without PTSD exhibited statistically significant differences in median CAPS scores (U = 19.50, z = -7.82, p,0.001), with individuals from the clinical group exhibiting higher scores. The same pattern was found for the PCL-M, with t(84) = -10.78 (p,0.001).
Diagnostic utility
PCL-M total
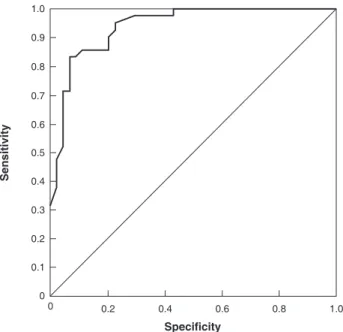
A graphic representation of the ROC curve for PTSD as predicted by the PCL-M is depicted in Figure 1. The results suggest an outstanding discriminatory ability, with AUC = 0.94 (SE = 0.02, 95%CI [confidence interval] 0.89-0.99).
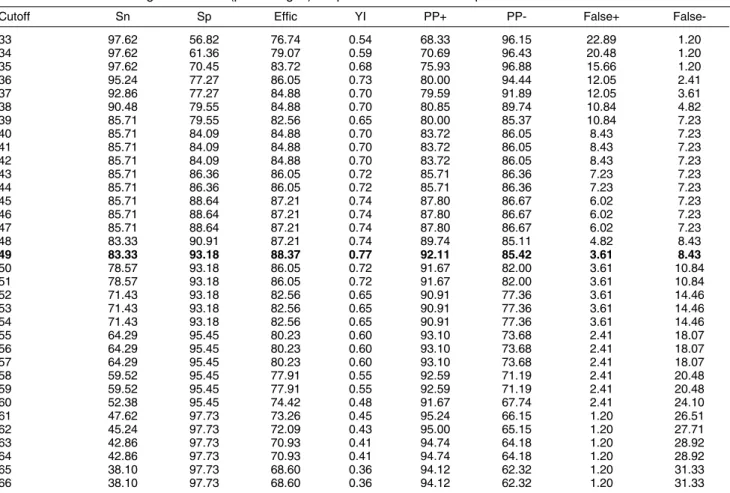
Table 3 shows the diagnostic characteristics for the cutoff points within the optimal range, between 33 and 66. Results showed that, in the present sample, a score of 49
was most adequate to discriminate between individuals with and without PTSD, as suggested by the YI (0.77) and diagnostic efficiency (88.37%). This optimal cutoff point also showed a kappa = 0.77 (SE = 0.07, p , 0.001) and the following discrimination indices: sensitivity = 83.33%, specificity = 93.18%, positive predictive power = 92.11%, and negative predictive power = 85.42%. As stated previously, an optimal cutoff point with an adequate YI will allow efficient discrimination between groups in other samples and settings, regardless of the prevalence of PTSD.
Figure 2 depicts the AUCs for the optimal cutoff point obtained in the present study (49) and for the original cutoff point (50).1For a score of 49, the AUC was 0.88, with SE = 0.04 (p ,0.001, 95%CI 0.80-0.96), whereas the cutoff of 50 exhibited a lower AUC in the present sample: 0.86, with SE = 0.04 (p,0.001, 95%CI 0.77-0.95).
PCL-M items
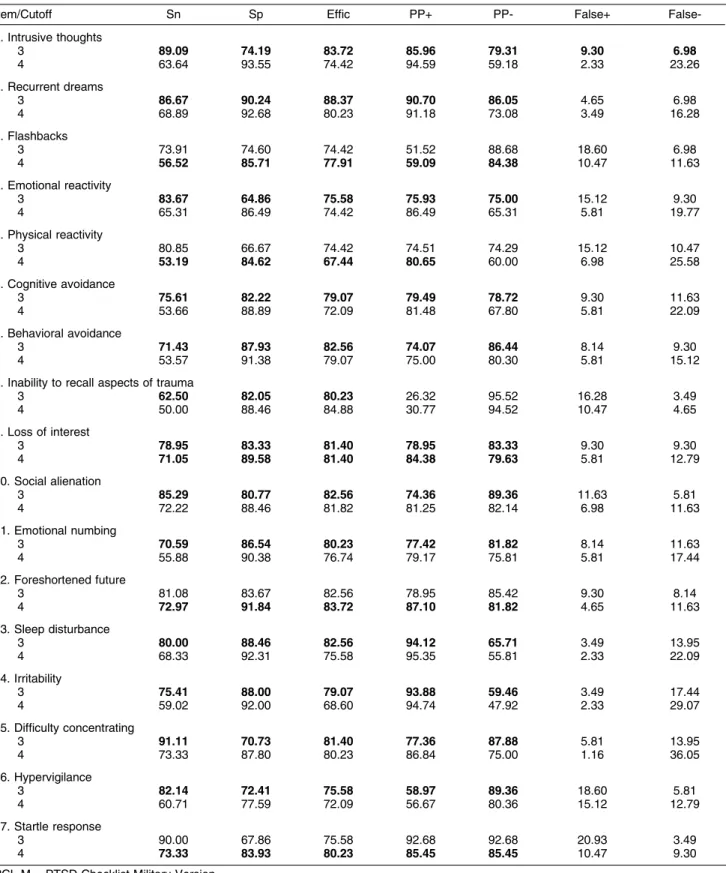
Following the analytical procedures previously described, we calculated psychometric properties to determine the suggested optimal cutoff point for each item (i.e., 3 = moderately or 4 = quite a bit). These are shown in Table 4 in bold. Items 3, 8, 12, and 17 exhibited higher diagnostic efficiency with a cutoff point of 4. The other psychometric Figure 1 Receiver operator characteristic curve of post-traumatic stress disorder predicted by the PTSD Checklist-Military Version.
Table 2 Diagnostic information of the samples
Measure Total sample (n=86) Clinical group (n=42) Non-clinical group (n=44)
M SD Md M SD Md M SD Md
CAPS 39.50 29.37 37.50 64.60 19.11 65.00 15.55 12.44 14.00 PCL-M 44.29 19.31 40.00 59.26 13.05 60.00 30.00 12.12 28.50
properties are presented in Table 3. It is also noteworthy that 16 items exhibited efficiency equal to or greater than 70%, a criterion proposed by Blanchard et al.29 as
adequate to assess this psychometric characteristic, in the absence of consensus. The value for item 5 was slightly lower than recommended at 67.44%.
Discussion
The present study explored the diagnostic utility of the Portuguese version of the PCL-M as a screening instrument for war/combat-related PTSD in a sample of Portuguese Colonial War veterans. The results showed an outstanding AUC value for the ROC curve (0.94), suggesting high ability to discriminate between indivi-duals with and without PTSD. Previous studies with war veterans reported lower AUC values, ranging from 0.88 to 0.90 for the PCL-M8,12and from 0.86 to 0.89 for the PCL-C.9-11 Studies with other populations and using other versions of the PCL also reported lower AUC values, ranging from 0.76 to 0.84.13,14
In addition, the specific AUC for the optimal cutoff point of 49 also showed outstanding discriminatory ability (AUC = 0.88). To our knowledge, ours is the first study to Table 3 Measures of diagnostic value (percentages) for potential PCL-M cutoff points
Cutoff Sn Sp Effic YI PP+ PP- False+
False-33 97.62 56.82 76.74 0.54 68.33 96.15 22.89 1.20
34 97.62 61.36 79.07 0.59 70.69 96.43 20.48 1.20
35 97.62 70.45 83.72 0.68 75.93 96.88 15.66 1.20
36 95.24 77.27 86.05 0.73 80.00 94.44 12.05 2.41
37 92.86 77.27 84.88 0.70 79.59 91.89 12.05 3.61
38 90.48 79.55 84.88 0.70 80.85 89.74 10.84 4.82
39 85.71 79.55 82.56 0.65 80.00 85.37 10.84 7.23
40 85.71 84.09 84.88 0.70 83.72 86.05 8.43 7.23
41 85.71 84.09 84.88 0.70 83.72 86.05 8.43 7.23
42 85.71 84.09 84.88 0.70 83.72 86.05 8.43 7.23
43 85.71 86.36 86.05 0.72 85.71 86.36 7.23 7.23
44 85.71 86.36 86.05 0.72 85.71 86.36 7.23 7.23
45 85.71 88.64 87.21 0.74 87.80 86.67 6.02 7.23
46 85.71 88.64 87.21 0.74 87.80 86.67 6.02 7.23
47 85.71 88.64 87.21 0.74 87.80 86.67 6.02 7.23
48 83.33 90.91 87.21 0.74 89.74 85.11 4.82 8.43
49 83.33 93.18 88.37 0.77 92.11 85.42 3.61 8.43
50 78.57 93.18 86.05 0.72 91.67 82.00 3.61 10.84
51 78.57 93.18 86.05 0.72 91.67 82.00 3.61 10.84
52 71.43 93.18 82.56 0.65 90.91 77.36 3.61 14.46
53 71.43 93.18 82.56 0.65 90.91 77.36 3.61 14.46
54 71.43 93.18 82.56 0.65 90.91 77.36 3.61 14.46
55 64.29 95.45 80.23 0.60 93.10 73.68 2.41 18.07
56 64.29 95.45 80.23 0.60 93.10 73.68 2.41 18.07
57 64.29 95.45 80.23 0.60 93.10 73.68 2.41 18.07
58 59.52 95.45 77.91 0.55 92.59 71.19 2.41 20.48
59 59.52 95.45 77.91 0.55 92.59 71.19 2.41 20.48
60 52.38 95.45 74.42 0.48 91.67 67.74 2.41 24.10
61 47.62 97.73 73.26 0.45 95.24 66.15 1.20 26.51
62 45.24 97.73 72.09 0.43 95.00 65.15 1.20 27.71
63 42.86 97.73 70.93 0.41 94.74 64.18 1.20 28.92
64 42.86 97.73 70.93 0.41 94.74 64.18 1.20 28.92
65 38.10 97.73 68.60 0.36 94.12 62.32 1.20 31.33
66 38.10 97.73 68.60 0.36 94.12 62.32 1.20 31.33
PCL-M = PTSD Checklist-Military Version.
Diagnostic efficiency (Effic) = (true positives + true negatives)/total sample size; false positives (False+); false negatives (False-); negative predictive power (PP-) = true negatives/(true negatives + false negatives); positive predictive power (PP+) = true positives/(true positives + false positives); sensitivity (Sn) = true positives/(true positives + false negatives); specificity (Sp) = true negatives/(true negatives + false positives); Youden index (YI) = sensitivity + specificity - 1. A score of 49 (in bold) represents the optimal cutoff point of the PCL-M total score.
Table 4 Measures of diagnostic values (percentages) for PCL-M item cutoff points
Item/Cutoff Sn Sp Effic PP+ PP- False+
False-1. Intrusive thoughts
3 89.09 74.19 83.72 85.96 79.31 9.30 6.98
4 63.64 93.55 74.42 94.59 59.18 2.33 23.26
2. Recurrent dreams
3 86.67 90.24 88.37 90.70 86.05 4.65 6.98
4 68.89 92.68 80.23 91.18 73.08 3.49 16.28
3. Flashbacks
3 73.91 74.60 74.42 51.52 88.68 18.60 6.98
4 56.52 85.71 77.91 59.09 84.38 10.47 11.63
4. Emotional reactivity
3 83.67 64.86 75.58 75.93 75.00 15.12 9.30
4 65.31 86.49 74.42 86.49 65.31 5.81 19.77
5. Physical reactivity
3 80.85 66.67 74.42 74.51 74.29 15.12 10.47
4 53.19 84.62 67.44 80.65 60.00 6.98 25.58
6. Cognitive avoidance
3 75.61 82.22 79.07 79.49 78.72 9.30 11.63
4 53.66 88.89 72.09 81.48 67.80 5.81 22.09
7. Behavioral avoidance
3 71.43 87.93 82.56 74.07 86.44 8.14 9.30
4 53.57 91.38 79.07 75.00 80.30 5.81 15.12
8. Inability to recall aspects of trauma
3 62.50 82.05 80.23 26.32 95.52 16.28 3.49
4 50.00 88.46 84.88 30.77 94.52 10.47 4.65
9. Loss of interest
3 78.95 83.33 81.40 78.95 83.33 9.30 9.30
4 71.05 89.58 81.40 84.38 79.63 5.81 12.79
10. Social alienation
3 85.29 80.77 82.56 74.36 89.36 11.63 5.81
4 72.22 88.46 81.82 81.25 82.14 6.98 11.63
11. Emotional numbing
3 70.59 86.54 80.23 77.42 81.82 8.14 11.63
4 55.88 90.38 76.74 79.17 75.81 5.81 17.44
12. Foreshortened future
3 81.08 83.67 82.56 78.95 85.42 9.30 8.14
4 72.97 91.84 83.72 87.10 81.82 4.65 11.63
13. Sleep disturbance
3 80.00 88.46 82.56 94.12 65.71 3.49 13.95
4 68.33 92.31 75.58 95.35 55.81 2.33 22.09
14. Irritability
3 75.41 88.00 79.07 93.88 59.46 3.49 17.44
4 59.02 92.00 68.60 94.74 47.92 2.33 29.07
15. Difficulty concentrating
3 91.11 70.73 81.40 77.36 87.88 5.81 13.95
4 73.33 87.80 80.23 86.84 75.00 1.16 36.05
16. Hypervigilance
3 82.14 72.41 75.58 58.97 89.36 18.60 5.81
4 60.71 77.59 72.09 56.67 80.36 15.12 12.79
17. Startle response
3 90.00 67.86 75.58 92.68 92.68 20.93 3.49
4 73.33 83.93 80.23 85.45 85.45 10.47 9.30
PCL-M = PTSD Checklist-Military Version.
conduct such an analysis of the PCL. This score obtained for the optimal range also yielded the highest YI. This index is more reliable than the other indicators used, namely diagnostic efficiency and positive and negative predictive power, for the identification of the ideal cutoff point regardless of disease prevalence.27,28,12 Thus, we
believe that a cutoff score of 49 should be used with Portuguese Colonial War veterans across other samples and settings, and that no information is needed regarding PTSD prevalence. This cutoff score is similar to that proposed by the authors of the original PCL-M, i.e., 50,1 and higher than those described in other studies using other PCL versions in war veteran samples (between 28 and 38).8,9,11 However, the cutoff point of 50 originally proposed for the PCL-M exhibited lower ability to discriminate between war veterans with and without PTSD in our sample. Specifically, it exhibited lower YI, sensitivity, diagnostic efficiency, positive predictive power, and negative predictive power, yielded a higher percentage of false negatives, and was equal in terms of specificity and false positives.
Although the cutoff point that corresponds to better diagnostic efficiency is often recommended as ‘‘optimal’’, cutoffs should actually be selected on the basis of the aim of screening; therefore, they can and should vary depending on why screening is being undertaken. For example, clinical purposes require that no true positives be missed; thus, the use of a lower cutoff may be preferable in the clinical setting. Conversely, if screening is being conducted for research purposes, a higher cutoff ensures that subjects screened as positive actually have the disorder.31
Our results further suggest that, to establish a PTSD diagnosis based on the DSM-IV2 and DSM-IV-TR32
criteria (at least one reexperiencing item, three avoidance items, and two hyperarousal items), four of the items of the Portuguese version (items 3, 8, 12, and 17) should be rated as 4 or higher to be considered symptomatic. The other items should be rated as 3 (moderately) or higher. Only item 5 showed a diagnostic efficiency slightly lower than the critical value of 70% proposed by Blanchard et al.30As, to the best of our knowledge, no other studies on this topic have been conducted in Portugal, we believe this item should be reevaluated in future research.
In short, the Portuguese version of the PCL-M is a brief and valuable tool for PTSD screening in accordance with DSM-IV2 and DSM-IV-TR32 criteria. This is one of few studies reporting an international version of the PCL to recommend cutoff points for the total scale and, particularly, for individual items to establish a potential positive diagnosis of PTSD, and thus offers a valuable contribution to the literature. This contribution should maximize the results of empirical research and clinical practice with Portuguese Colonial War veterans. Furthermore, we believe it will have an impact on Portuguese public health, given the high rates of war veterans that are significantly affected by PTSD symp-toms and its consequences for society as a whole.
Although our results suggest that the Portuguese version of the PCL-M is a useful screening test for
PTSD in military populations, several limitations should be noted regarding the generalizability of these findings. A convenience sample was used, which was composed only of Colonial War veterans recruited from the general population and from several outpatient clinics. These aspects influence the prevalence of PTSD in the sample, and, consequently, the sensitivity and specificity values obtained. Given these limitations, the use of Youden index values is recommended because it allows applica-tion of the PCL-M to different populaapplica-tions and settings, regardless of sensitivity and specificity. Future research should take into account these limitations when replicat-ing the present study in other military populations, not only in Portugal but also in other Portuguese-speaking countries.
In addition, it bears stressing that the PCL-M is mainly a screening instrument and cannot provide a complete PTSD diagnosis, as it only assesses the diagnostic criteria for this disorder. Thus, this instrument should be used with caution for clinical and research purposes and a PTSD diagnosis should be confirmed with structured clinical interviews, particularly if one wants to conduct epidemiological studies and refer patients for psychiatric treatment. Finally, as the new DSM-V has introduced several changes in the PTSD diagnostic criteria, when new versions of the PCL-M and CAPS adapted to these criteria become available, the diagnostic utility of the PCL-M should be reevaluated.
Acknowledgements
This research was supported by the first author’s PhD grant (SFRH/BD/68452/2010), sponsored by Portuguese Foundation for Science and Technology (FCT), and co-sponsored by the European Social Fund. The authors would like to thank their institutional review boards for approving the recruitment of participants in their services, namely the Consulta de Stress dos Hospitais da Universidade de Coimbra and Consultas de Psiquiatria e de Psicologia Clı´nica da Associac¸a˜o de Deficientes das Forc¸as Armadas (ADFA).
Disclosure
The authors report no conflicts of interest.
References
1 Weathers FW, Litz BT, Herman DS, Huska JA, Keane TM. The PTSD Checklist (PCL): reliability, validity and diagnostic utility. Paper presented at the 9th Annual Conference of the ISTSS; 1993 October; San Antonio, USA.
2 American Psychiatric Association. Diagnostic and Statistical Manual of Mental Disorders, Fourth Edition (DSM-IV). Arlington: American Psychiatric Publishing; 1994.
3 De Albuquerque A, Soares C, De Jesus P, Alves C. Perturbac¸a˜o po´s-trauma´tica do stress (PTSD). Avaliac¸a˜o da taxa de ocorreˆncia na populac¸a˜o adulta portuguesa. Acta Med Port. 2003;16:309-20. 4 Kessler RC, Sonnega A, Bromet E, Hughes M, Nelson CB.
5 Foy DW, Resnick HS, Sipprelle RC, Carroll EM. Preliminary, military and postmilitary factors in the development of combat related stress disorders. Behav Ther. 1987;10:3-9.
6 Kulka RA, Schlenger WE, Fairbanks JA, Hough RL, Jordan BK, Marmar CR, et al. Trauma and the Vietnam war generation: report of findings form the national Vietnam veterans readjustment study. New York: Brunner/Mazel; 1990.
7 Weathers FW, Keane TM, Davidson JR. Clinician administered PTSD scale: a review of the first ten years of research. Depress Anxiety. 2001;13:132-56.
8 Yeager DE, Magruder KM, Knapp RG, Nicholas JS, Frueh BC. Performance characteristics of the posttraumatic stress disorder checklist and SPAN in Veterans Affairs primary care settings. Gen Hosp Psychiatry. 2007;29:294-301.
9 Dobie DJ, Kivlahan DR, Maynard C, Bush KR, McFall M, Epler AJ, et al. Screening for post-traumatic stress disorder in female Veteran’s Affairs patients: validation of the PTSD checklist. Gen Hosp Psychiatry. 2002;24:367-74.
10 Keen SM, Kutter CJ, Niles BL, Krinsley KE. Psychometric properties of PTSD Checklist in a sample of male veterans. J Rehabil Res Dev. 2008;45:465-74.
11 Lang AJ, Laffaye C, Satz LE, Dresselhaus TR, Stein MB. Sensitivity and specificity of the PTSD checklist in detecting PTSD in female veterans in primary care. J Trauma Stress. 2003;16:257-64. 12 Dunn AS, Julian T, Formolo LR, Green BN, Chicoice DR. Preliminary
analysis of posttraumatic stress disorder screening within specialty clinic setting for OIF/OEF veterans seeking care for neck or back pain. J Rehabil Res Dev. 2011;48:493-502.
13 Grubaugh AL, Elhai JD, Cusack KJ, Wells C, Frueh BC. Screening for PTSD in public-sector mental health settings: the diagnostic utility of the PTSD checklist. Depress Anxiety. 2007;24:124-9.
14 Walter EA, Newman E, Dobie DJ, Ciechanowski P, Katon W. Validation of the PTSD checklist in a HMO sample of women. Gen Hosp Psychiatry. 2002;24:375-80.
15 Blanchard EB, Jones-Alexander L, Buckley TC, Forneris CA. Psychometric properties of the PTSD Checklist (PCL). Behav Res Ther. 1996;34:669-73.
16 Blake DD, Weathers FW, Nagy LM, Kaloupek DG, Gusman FD, Charney DS, et al. The development of a clinician-administered PTSD scale. J Trauma Stress. 1995;8:75-90.
17 Weathers FW, Litz BT, Huska JA, Keane TM. PCL-M for DSM-IV. Boston: National Center for PTSD - Behavioral Science Division; 1994.
18 Hambleton RK, Merenda PF, Spielberger CD. Adapting educational and psychological tests for cross-cultural assessment. Mahwah: L. Erlbaum Associates; 2005.
19 Hill MM, Hill A. Investigac¸a˜o por questiona´rio. 2a ed. Coimbra:
Sı´labo; 2008.
20 Pinho R, Coimbra JL. Escala PTSD Administrada Pelo Clı´nico para a DSM-IV. Porto: Instituto de Consulta Psicolo´gica, Formac¸a˜o e Desenvolvimento da Faculdade de Psicologia e Cieˆncias da Educac¸a˜o da Universidade do Porto; 2003.
21 Weathers FW, Ruscio AM, Keane TM. Psychometric proprieties of nine scoring rules for Clinician-Administered Posttraumatic Stress Disorder Scale. Psychol Assess. 1999;11:124-33.
22 Blake DD, Weathers FW, Nagy LM, Kaloupek DG, Klauminzer G, Charney DS, Keane TM. A clinician rating scale for assessing current and lifetime PTSD: The CAPS-1. Behav Ther. 1990;13:187-8.
23 Kline RB. Software review: Software programs for structural equation modeling: Amos, EQS, and LISREL. J Psychoeduc Assess. 1998;16:343-64.
24 Hosmer DW, Lemeshow S. Applied logistic regression. New York: Wiley; 2000.
25 Kleinbaum D, Klein M. Logistic regression, self-learning text. New York: Springer: 2010.
26 Krzanowski W, Hand D. ROC curves for continuous data. London: CRC Press; 2009.
27 Le CT. A solution for the most basic optimization problem associated with an ROC curve. Stat Methods Med Res. 2006;15:571-84. 28 Mark HZ, Campbell G. Receiver-operating characteristic (ROC)
plots: a fundamental evaluation tool in clinical medicine. Clin Chem. 1993;39:561-77.
29 Perkins NJ, Schisterman EF. The inconsistency of ‘‘Optimal’’ cut-points using two ROC based criteria. Am J Epidemiol. 2006;163:670-5.
30 Blanchard EB, Hickling EJ, Taylor AE, Forneris CA, Loos WR, Jaccard J. Effects of varying scoring rules of the Clinician-Administered PTSD Scale (CAPS) for the diagnosis of post-traumatic stress disorder in motor vehicle accident victims. Behav Res Ther 1995;33;471-5.
31 McDonald SD, Calhoun PS. The diagnostic accuracy of the PTSD Checklist: a critical review. Clin Psychol Rev. 2010;30:976-87. 32 American Psychiatric Association. Diagnostic and Statistical Manual