NEUROCORTICAL ELECTRICAL ACTIVITY
TOMOGRAPHY IN CHRONIC SCHIZOPHRENICS
Heloisa Veiga
1, Andréa Deslandes
2, Mauricio Cagy
3, Adriana Fiszman
4,
Roberto Airthon M. Piedade
5, Pedro Ribeiro
6ABSTRACT - Functional imaging of brain electrical activity was performed in 25 chronic medicated schizophrenics and 40 controls, analyzing the classical frequency bands (delta, theta, alpha, and beta) of 19-channel EEG during resting state to identify brain regions with deviant activity of different functional significances, using LORETA (Low Resolution Tomography) and SPM99 (Statistical Parametric Mapping). Patients differed from controls due to an excess of slow activity comprising delta + theta frequency bands (inhibitory pattern) located at the right middle frontal gyrus, right inferior frontal gyrus, and right insula, as well as at the bilateral anterior cingulum with a left preponderance. The high temporal resolution of EEG enables the specification of the deviations not only as an excess or a deficit of brain electrical activity, but also as inhibitory (delta, theta), normal (alpha), and excitatory (beta) activities. These deviations point out to an impaired functional brain state consisting of inhibited frontal and prefrontal areas that may result in inadequate treatment of externally or internally generated information.
KEY WORDS: brain mapping, EEG, LORETA (low resolution electromagnetic tomography), schizophrenia.
Atividade elétrica neurocortical em esquizofrênicos crônicos Atividade elétrica neurocortical em esquizofrênicos crônicosAtividade elétrica neurocortical em esquizofrênicos crônicos Atividade elétrica neurocortical em esquizofrênicos crônicosAtividade elétrica neurocortical em esquizofrênicos crônicos
RESUMO - Imagens funcionais da atividade elétrica cerebral de 25 esquizofrênicos crônicos medicados e de 40 controles foram obtidas através do registro (19 canais) e da análise das faixas tradicionais (delta, teta, alfa e beta) do EEG, durante o repouso vigil. O objetivo foi identificar regiões do cérebro que apresentassem desvios com diferentes significados funcionais na ‘Low Resolution Electromagnetic Tomography’ (LORETA) e no ‘Statistical Parametric Mapping’ (SPM). Observou-se excesso de atividade lenta nas faixas delta + teta (padrão inibitório) nos pacientes esquizofrênicos, localizado no giro frontal médio direito, no giro frontal inferior direito e na insula direita e, também, na porção anterior do giro do cíngulo, bilateralmente, mas com predomínio à esquerda. A alta resolução temporal do EEG permite especificar os desvios em termos de excesso ou déficit de atividade elétrica cerebral, bem como de atividades com um padrão inibitório (delta, teta), normal (alfa) e excitatório (beta). Os desvios encontrados apontam para comprometimento funcional cerebral que consiste no predomínio de atividade inibitória nas áreas frontais e pré-frontais que pode causar processamento inadequado de informações, quer de origem externa quanto interna.
PALAVRAS-CHAVE: mapeamento cerebral, eletroencefalografia quantitativa (EEGq), LORETA (tomografia de baixa resolução), esquizofrenia.
1Mestranda em Saúde Mental, Instituto de Psiquiatria, Setor de Neuroimagem Funcional, Universidade Federal do Rio de Janeiro, RJ,
Brasil (IPUB-UFRJ) e Universidade Castelo Branco (PROCIHM); 2Mestranda em Saúde Mental IPUB-UFRJ; 3Doutorando em Engenharia
Biomédica, UFRJ; 4Doutoranda em Psiquiatria, IPUB-UFRJ; 5Professor Adjunto III Doutor, IPUB-UFRJ; 6Professor Adjunto II PhD, Escola de
Educação Física e Desportos IPUB-UFRJ; Professor Pesquisador, PROCIHM.
Received 6 January 2003, received in final form 3 April 2003. Accepted 8 May 2003.
Dr. Pedro Ribeiro - Setor de Neuroimagem Funcional, Instituto de Psiquiatria, UFRJ - Avenida Venceslau Brás 71 Fundos - 22290-140 Rio de Janeiro RJ - Brasil. E-mail: [email protected]
Over the last few years, Quantitative
Electroen-cefalography (qEEG) has been a valuable toll in the
development of new avenues to tackle crucial issues
in behavioral neuroscience. Since Ingvar et al.
1-3des-cribed hypofrontality in chronic schizophrenics by a
regional cerebral blood flow method, several
investigations using different methods (PET, SPECT,
fMRI) have reported dysfunctions in the
schizoph-renic frontal, pre-frontal lobe
4-6, that are associated
with deficits in attention, planning, and working
me-mory
7. In line with these findings, several quantitative
electroencephalographic studies have also reported
hypofrontality, which can be defined as a frontally
pronounced slowing of EEG activity
8-12. A slowing of
of hypo-frontality became popular, Lemere
14descri-bed a slowing of EEG activity in schizophrenic
pa-tients, especially those with a deteriorating course
of illness. Since then, many studies have stressed the
relation between a slowing of EEG activity and an
unfavorable course of the illness and/or negative
symptoms
9,15,16.
Although PET and fMRI technologies have a fine
spatial resolution, they only provide an indirect
mea-sure of neuronal electrical activity. Their temporal
resolution is too low to discriminate the rapidly
shifting patterns characteristic of actual
neurophy-siological processes
17. On the other hand, the
quan-titative electroencephalogram (qEEG) has a high
tem-poral resolution (generally 1 to 5 milliseconds), but
a spatial resolution limited to the area of the
elec-trode sites. Therefore, the interpretation of the
un-derlying functional neuroanatomy is possible only
at the level of entire cortical lobes
17. Scalp
distribu-tions of EEG power bands are not directly
interpre-table in terms of intracerebral generator locations.
To avoid this problem, Michel et al.
18and Dierks et
al.
19applied the “FFT-Dipole-Approximation” for
computing brain localization of EEG-generating
pro-cesses. However, FFT-Approximation is limited to a
particular site and is unable to generate full
three-dimensional (3D) images. Restriction to a distinct
location does not allow a reasonable estimate of the
active processes of higher brain functions.
Recently, Pascual-Marqui et al.
20and
Pascual-Mar-qui
21proposed a new approach to tackle this
pro-blem using LORETA (Low Resolution Electromagnetic
Tomography). This method allows a direct, true 3D
tomography of brain electric activity. It requires only
simple constraints and no predetermined knowledge
about the number of discernable source regions.
Using LORETA, the high temporal resolution of the
brain electric data can be analyzed separately for
the different EEG frequency bands, which have
dif-ferent functional interpretations. This approach
allows the discrimination between distinct brain
elec-trical patterns; such as: delta, theta, alpha and beta
frequency bands
11. In this context, to assess whether
this new imaging tool (LORETA) can detect
hypo-frontality in schizophrenics, we investigated
medi-cated chronic schizophrenic patients compared to
normal control subjects.
METHOD
Subjects
Twenty five (25) chronic medicated schizophrenic out-patients from the Institute of Psychiatry (Federal University of Rio de Janeiro, Brazil) were selected for this study. All
the patients presented a positive clinical history of birth difficulties, brain pathology during development, head trauma, epilepsy, developmental or neurological abnormalities, and psychoactive substance abuse. The diagnostic criteria used for schizophrenia classification was that from ICD-10 and the great majority of patients had a clinical predominance of negative symptomatology. All patients were under conventional anti-psychotic medications, but one using conventional associated with an atypical, and another only atypical neuroleptic, at the moment of the EEG assessment. There were 16 males and 9 females (mean age 29.6 years ± 7.98 SD) with a mean evolution time of 9.64 years ± 7.12 SD. There were 40 controls recruited among students, hospital staff, and faculty members (23 males and 17 females; mean age 30.4 years ± 7.99 SD). The 40 volunteers were screened for psychiatric disorders and all met the exclusion criteria mentioned above for the schizophrenics. There was no significant age difference between control and patient groups. Both groups signed a consent form and the expe-riment was approved by the ethics committee.
Data acquisition and processing
Patients and controls were seated in a comfortably sound and light attenuated room, while 20 minutes or more of eyes-closed alert/resting EEG data were collected from the19 mono-polar electrodes sites. International 10/ 20 System (referred to linked earlobes) for electrode pla-cement was used with a Braintech-3000 (EMSA-Medical Instruments, Brazil).
Eye-movement (EOG) artifact was monitored with a bipolar electrode montage using two 9-mm diameter
trodes attached superior to and on the external canthus of the right eye. Impendances for EEG and EOG electrodes were under 5 KΩ and 20 KΩ, respectively. Visual inspection was employed for detection and elimination of artifacts. Moreover, Independent Component Analysis (ICA) was ap-plied to remove possible sources of artifacts. Amplifier band-pass was 0.5-70 Hz (3 dB points), with a 60 Hz notch filter. Data were digitized at 200 Hz with a 12-bit resolution.
At least two minutes of artifact-free data were extrac-ted from the EEG’s total record for quantitative analysis. Power-spectral analysis was performed with Fast Fourier Transform (FFT). For each of the 19 monopolar derivations, absolute and relative (%) power, mean frequency, inter-hemispheric and intra-inter-hemispheric coherence, and sym-metry were computed for the delta (1.0 - 3.5 Hz), theta (4.0 - 7.5 Hz), alpha (8 - 12 Hz), and beta (13 - 25 Hz) frequency bands. Absolute power was the only parameter used to create the functional images of neuronal electrical activity for the 4 classical bands of EEG (delta, theta, alpha, and beta) and for the 10 monopolar derivations.
Functional images of neuronal electrical activity The 3D intracerebral distribution of neuronal electrical activity (current density) from the scalp-recorded potential distribution was assessed with Low Resolution Brain Elec-tromagnetic Tomography (LORETA)20. LORETA computes
current density at each voxel in the brain as the linear,
weighted sum of the scalp electric potentials21. The 3D
solution space was restricted to the cortical gray matter and hippocampus in the Talairach Atlas, as determined by the corresponding digitized Probability Atlas available from the Brain Imaging Center, Montreal Neurologic Institute22.
According to Pascual-Marqui et al.11, a voxel is labeled
as gray matter if it met the following three conditions: its probability of being gray matter is higher than that of being white matter, its probability of being gray matter is higher than that of being cerebrospinal fluid, and its pro-bability of being gray matter is higher than 33 %. Only those gray matter voxels that, after the Talairach Atlas, belonged to cortical and hippocampal regions were used for the analysis. A total of 2394 voxels at 7 mm spatial resolution were produced under these neuroanatomical constraints. LORETA represents the electrical activity at each voxel as squared magnitude (power) of the computed current density. The scalp-recorded potential distribution (power values at the 19 electrodes) for each subject and for each classical frequency bands (delta, theta, alpha and beta) in this study was transformed into LORETA functional images. In another step, each LORETA functional image was transformed to SPM99 (Statistical Parametric Map-ping)23 format, and subsequently normalized with a spatial
resolution of 1 mm for statistical analysis. The SPM99 T-Test for two independent samples was used to localize the differences of the brain electrical activity between
ups (schizophrenics compared to controls), voxel-by-voxel. Each voxel is an independent variable to be compared bet-ween groups. The final result is a statistical map with the T-Test value for each voxel and its location in the brain, using the Talairach Atlas coordinates.
RESULTS
Tables 1-2 and figures 1-3 indicate the regions
where the SPM99 T-Test for independent groups
achieves statistical significance at p
≤
0.05 (corrected
for multiple comparisons), according to frequency
bands (delta and theta). In this study, during resting
condition, the schizophrenic patients differed
significantly from the controls only at delta-theta
frequency band in frontal areas. Hyperactivity of slow
frequency (delta and theta) was observed, probably
corresponding to an excess of inhibitory activity at
the right frontal lobe (frontal middle gyrus, frontal
inferior gyrus, and insula) and bilateral frontal areas
(anterior cingulum, with a left sided preponderance).
DISCUSSION
In agreement with other reports in the literature
8-12,
the results of the present study point out to an
in-crease of low band (delta + theta) power in
schizo-phrenics when compared to normal subjects. EEG
slowing was found in the frontal lobe area,
specifi-cally in the bilateral anterior cingulate cortex, right
middle frontal gyrus, inferior frontal gyrus, and
insu-la. These results are in accordance with recent
ana-tomical and functional studies, which consistently
described abnormalities of these brain areas, mainly
at the anterior cingulum, in schizophrenics
11,24-27.
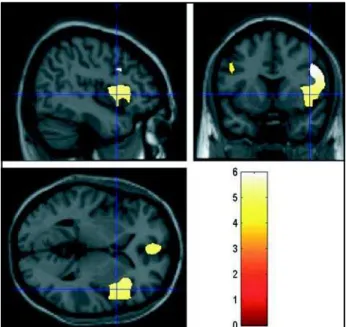
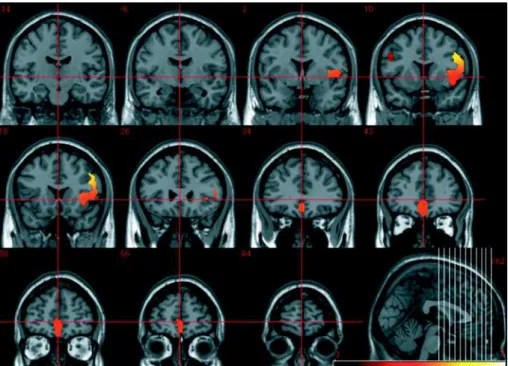
The-Fig 3. SPM T-statistics coronal slices of brain regional electric activity for slow frequency band (delta and theta), comparing 25 chronic medicated schizophrenics to 40 controls. The colored scale represents T values.
Table 1. Brodmann areas and neuroanatomical sites.
Frequency band T-value Corrected p Side Brodmann Area Region
at voxel level
Delta & theta 5.95 0.000 Right 9 and 13 Middle frontal gyrus
(0.5 – 7.5 Hz) Inferior frontal gyrus
Insula
Delta & theta 5.08 0.000 Bilateral 32 Anterior cingulum
(0.5 – 7.5 Hz) left preponderance
ta activity is associated with modulatory attentional
demands and the individual’s emotional state. Our
results indicate an increment in the theta band when
compared to controls, which suggests decreased
me-tabolic activity of frontal areas. Therefore,
schizoph-renic patients are susceptible to express low levels
of attention.
On the other hand, controversial results differ
from our present investigation. A recent LORETA
ana-lysis of unmedicated schizophrenic subjects that
points out to a more global cortical hypofunction in
schizophrenia
28. An excess of activity in delta and
theta bands at frontal areas, as observed in this study,
is probably an indication of an active inhibitory
pro-cess preponderance that is abnormal for the
schizo-phrenics’ EEGq recording condition (awake and
clo-sed eyes). Even though, Pascual-Marqui (1999)
pre-vious findings found no differences among
unmedi-Tabela 2 Brain neuroelectric patterns: Delta/Theta frequency bands.
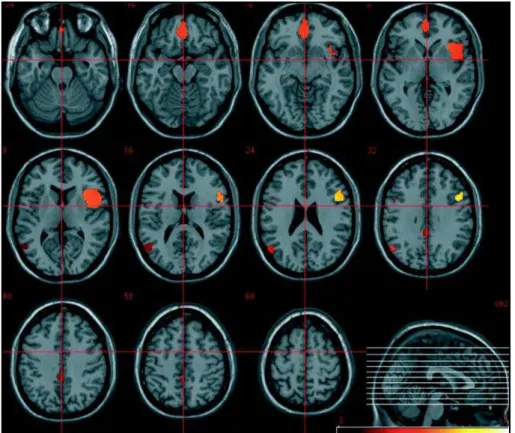
Voxel-by-voxel SPM T-statistics image of brain regional electric activity for slow frequency band (delta and theta), comparing 25 chronic medicated schizophrenics to 40 controls.
cluster-level voxel-level x,y,z (mm)
p corrected KE p uncorrected p corrected T (Z≡) p uncorected 0.000
0.000 0.000 0.000
0.000 16441644164416441644 0.0000.0000.0000.0000.000 0.0000.0000.0000.0000.000 5.945.945.945.945.94 (5.28)(5.28)(5.28)(5.28)(5.28) 0.0000.0000.0000.0000.000 48 8 32
0.000 5.94 (5.27) 0.000 46 10 36
0.000 5.93 (5.27) 0.000 48 14 34
0.000 5.92 (5.26) 0.000 44 16 30
0.000 5.25 (4,77) 0.000 40 -2 8
0.000 5.25 (4.76) 0.000 32 18 8
0.000 5.23 (4.75) 0.000 32 20 4
0.000 5.21 (4.74) 0.000 34 12 8
0.000 5.21 (4.73) 0.000 52 -2 8
0.000 5.21 (4.73) 0.000 34 22 8
0.000 5.12 (4.66) 0.000 34 18 -6
Voxel-by-voxel SPM T-statistics image of brain regional electric activity for slow frequency band (delta and theta), comparing 25 chronic medicated schizophrenics to 40 controls.
cated schizophrenic patients compared to controls.
Thus, these results cannot be attributed to
medica-tion itself. Moreover, this kind of pattern is normally
seen in adult sleep or in awake children. Along this
vein, cortical hypofunction is related to deficits in
working memory, which is described as the ability
of the central nervous system to access information
stored in a “buffer sector”
29. In this context, our
fin-dings indicate an increase of low band frequencies
at the right temporal lobe. This is not in agreement
with previous studies which demonstrated that
schi-zophrenic patients present a decreased activity in
the left temporal lobe.
Taken together, the LORETA analyses in
schizo-phrenic patients are largely consistent with findings
from the literature showing electrophysiological
evi-dence of cortical hypoactivation especially in the
frontal cortex. The overall understanding is that, since
all information processing is state-dependent, this
disrupted brain state in schizophrenic patients
pro-vides the disposition that newly arriving (external or
internal) information will be potentially treated in
deviant ways. Due to their deviant state, the patients
must have access to processing strategies and
context material that is not available to normal
individuals during adult wakefulness
11,30.
REFERENCES
1. Ingvar DH, Frazen G. Distribution of cerebral activity in chronic schizophrenia. Lancet 1974;21:1484-1486.
2. Ingvar DH, Frazen G. Abnormalities of cerebral blood flow distribution in patients with chronic schizophrenia. Acta Psychiatr Scan 1974;50:425-462. 3. Ingvar DH. Evidence for frontal/prefrontal cortical dysfunction in
chronic schizophrenia: the phenomenon of “hypofrontality” reconsidered. In Helmchen H, Henn FA, (eds). Biologic perspectives of schizophrenia. Life Sciences Research Report 40. Chichester: John Wiley & Sons, 1987:201-213.
4. Cleghorn JM, Garnett ES, Nahmias C, et al. Increased frontal and reduced parietal glucose metabolism in acute untreated schizophrenia. Psychiatry Res 1989;28:119-133.
5. Andreasen NC, Rezai K, Alliger R, et al. Hypofrontality in neuroleptic-naïve patients and in patients with chronic schizophrenia. Assessment with xenon 133 single-photon emission computed tomography and the Tower of London Test. Arch Gen Psychiatry 1992;49:943-958. 6. Sabri O, Erkwoh R, Schreckenberger M, Owega A, Sass H, Buell U.
Correlation of positive symptoms exclusively to hyperfusion or hypoperfusion of cerebral cortex in never-treated schizophrenics. Lancet 1997;349:1735-1739.
7. Goldberg TE, Gold JM. Neurocognitive deficits in schizophrenia. In Hirsch SR, Weinberger DR (eds). Schizophrenia, Oxford: Blackwell Science, 1995.
8. Etevenon P, Pidoux B, Rioux P, Peron-Magnan P, Verdeaux G, Deniker P. Intra and inter-hemispheric EEG differences quantified by spectral analysis: comparative study of two groups of schizophrenics and control group. Acta Psychiatr Scand 1979;60:57-68.
9. Guich SM, Buchsbaum MS, Burgwald L, et al. Effect of attention on frontal distribution of delta activity and cerebral metabolic rate in schizophrenia. Schizophrenia Res 1989;2:439-448.
10. John ER, Prichep LS, Alper KR, et al. Quantitative electrophysiological cha-racteristics and subtyping of schizophrenia. Biol Psychiatry 1994;36:801-826. 11. Pascual-Marqui RD, Lehmann D, Koenig T, et al. Low Resolution Brain Electromagnetic Tomography (LORETA): functional imaging in acute, neuroleptic-naïve, first-episode, productive schizophrenia. Psychiatry Res 1999;90:169-179.
12. Wuebben Y, Winterer G. Hypofrontality: a risk marker related to schizophrenia ? Schizophrenia Res 2001;48:207-217.
13. Ingvar DH, Sjolund B, Ardo A. Correlation between dominant EEG frequency, cerebral oxygen uptake and blood flow. Electroenceph Clin Neurophysiol 1976;41:268-276.
14. Lemere F. Cortical energy production in the psychoses. Psychosom Med 1941;3:152-162.
15. Fenton GW, Fenwick PBC, Dollimore J, Dunn, TL, Hirsch SR. EEG spectral analysis in schizophrenia. Br J Psychiatry 1980;136:445-455. 16. Dierks T, Maurer K, Ihl R, Schmidtke A. Evaluation and interpretation
of topographic EEG data in schizophrenic patients. In Maurer K (ed). Topographic brain mapping of EEG and evoked potentials Berlin: Springer 1989:507-517.
17. Gevins A, Smith ME, McEvoy LK, Leong H, Le Jian. Electro-encephalographic imaging of higher brain function. Phil Trans R Soc Lond 1999;354:1125-1134.
18. Michel CM, Koukkou M, Lehmann D. EEG reactivity in high and low symptomatic schizophrenics, using source modeling in the frequency domain. Brain Topogr 1993;5:389-394.
19. Dierks T, Strik WK, Maurer K. Electrical brain activity in schizophrenia described by equivalent dipoles of FFT-data. Schizophrenia Res 1995;14:145-154.
20. Pascual-Marqui RD, Michel CM, Lehmann D. Low resolution electromagnetic tomography: a new method for localizing electrical activity in the brain. Int J Psychophysiol 1994;18:49-65.
21. Pascual-Marqui RD. Source localization: continuing discussion of the inverse problem. ISBET Newsletter 1995;6:9-30.
22. Talairach J, Tournoux P. Co-planar stereotaxic atlas of the human brain. Stuttgart: Thieme. 1988.
23. Friston KJ, Poline JB, Holmes AP, Price CJ, Frith, CD. Detecting activation in PET and fMRI: levels of inference and power. Neuroimage 1996;4:223-235. 24. Benes FM, Bird ED. An analysis of the arrangement of neurons in the cingulate
cortex of schizophrenic patients. Arch Gen Psychiatry 1987;43:31-35. 25. Dolan RJ, Fletcher P, Frith CD, Friston KJ, Frackowiak RS, Grasby PM.
Dopaminergic modulation of impaired cognitive activation in the an-terior cingulate cortex in schizophrenia. Nature 1995;378:180-182. 26. Carter CS, Mintun M, Nichols T, Cohen JD. Anterior cingulate gyrus
dysfunction and selective attention deficits in schizophrenia: w15OxH O PET study during single trial stroop task performance. Am J Psychiatry 1997;154:1670-1675.
27. Mulert C, Gallinat J, Pascual-Marqui R, et al. Reduced event-related current density in the anterior cingulate cortex in schizophrenia. Neuroimage 2001;13:589-600.
28. Mientus S, Gallinat J, Wuebben Y, et al.Cortical hypoactivation during resting EEG in schizophrenics but not in depressives and schizotypal subjects as revealed by low resolution electromagnetic tomography (LORETA). Psychiatry Res 2002;116:95-111.
29. Smith M, McEvoy L, Gevins A. Neurophysiological indices of strategy development and skill acquisition. Cogn Brain Res 1998;7:389-404. 30. Koukkou M, Tremel E, Manske W. A psychobiological model of the