www.atmos-chem-phys.net/11/5011/2011/ doi:10.5194/acp-11-5011-2011
© Author(s) 2011. CC Attribution 3.0 License.
Chemistry
and Physics
Estimate of anthropogenic halocarbon emission based on measured
ratio relative to CO in the Pearl River Delta region, China
M. Shao1, D. Huang1, D. Gu1, S. Lu1, C. Chang2, and J. Wang3
1State Joint Key Laboratory of Environmental Simulation and Pollution Control, College of Environmental Science and
Engineering, Peking University, Beijing 100871, China
2Research Center for Environmental Changes, Academia Sinica, Taipei 115, Taiwan 3Department of Chemistry, National Central University, Chungli 320, Taiwan
Received: 28 July 2010 – Published in Atmos. Chem. Phys. Discuss.: 26 January 2011 Revised: 6 May 2011 – Accepted: 9 May 2011 – Published: 30 May 2011
Abstract. Using a GC/FID/MS system, we analyzed the
mixing ratio of 16 halocarbon species in more than 100 air samples collected in 2004 from the Pearl River Delta (PRD) region of southern China. The results revealed that there are elevated mixing ratios for most of halocarbons, es-pecially for HClC = CCl2(trichloroethylene, TCE), CH2Cl2
(dichloromethane, DCM), CH3Br (bromomethane),
HCFC-22, CHCl3 (trichloromethane), CCl4 (tetrachloromethane),
Cl2C = CCl2 (perchloroethylene, PCE), CH3CCl3 (methyl
chloroform, MCF), and CFC-12. Comparisons were done with the data from TRACE-P and ALE/GAGE/AGAGE ex-periments, we found that the large variability in mixing ratios (relative standard deviation ranged from 9.31 % to 96.55 %) of the halocarbons suggested substantial local emissions from the PRD region in 2004. Correlations between the mixing ratio of each species and carbon monoxide (CO) was examined, and then the emission of each halocarbon was quantified based on scaling the optimized CO emis-sion inventory with the slope of the regresemis-sion line fitted to each species relative to CO. The calculated results re-vealed that mass of CH2Cl2 (7.0 Gg), CH3CCl3 (6.7 Gg),
and Cl2C = CCl2(2.3 Gg) accounted for about 62.9 % of total
halocarbon emissions, it suggested a significant contribution from solvent use in the PRD region. Emissions of HCFC-22 (3.5 Gg), an alternative refrigerant to chlorofluorocarbons (CFCs), were about 2.3 times greater than those of CFC-12 (1.6 Gg). CFC-12 and HCFC-22 accounted for 21.5 % of to-tal emissions of halocarbons, so that the refrigerant would be the second largest source of halocarbons. However, the ratio approach found only minor emissions of CFCs, such as CFC-11, and the emission of CFC-114 and CFC-113 were close to zero. Emissions of other anthropogenic halocarbons, such
Correspondence to:M. Shao
(mshao@pku.edu.cn)
as CCl4, CHCl3, CH3Br, and CH3Cl, were also estimated.
Where possible, the emissions estimated from the measured ratios were compared with results from source inventory techniques, we found that both approaches gave emissions at similar magnitude for most of the halocarbons, except CFC-11. The comparison suggested that the ratio method may be a useful tool for assessing regional halocarbon emissions, and emission uncertainty could be further reduced by incorporat-ing both longer-term and higher-frequency observations, as well as improving the accuracy of the CO inventory.
1 Introduction
The importance of halocarbons in the atmosphere has been recognized since the 1970s, when Lovelock measured out the ambient concentrations of chlorofluorocarbons (CFCs) using a gas chromatogram coupled with electron capture de-tector. As a subclass of volatile organic compounds, halo-carbons play an important role in the destruction of strato-spheric ozone, some of them also function as the potential greenhouse gases. Both of the two effects have propelled halocarbons to the forefront of atmospheric chemistry re-search. Protocols, such as the Vienna Convention, the Ky-oto PrKy-otocol, the Montreal PrKy-otocol, and their subsequent amendments, were developed to establish mechanisms for international cooperation, with the aim of reducing the use of halocarbons. Environmental agencies in many countries have prepared national emissions inventories of halocarbons, and these statistical emissions estimates were used to help to accelerate the halocarbon phase-out.
or if there are errors in the application of end-use cate-gories. Validating emission inventories is therefore essen-tial by the inter-comparison between emission inventors de-rived from conventional approaches (bottom-up) and mod-eled emissions based on other databases such as atmospheric measurements (top-down). On global scale, emissions can be determined from measured atmospheric concentrations using simple box models or three-dimensional models. Regional-scale emissions can be derived using observed halocarbon concentrations and a modeling back-attribution technique.
Recently, a method based on the ratio between the halocar-bons and a substance with known emissions (carbon monox-ide (CO) or HCFC-22) was developed to verify emission inventories of trace gases. However, this method is depen-dent on several assumptions: (1) within a certain period of time, no chemical reaction occurs, (2) the air mass over the site should represent the average emissions of anthropogenic halocarbons, (3) there are no natural sources of any mea-sured halocarbons, the short term enhancement of their atmo-spheric mixing ratio is due to anthropogenic emissions, and (4) the emissions of anthropogenic CO should be known.
While this method has been used to assess halocarbon emissions in North America, Europe, and Australia, emis-sions in East Asia were also of great interest because of the region’s rapid economic development. Palmer et al. first as-sessed the halocarbon emissions in Eastern Asia using air-craft observations with the halocarbon/CO enhancement ra-tio method, by using observara-tional data for March–April 2001, from the TRACE-P campaign; their emission esti-mates for methyl chloroform (CH3CCl3)and CFC-12 were
in agreement with existing inventories, but both the carbon tetrachloride (CCl4) and CFC-11 estimates were 25–50 %
higher than the traditional emissions inventories. Using the same methods, also estimated emissions of ethane, ethyne, propane, CH3Br, CH3Cl, Halon-1211, and other long-lived
halogenated species in Asian continental outflow. By using the trace gas data observed by the AGAGE program at Cape Grim, the correlations between the halocarbon gases and CO emissions are examined to deduce regional emissions. Air-craft or ground monitoring halocarbon data for Sagami Bay, Japan, Hateruma Island in East Asia, and various location in the United States and Mexico were used to estimate an-thropogenic sources based on the same enhancement ratio approach.
The Pearl River Delta (PRD) region of Guangdong Province, China, the largest and most economically impor-tant metropolitan area in Southeast China, was featured by a large manufacturing industry, including the production of electronics, air conditioners, refrigerators, and automobiles. However, the rapid industrialization and urbanization of the PRD region has resulted in the deterioration of regional air quality, including high levels of volatile organic compounds (VOCs), ground-level ozone, and fine particles. Among the pollutants, halocarbons have attracted international attention, because China, as an Article 5 country under the Montreal
Gua ngZ hou
FuoSha n
Z ha oQing H uiZ hou
DongGua n
She nZ he n Z hongSha n
Z huH a i J ia ngMe n
H ongK ong
GZ
X K
Fig. 1. Map showing the geographical locations of sampling sites and the PRD region. The star symbols indicate the intensive sites of Guangzhou (GZ) and XinKen (XK) respectively. GZ is thought to be the representative of a major metropolitan site, but XK is used to represent remote receptor site in the rapid developing region.
Protocol, is still allowed to produce and use some halocar-bons under the terms of the protocol and its amendments. Many studies have shown significantly enhanced levels of most halocarbons in this region because of the increased pro-duction and extensive industrial uses. Recently, halocarbons from the greater PRD region were analyzed to apportion their sources and model their profiles. However, these studies were not conducted specifically to derive emission estimates in the PRD region.
In this study, we examined 124 whole air samples col-lected in October and November 2004 to perform a “top-down” validation of the halocarbon emission inventories for the PRD region. The emissions results have important impli-cations for tracking progress towards attaining current emis-sion control goals and future targets, as China strives to be-come a CFC- and HCFC-free country.
2 Observations and approaches
2.1 Sampling and analysis
Nine sites were established in the PRD region in 2004 as part of a larger-scale VOC measurement campaign (How-ever, only Guangzhou (23.14◦N, 113.34◦E, GZ) and Xinken (22.65◦N, 113.60◦E, XK) were selected as intensive sites. Figure 1 shows the geographical locations of the sampling sites.
cleaner (Entech 3100A, Entech, Simi Valley, CA, USA). Af-ter each sampling, the canisAf-ters were shipped to our lab-oratory at Peking University (PKU) as quickly as possible (≤15 days). Due to the complexity and rapidity of variation for the halocarbons in the PRD region, more than 100 VOC species and CO were simultaneously anaalyzed for further researches. For the Laboratory analysis, a cryogenic pre-concentrator system (Entech 7100A, Entech) coupled with GC-FID/MS (Hewlett Packard 6890/5973, Hewlett Packard Co. USA) were used. The GC-FID/MS system was equipped with two columns and two detectors. Details of the sam-pling and analytical methods have been described elsewhere. Briefly, the C1-C2non-polar halocarbons were separated on a
HP-1 column (50 m×0.32 mm ID×1.05 µm) and quantified by a quadrupole mass spectrometer (MS, Hewlett Packard 5973) which was operated in selected ion mode. In the second injection, the C2-C4alkanes, alkenes, and acetylene
were separated on the same column but quantified with a flame ionization detector (FID, Hewlett Packard 6890), and the C1-C3semi-polar halocarbons were separated on a
DB-624 (60 m×0.32 mm ID×1.8 mm) and also quantified us-ing a quadrupole mass spectrometer. Helium was used as the purge gas for the 7100A and as a carrier gas for gas chro-matography. Column HP-1 was initially held at 40◦C for 3 min, and then raised to 140◦C at a rate of 10◦C min−1 and held for 5 min. Column DB-624 was programmed from 30◦C to 180◦C at a rate of 6◦C min−1and held for 5 min at 180◦C. Three VOC compounds, bromochloromethane, 1,4-difluorobenzene, and 1-bromo-3-fluorobenzene were used as internal standards for the calibration of our analytical system. The halocarbons were quantified using the prepared stan-dard gas according to the concentrations in the range of ambient air. The working standards were periodically pre-pared with a static dilution of primary standard provided by D. R. Blake’s group at the Department of Chemistry, Univer-sity of California at Irvine, USA. The correlation coefficients of the calibration curves for target species were ranged from 0.995 to 1.000 in the experiments, indicating that the integral peak areas were proportional to the concentrations of the tar-get compounds. The procedure chosen to define the method detection limit (MDL) was given in the Code of Federal Reg-ulations (40 CFR 136 Appendix B) and by the United States Environmental Protection Agency (Method TO-15, Second Edition), and the species’ MDL for our experiments ranged from 2 (CHCl = CCl2, minimum) to 8 (CHCl2CH2Cl,
maxi-mum) pptv.
2.2 Method of emission calculation
Previous studies have indicated that the relative ratios be-tween the enhancements of halocarbons and the increasing of a trace gas should reflect the ratios of their emissions strengths, as long as they are emitted from common sources and not removed during transportation processes. Thus, if the emissions of one species from a region can be determined,
we can calculate out the emissions of other compounds in the same dataset based on the measured ratio of pollution enhancements. In this study, CO was used as the reference compound, as the emission inventories of CO was considered to be relatively well established. Additionally, the bottom-up emissions of CO in China at spatial and time scales similar to those used in this study have been studied in several inven-tories.
2.2.1 Consideration of the background levels and
the interference
There are residual halocarbons present in the global, it lead-ing to the background mixlead-ing ratios of halocarbons in the at-mosphere and this which are unaffected by local or regional sources. The background levels may vary on a timescale de-pending on the species, some of the halocarbons may also have seasonal or annual patterns. These background trations should be filtered out from the observation concen-trations as the halocarbon pollution enhancements in number of previous studies such as, then the measurements (X)after subtracting the background values (X0)are denoted as1X
for each compound, where1X=X−X0. In fact, these
stud-ies were done on a larger spatial scale or longer time scale than our research. However, the data in this work was col-lected over a short enough period (for about a month) of time, the background concentrations did not change significantly, so we think iti was not necessary to adopt pollution enhance-ment by subtracting the background concentrations. Further-more, since the emissions are calculated from the slopes of the correlation between the species, the results were indepen-dent of whether or not a background concentration is sub-tracted.
For more informative, baseline concentrations over the study period for each halocarbon were still shown in Table 1. The 20-th percentile of ALE/GAGE/AGAGE data between October to November 2004 was defined as the Global back-ground values, TRACE-P backback-grounds were used for halo-carbons and the 20-th-percentile of the datasets for the other gases were used to capture the regional background levels for the halocarbons that not included in TRACE-P. The low-est CO mixing ratio in South China Sea air was defined as the CO background value.
Additionally, because biomass burning could be a sig-nificant contributor to ambient CO levels and this part of CO were from local emission instead of background, there-fore, the most severe biomass burning plumes (diagnosed by CH3CN>900 pptv) were removed prior to calculating
Table 1.Comparison of the halocarbons’ background concentrations measured from the Global background observation stations, TRACE-P field campaign, GZ , and XK.
Halocarbon X MaceHead CapeGrimb CapeMatatula RaggedPoint TrinidadHead TRACE-Pc XingKend GuangZhou
CFC-11 252a 250 250 252 252 259 274 280
CFC-12 544 541 542 544 545 545 604 644
CFC-113 79 79 78 79 – 79 97 87
CFC-114 – – – – – 14 13 15
HCFC-22 176 158 – – – 151 228 381
CH3CCl3 21 21 20 20 21 40 46 52
CCl4 93 91 92 93 93 99 88 207
CHCl3 11 6 4 6 12 9 36 50
CH2Cl2 27 10 – – – 28 249 256
CH3Cl 486 534 – – – 535 940 996
CH3Br – – – – – 8 21 21
Cl2C = CCl2 3 1 – – – 5 72 55
HClC = CCl2 1 – – – – – 171 224
CHCl2CH2Cl – – – – – – 9 15
CH3CH2Cl – – – – – – 8 8
CH3CHClCH2Cl – – – – – – 26 24
aThe background concentrations are in pptv.
bThe 20-th percentile of ALE/GAGE/AGAGE data (http://agage.eas.gatech.edu/data.htm) between October to November 2004 was defined as the Global background values. cThe Lowest 25-th percentile of airborne TRACE-P data collected below 1500 m for the background values of Western North Pacific, we consider these results as the PRD regional background levels (Barletta et al., 2006; Blake et al., 2003).
dThe lowest 20-th percentile of the dataset for Guangzhou and Xinken are also shown here.
2.2.2 Emissions calculations
The calculations assume that there is an inherent relationship between the target halocarbon and CO. However, there are independent variables with independent errors for halocar-bonXand CO; thus, it is necessary to determine a correction slope (X/CO) with an orthogonal distance regression (ODR), in which residual distance between the data samples and or-thogonal regression line is minimized. We considered that the slope of the regression line betweenX and CO should replace the emission ratio, and the uncertainties for the slope of X/CO was calculated by the assuming the linear model methods, more algebraic manipulation can be found in. Ac-cording to Sect. 2.2.1, if the emissions of CO from an area are known, then the emissions of other compounds in the same dataset can be calculated as following:
Ex=ECO×(X/CO)×(Mx/MCO)×10−3 (1)
Where CO andXare expressed in the units of ppbv and pptv, respectively, andX/CO represents the molar ratio of the halo-carbons relative to CO. Thus, the molecular weights (Mxand
MCO)of the trace gases should be taken into account when
we determine the mass of emissions, ECO is the inventory
emission of CO.
The uncertainly of the halocarbon emissions is calculated using error propagation method. In fact of the uncertain-ties of emissions are associated with the variables ofX/CO and the CO emission inventory, according to the Eq. (1), the uncertainties can be propagated from the combination of
variables in Eq. (2) as:
σx=
q σE2
CO∗(X/CO)
2+E2
CO×σX/CO2 ×(Mx/MCO)×10 −3(2) where σx is the uncertainty for the estimated halocarbon
emission,σECO andσX/COare the uncertainties ofECOand the X/CO slope, respectively.
Among the anthropogenic CO emissions sources, fos-sil fuel-related CO is mostly emitted in urban and indus-trial areas, which are also large sources of halocarbons. Biomass burning-related CO also contributes to CO pol-lution episodes, while the ratio of biomass-burning CO to halocarbons is considered to be much lower than the ra-tio of whole CO emissions to halocarbons. Thus, we used the fossil fuel-related CO emissions, rather than total an-thropogenic CO emissions, in calculating Eq. (1). While anthropogenic CO emissions (excluding biomass burning) in Guangdong Province were estimated, using the inven-tory synthesis model, range from 5.9×10³Gg (uncertain within a factor of 1.9, in 2000) to 8.7×10³Gg (uncertain within a factor of 0.7, in 2006), CO emission estimates for the greater PRD region are relatively good as a result of detailed technology-based data, the proxy methodology of rapid technology renewal, and the rigorous compilation of energy statistics.
Table 2. Describe statistics results of the halocarbons mixing ratio for PRD region, means comparison were made with TRACE-P and ALE/GAGE/AGAGE data.
HalocarbonX PRD Regions Guangzhou XinKen TRACP-P
b Cape Grimc Mace Head Cape Matatula Ragged Point Trinidad Head
Meaa Median RSD. n Mean Median RSD. n Mean Median RSD. n Mean RSD Mean RSD Mean RSD Mean RSD Mean RSD Mean RSD
CFC11 300 297 9.31 % 124 304 304 8.81 % 60 295 286 9.79 % 49 284 12.32 % 250 0.10 % 252 0.31 % 251 0.15 % 252 0.16 % 252 0.25 %
CFC12 700 682 17.81 % 124 739 721 18.30 % 60 652 636 13.91 % 49 564 6.03 % 542 0.27 % 545 0.15 % 543 0.11 % 545 0.15 % 546 0.28 %
CFC113 97 96 11.62 % 124 92 91 5.45 % 60 102 102 13.43 % 49 90 11.11 % 79 0.23 % 79 0.26 % 79 0.40 % 79 0.21 % – –
CFC114 18 16 25.02 % 124 19 18 25.25 % 60 16 14 20.82 % 49 15 3.33 % – – – – – – – – – –
HCFC22 464 377 62.58 % 124 602 527 53.77 % 60 295 272 29.85 % 49 220 32.27 % 158 0.86 % 178 1.74 % – – – – – –
CH3CCl3 62 56 31.46 % 124 62 56 27.81 % 60 61 55 35.85 % 49 49 10.20 % 21 1.54 % 21 3.76 % 20 1.48 % 20 3.60 % 21 1.34 %
CCl4 194 201 49.52 % 124 263 234 27.71 % 60 110 98 29.43 % 49 114 9.65 % 92 0.23 % 93 3.25 % 92 0.36 % 93 0.42 % 93 0.23 %
CHCl3 96 60 80.78 % 124 124 103 64.91 % 60 62 45 94.96 % 49 48 56.25 % 9 46.56 % 15 30.07 % 5 9.75 % 6 13.60 % 14 18.27 %
CH2Cl2 1028 740 78.09 % 124 855 637 84.69 % 60 1239 1027 68.55 % 49 226 102.65 % 10 12.01 % 34 37.64 % – – – – – –
CH3Cl 1165 1152 18.06 % 124 1180 1190 17.38 % 60 1147 1104 18.95 % 49 952 28.68 % 590 16.63 % 518 7.48 % – – – – – –
CH3Br 47 46 56.32 % 122 48 47 54.40 % 60 44 44 59.21 % 47 13 23.08 % – – – – – – – – – –
Cl2C = CCl2 170 155 75.99 % 124 164 157 70.28 % 60 179 143 81.74 % 49 129 153.49 % – – – – – – – – – –
HClC = CCl2 467 294 96.55 % 124 420 276 75.35 % 60 525 346 109.21 % 49 21 185.71 % – – – – – – – – – –
CHCl2CH2Cl 34 23 90.59 % 113 41 31 80.30 % 60 23 12 106.10 % 38 – – – – – – – – – – – –
CH3CH2Cl 23 17 85.43 % 120 21 16 71.38 % 59 26 19 93.74 % 46 – – – – – – – – – – – –
CH3CHClCH2Cl 53 46 63.48 % 123 56 52 59.78 % 59 295 286 9.79 % 49 – – – – – – – – – – – –
aMean and median of the mixing ratios are in pptv.
bAverage extracted from TRACE-P data were provided by Barletta et al. (2006).
cALE/GAGE/AGAGE data between Octobers to November 2004 were selected for analyzing.
regional CO emission inventory for the PRD region in 2004, using the best available emission factors and activity data. CO emissions determined by sectors such as transportation, industry, residential power, and their activity data in 2004 for the PRD region were combined with the latest emission fac-tors, according to Zhang and Zheng. The result was an emis-sion of 7.0×10³ (uncertain within a factor of 0.5) Gg CO
from Guangdong in 2004. Based on the provincial emissions, the CO emissions for the PRD region were spatially allocated with gross domestic product (GDP), depending on the source characteristics and grid cell size using a Geographic Informa-tion System(GIS). The results showed an estimated CO emis-sion in the PRD region in 2004 is 3.3×10³(±2.0×10³)Gg, slightly lower than the CO estimate of Zheng et al., who re-ported a CO emission of 3.8×10³Gg from the same region in 2006.
3 Results and discussion
3.1 Halocarbon concentration and speciation
Approximately one month, from 4 October to 3 Novem-ber 2004, was chosen for our analysis. The 16 halocar-bons measured by GC-FID/MS, coupled with a cryogenic pre-concentrator system, were: 11, 12, CFC-113, CFC-114, HCFC-22, CH3CCl3, CCl4, CHCl3, CH2Cl2,
CH3Cl, CH3Br, CCl2= CCl2, CHCl = CCl2, CHCl2CH2Cl,
CH3CH2Cl, and CH3CHClCH2Cl. These substances were
chosen for analysis because they were detectable at the lim-its of the GC-FID/MS analysis system, and they account for more than 80 % of all halocarbons in the atmosphere.These samples were taken at two time intervals. The routine ambi-ent atmospheric air samples were collected for 60 min each, at 05:30, 07:30, and 14:00 in Guangzhou, and at 07:30 and 14:00 in Xinken, and the samples for diurnal variation were
taken every 2 h for 30 min from 06:00 to 22:00 at Guangzhou and Xinken on 9 and 21 October and 3 November 2004.
Comparing to the mixing ratio obtained from TRACE-P and ALE/GAGE/AGAGE, the statistical results given in both Tables 1 and 2 showed that the regional mixing ratios of most halocarbons were elevated for their mixing ratios in PRD region, especially for HClC = CCl2, CH2Cl2, CH3Br,
HCFC-22, CHCl3, CCl4, Cl2C = CCl2, CH3CCl3, and
CO (ppbv) 0 500 1000 1500 2000 2500 3000
CFC 11( ppt v ) 200 220 240 260 280 300 320 340 360 380 CO (ppbv) 0 500 1000 1500 2000 2500 3000
C F C12 ( ppt v ) 200 400 600 800 1000 1200 CO (ppbv) 0 500 1000 1500 2000 2500 3000
CFC 113 (p pt v ) 50 60 70 80 90 100 110 CO (ppbv) 0 500 1000 1500 2000 2500 3000
CFC 114 ( ppt v) 5 10 15 20 25 30 35 CO (ppbv) 0 500 1000 1500 2000 2500 3000
HCFC 22 ( ppt v ) -1000 -500 0 500 1000 1500 2000 2500 3000 CO (ppbv) 0 500 1000 1500 2000 2500 3000
C H 3CC l3 ( ppt v ) -40 -20 0 20 40 60 80 100 120 140 160 180 CO (ppbv) 0 500 1000 1500 2000 2500 3000
C C l4 ( ppt v ) -100 0 100 200 300 400 CO (ppbv) 0 500 1000 1500 2000 2500 3000
CHC l3 (p pt v) -200 -100 0 100 200 300 400 500 CO (ppbv) 0 500 1000 1500 2000 2500 3000
CH2C l2 (ppt v ) -2000 -1000 0 1000 2000 3000 4000 5000 CO (ppbv) 0 500 1000 1500 2000 2500 3000
C H 3Cl (ppt v ) 600 800 1000 1200 1400 1600 1800 CO (ppbv) 0 500 1000 1500 2000 2500 3000
H3B r ( ppt v ) -20 0 20 40 60 80 100 120 140 CO (ppbv) 0 500 1000 1500 2000 2500 3000
C HCl= CCl2 (ppt v ) -1000 0 1000 2000 3000 4000 CO (ppbv) 0 500 1000 1500 2000 2500 3000
CH Cl2CH2C l ( ppt v ) -100 -50 0 50 100 150 200 CO (ppbv) 0 500 1000 1500 2000 2500 3000
CH3C H 2Cl (ppt v ) -40 -20 0 20 40 60 80 100 120 CO (ppbv) 0 500 1000 1500 2000 2500 3000
CCl2= CCl2 (ppt v ) -200 0 200 400 600 800 CO (ppbv) 0 500 1000 1500 2000 2500 3000
C H3CH Cl C H 2Cl (p pt v ) -50 0 50 100 150 200 250
CO vs Halocarbon
Regression line 95% Prediction intervals
Fig. 2.Halocarbons and CO relationship of the data set. orthogonal distance regression and 95 % confidence intervals were indicated by the red solid lines and the black long dash line respectively. Statistical outliers were removed prior to performing the regressions.
been used extensively since 2004 as an alternative to CFCs in Guangdong Province, while better substitutes are under development.
Table 3 compares the mixing ratios of selected halocar-bons measured in the PRD region with those reported for Bristol, Athens, Philadelphia, Las Vegas, Marseille, Beijing, Krak´ow, Shanghai, Guangzhou, Panyu, Dinghu, and Xinken. With the exception of Karachi, Pakistan, most halocarbon species had higher mixing ratios and variability in the PRD region.
3.2 Emission estimates for each halocarbon
Table 3.Mixing ratios levels of selected halocarbon measured in cities around the world.
Halocarbon Studies CFC-11 CFC-12 CFC-113 CFC-114 HCFC-22 CHCl3 Con. Rsd Con. Rsd Con. Rsd Con. Rsd Con. Rsd Con. Rsd
Bristol, England (Aug–Sep 2000), Rivett et al. (2003) 301 61 % 566 17 % – – – – – – 45 56 % Philadelphia, United states (Feb 2001), Barletta et al. (2006) 273 14 % 567 12 % 81 4 % 15 7 % – – 27 48 % Las Vegas, United states (February 2001), Barletta et al. (2006) 259 4 % 545 9 % 79 3 % 15 7 % – – 28 111 % Marseille, France (Jun–Jul 2001), Barletta et al. (2006) 288 9 % 564 7 % 84 4 % 16 25 % – – 25 68 % Karachi, Pakistan (Dec 1998–Jan 1999), Barletta et al. (2002) 298 11 % 650 19 % 83 3 % 14 9 % 295 91 % 241 232 % Krak´ow, Poland (Jul 1997–Sep 1999), Lasa and Sliwka (2003) 267 1 % – – 83 2 % – – – – 41 24 % Athens, Greece (Jul–Aug 2000), Glavas and Moschonas (2002) – – – – – – – – – – – – Bristol, England(Oct 2004–Dec 2005), Khan et al. (2009) 255 28 % 545 8 % – – – – 315 153 % 39 143 %
Chinese 45 cities (Jan–Feb 2001), Barletta et al. (2006) 284 12 % 564 6 % 90 11 % 15 3 % – – 48 56 % Shanghai (Jan–Feb 2001), Barletta et al. (2006) 265 3 % 547 3 % 83 4 % 14 4 % – – 38 11 % Shanghai(Plume encountered during TRACE-P on March 2001), 280 4 % 566 4 % 90 13 % 15 1 % – – 76 51 % Barletta et al. (2006)
Beijing, China (Jan 2005–Mar 2007), Qin (2007) 312 15 % 613 12 % 85 12 % – – – – – – Guangzhou, PRD of China (Mar 2001), Chan et al. (2006) 361 26 % 720 14 % 97 13 % 16 6 % 553 76 % 181 271 % Panyu, PRD of China (Sep–Dec 2001.), Chan et al. (2006) 302 9 % 820 80 % 97 16 % 16 0 % 274 23 % 52 29 % Dinghu, PRD of China (Mar 2001), Chan et al. (2006) 291 5 % 580 3 % 93 9 % 16 0 % 205 22 % 33 30 % Guangzhou, PRD of China (Nov 2004), Chan et al. (2008) 310 10 % 751 29 % 93 7 % – – – – – – Xinken, PRD of China (Nov 2004), Chan et al. (2008) 291 10 % 638 15 % 93 10 % – – – – – – Urban and runal site of PRD, China (Oct–Nov 2004) (This study) 300 9 % 700 18 % 97 12 % 18 26 % 464 63 % 96 81 %
Table 3.Continued.
Halocarbon Studies CH3CCl3 CCl4 CH2Cl2 HClC = CCl2 Cl2C = C2Cl2 CH3Cl CH3Br Con. Rsd Con. Rsd Con. Rsd Con. Rsd Con. Rsd Con. Rsd Con. Rsd
Bristol, England (Aug–Sep 2000), Rivett et al. (2003) 54 11 % 98 4 % – – 73 237 % 37 259 % – – – – Philadelphia, United states (Feb 2001), Barletta et al. (2006) 50 14 % 98 7 % 97 55 % – – 116 101 % – – – – Las Vegas, United states (Feb 2001), Barletta et al. (2006) 46 11 % 99 3 % 133 119 % – – 159 114 % – – – – Marseille, France (Jun–Jul 2001), Barletta et al. (2006) 54 91 % 107 6 % 251 129 % 36 156 % 276 163 % – – – – Karachi, Pakistan (Dec 1998–Jan 1999), Barletta et al. (2002) 75 5 % 131 33 % 329 191 % 68 216 % 2720 57 % 22 31 % Krak´ow, Poland (Jul 1997–Sep 1999), Lasa and Sliwka (2003) 72 14 % 108 4 % – – – – – – – – – – Athens, Greece (Jul–Aug 2000), Glavas and Moschonas (2002) – – 40 50 % – – – – 160 75 % – – – – Bristol, England (Oct 2004–Dec 2005), Khan et al. (2009) 25 43 % 92 35 % 289 134 % 35 170 % 34 272 % 534 34 % 16 47 %
Chinese 45 cities (Jan–Feb 2001), Barletta et al. (2006) 49 10 % 114 10 % 226 103 % 21 186 % 129 153 % – – – – Shanghai (Jan–Feb 2001), Barletta et al. (2006) 54 17 % 107 7 % 648 162 % 16 56 % 54 31 % – – – – Shanghai(Plume encountered during TRACE-P on March 2001), 51 20 % 127 16 % 210 69 % 32 109 % 56 68 % – – – – Barletta et al. (2006)
Beijing, China (Jan 2005–Mar 2007), Qin (2007) – – – – – – – – – – – – – –
Guangzhou, PRD of China (Mar 2001), Chan et al. (2006) 93 55 % 138 35 % 234 112 % 268 140 % 1210 61 % – – Panyu, PRD of China (Sep–Dec 2001), Chan et al. (2006) 29 21 % 129 27 % 648 62 % 656 86 % 93 99 % 1140 30 % – – Dinghu, PRD of China (Mar 2001), Chan et al. (2006) 60 35 % 123 24 % – – 84 136 % 48 102 % 1010 29 % – – Guangzhou, PRD of China (Nov 2004), Chang et al. (2008) 43 46 % 156 45 % – – – – – – – – – – Xinken, PRD of China (Nov 2004), Chang et al. (2008) 70 70 % 124 22 % – – – – – – – – – – Urban and runal site of PRD, China (Oct–November 2004) (This study) 62 31 % 194 50 % 1028 78 % 467 97 % 170 76 % 1165 18 % 47 56 %
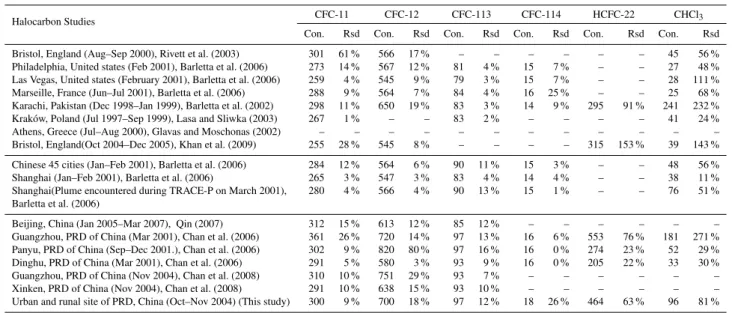
Uncertainty forX/CO ratio was calculated in the standard manner assuming linear model, and presented as the standard deviation (σX/CO). According to Eq. (1), by multiplying the
X/CO ratio and the CO inventory emissions from the PRD region in 2004, regional halocarbon emissions and their un-certainties determined by Eq. (2) were calculated and list in Table 4.
It is noteworthy that the correlation between some species such as CFC-113,CFC-114 and CH3CH2Cl and CO were not
significant (Table 4). In such a case, the slope X/CO would be zero and hence Eq. (1) would give zero emissions for these species. In fact, the ambient mixing ratio of the above three species were much lower than the others, suggesting their lower emissions. Furthermore, the uncertainties were in
same magnitude as the X/CO slopes for these species. Thus there were some defects in our method to made a quantita-tive estimate for the 3 species, but the emission results esti-mated by the measured ratios could only be used a qualitative reference.
3.2.1 Methyl chloroform (CH3CCl3, MCF)
Table 4.Halocarbons versus CO relationships measured in PRD regions during the sampling period and the their estimated emissions based on Measured ratio relative to CO.a,b,c and d
HalocarbonX X/COa Uncertaintyb rc nd Mx Emission Uncertainty
(g mol−1) (Gg) (Gg)
CFC-11 0.0222 0.0048 0.416∗∗ 118 137.37 0.4 0.2
CFC-12 0.1100 0.0199 0.485∗∗ 118 120.91 1.6 1.0
CFC-113 0.0015 0.0020 0.163 118 187.38 0.0 0.0
CFC-114 0.0010 0.0008 0.006 118 170.92 0.0 0.0
HCFC-22 0.3480 0.0430 0.618∗∗ 118 86.47 3.5 2.2
CH3CCl3 0.0228 0.0028 0.550∗∗ 118 133.40 0.4 0.2
CCl4 0.0588 0.0165 0.347∗∗ 118 153.82 1.1 0.7
CHCl3 0.0604 0.0133 0.416∗∗ 118 119.38 0.8 0.6
CH2Cl2 0.7090 0.1280 0.495∗∗ 118 84.93 7.0 4.6
CH3Cl 0.0962 0.0370 0.234∗ 118 50.49 0.6 0.4
CH3Br 0.0121 0.0047 0.256∗ 115 94.94 0.1 0.1
CCl2= CCl2 0.1180 0.0212 0.352∗∗ 118 165.80 2.3 1.5
CHCl = CCl2 0.4380 0.0699 0.477∗∗ 118 131.39 6.7 4.3
CHCl2CH2Cl 0.0381 0.0042 0.723∗∗ 98 133.40 0.6 0.4
CH3CH2Cl 0.0036 0.0038 0.116 109 64.51 0.0 0.0
CH3CHClCH2Cl 0.0309 0.0056 0.497∗∗ 104 112.99 0.4 0.3
CO – – – – 28.010 3265.2 2034.5
aStatistics of the orthogonal distance regression results.
bMore forms appear to lead to correct estimates of the fit parameter uncertainties were discussed in Cantrell (2008).
cris the Pearson correlation coefficient ofX/CO.∗Correlation is significant at the 0.05 level (2-tailed),X/CO is the orthogonal distance regression slopes (pptv ppbv−1). ∗∗
Correlation is significant at the 0.01 level (2-tailed). dThe parameternis the number of effective Samples.
of the hydroxyl radical (OH). But, the ongoing emissions cast a doubt on recent reports for the strong and unexpected neg-ative trend in OH during the 1990s, also as the previously calculated higher OH abundance in the Southern Hemisphere than that in the Northern Hemisphere. Thus, definite conclu-sions about the global OH distribution and trends cannot be drawn until the emissions and distribution of MCF are better quantified.
Previous studies have shown that both the concentra-tion and variability of MCF emissions in the PRD re-gion are significantly greater than those from Taipei, which has a different schedule for implementing the Montreal Protocol. These data indicated that the PRD region was producing MCF emissions. Combining the MCF/CO (0.023±0.003 pptv ppbv−1) slope with the CO emission by Eq. (1), it gave a value of 0.4±0.2 Gg for MCF emission in the PRD region. Comparing with the similar researches in other regions, The MCF/CO slopes for air samples in Korea (0.044 pptv ppbv−1) and Japan (0.023 pptv ppbv−1)
were a little higher than our measurements in the PRD re-gion, but emissions ratios measured over the United States (0.017 pptv ppbv−1) and Mexico (0.002 pptv ppbv−1), and even from the TRACE-P missions over mainland China (0.013 pptv ppmv−1), were lower than what we measured in PRD. The National emissions of MCF based on consump-tion in 2004 were determined to be 4.8 Gg in china; thus, our
results indicate that Guangdong Province contributes about 14.9 % of Chinese MCF emissions, as the contribution of the PRD region was 7.4 %. In fact, the regional and national MCF emissions in China were concerned by using pogenic CO emissions, Palmer et al deduced that the anthro-pogenic MCF emissions from China were about 10.4 Gg, this result was consistent with emission estimates for the “Far East area” 11 Gg in 2000 by McCulloch et al., while the MCF emissions of Japanese and Korean were 1.0 to 1.8 Gg, respec-tively.
situ measurements could be very useful for validating actual MCF emissions in the phase-out process.
3.2.2 CH2Cl2, CCl2= CCl2, and CHCl = CCl2
Chlorinated hydrocarbons, such as dichloromethane (DCM), perchloroethylene (PCE), and trichloroethylene (TCE), are used extensively in painting, dry cleaning, metal degreas-ing, as intermediates in the production of adhesives, foams, plastics, pharmaceuticals, and even as chemical feedstocks for the manufacturing of hydroflurocarbons (HFCs) and re-lated refrigerants. Other sources of these chemicals in the atmosphere include vehicle exhaust and the combustion of coal. Emissions of these chemicals were also found from the ocean and biomass burning, but these natural sources were usually not considered significant in industrial regions. Ac-cording to, the industrial emissions of chlorinated hydrocar-bons around the world (1◦×1◦grid size) could be estimated by using three data sets: regional sales data, gross domes-tic products, and population distributions within each area. Moreover, Wiedmann et al. used an arbitrary factor to con-vert American estimates of PCE production into a global value, Koppmann and Rudolph derived the global emissions of DCM and PCE from their measurements. These chlo-rinated hydrocarbons can be oxidized by OH radicals, and all three of these chlorinated hydrocarbons have atmospheric lifetimes (158, 105, and 4.3 days for DCM, PCE, and TCE respectively) of less than 6 months, which is shorter than their inter-hemispheric exchange time (1.0 year). Thus, the ratio emission estimates method could be helpful on under-standing the atmospheric processes and their seasonal vari-ability.
Using the correction between the CO and PCE inventories, Barnes et al. derived the urban/industrial emissions of PCE from CO inventory emissions and found that urban/industrial emissions of PCE appeared to be rising in 1998. Simi-larly, we used flash-sampling observations for these chlori-nated hydrocarbons and CO to deduce the emissions from the PRD region. We first determined the X/CO ratios, which were 0.71±0.13, 0.12±0.02, and 0.44±0.07 pptv ppbv−1 for DCM, PCE and TCE respectively, and then used Eq. (1) to calculate that the DCM, PCE, and TCE emissions were7.0±4.6, 2.3±1.5, and 6.7±4.3 Gg from PRD region in 2004. The slope of1PCE/1CO for the PRD region was smaller than that for New York City Washington, D.C, which was 0.32±0.06 pptv ppbv−1, and the emissions were also
lower than that in urban/industrial pollution regions in the United States from 1996 to 1997, when emissions ranged from 10.9 to 11.7 Gg. According to and, the industrial re-gions of North America, Europe, and Japan are the largest sources of anthropogenic PCE emissions. Similar to these developed regions, the PRD, also known as the largest de-veloping region in the world, is a significant new source of global PCE, with emissions from Guangdong Province al-ready contributing 10.3 % of the PCE emissions from the
0.00 1.00 2.00 3.00 4.00 5.00 6.00
CFC-11 CFC-12 CFC-113 CFC-114 HCFC-22 CH3CCl3 CCl4
Em
is
si
on (
G
g
)
Halocarbons
Ratio estimates
Inventory estimates CFC-11
CFC-12 CFC-113
CFC-114
HCFC-22
CH3CCl3 CCl4
0.00 0.02 0.20 2.00
0.01 0.10 1.00 10.00
lo
g
(In
v
e
n
to
ry
e
s
ti
m
a
te
s
)(
G
g
)
log(Ratio estimates) (Gg)
y=x
Fig. 3. Comparison of the ratio estimate emissions and inventory estimate emissions for several halocarbons from PRD region.
“Far East” (47.1 Gg), and only the PRD region (2.3 Gg) could contribute more than 4.8 % of the total PCE emissions for East Asia. Among the target halocarbons in the present study, the estimated emissions of DCM, PCE, and TCE accounted for 62.9 % of the total emissions. This suggested that sol-vents used by the electronics industry for paint removal, dry cleaning, and metal degreasing in the PRD area contribute significantly to ambient halocarbons’ concentration.
and TCE. With the development of transportation and the increase of industries, the PRD region had its emissions of DCM (7.0±4.6 Gg) and TCE (6.7±4.3 Gg).
3.2.3 Chlorofluorocarbons (CFCs)
As listed in Annex A, Group I substances in Montreal Pro-tocol, CFC-11, CFC-12, CFC-113 and CFC-114 were also included in our research. According to the protocol, the Chinese government freeze the CFC emissions before 2004. However, consumption of CFCs by Article 5 parties was still allowed, if the end-use was considered “essential” under the terms of the protocol until 2010, when CFCs were supposed to be entirely phased out. Thus, the Chinese government committed to freeze CFC emissions at 1995–1997s levels of actual use and to begin using alternatives.
There were statistically significant corrections between the CO and CFC-11, CFC-12 (Table 4 ), but only weakly positive correlations can be gotten between the CO and CFC-113, CFC-114. The slopes of 11/ CO, CFC-12/ CO, CFC-113/CO, and CFC-114/CO were 0.02±0.00, 0.11±0.02, 0.00±0.00, and 0.00 ±0.00 pptv ppbv−1, re-spectively. Based on these X/CO slopes, regional CO emis-sions and Eq. (1), the emisemis-sions of 11, 12, CFC-113, and CFC-114 for the PRD were 0.4, 1.6, 0.0, and 0.0 Gg, respectively. Our emission results for CFC-12 agreed with the halocarbon emission estimates for the inner PRD of, who reported emission levels of 1.0, 1.5, and 0.9 Gg for CFC-11, CFC-12, and CFC-113, respectively, for 2001 and 2002. Among the four target CFCs, CFC-11 and CFC-12 were the most abundant substances, both of which were used as foam-blowing agents, aerosol propellants, and refrigerants before the introduction of replacements. Thus, any of these prod-ucts that remain in service or continue to experience minor leakage could be major sources of current CFC emissions into the atmosphere. Conversely, there were almost no emis-sions of CFC-113 and CFC-114 in Guangdong Province. The mean concentrations of 113 (97 pptv) and CFC-114 (18 pptv) were slightly greater than background values (Tables 1 and 2).
3.2.4 Hydrochloroflurocarbons (HCFCs)
In recent years, production and consumption of CFCs had been declined, while HCFCs, as temporary replacements for CFCs, has been increased significantly. Here, we focus only on HCFC-22, which is a major substitute for CFC-12, the original refrigerant gas, and is commonly used in commer-cial refrigeration and transport. Leaks from refrigeration sys-tems and occasional emissions from uses such as aerosol pro-pellants, solvents, and foam-blowing agents have lead to a prevalence of HCFC-22 emissions. McCulloch et al. point out that the phase out of CFCs should have lead to a sig-nificant increase in HCFC-22 emissions starting in the early 1990s.
The HCFC-22 emissions in 2004 in the PRD region, deter-mined by the ratio eastimates method, were 3.5±2.2 Gg, ap-proximately 2.3 times as the emissions of CFC-12. Because of the widespread availability of the alternative, HCFC-22, and the more rigorous stepped controls on CFC-12, the ra-tios between HCFC-22 and CFC-12 in developed areas were higher than that in the PRD region (e.g., HCFC-22/CFC12 emission ratios for the United States and Japan were reported to be 5.2 and 4.3, respectively ). These results suggest that CFC-12 must continue to be phased out and replaced with HCFC-22 in the PRD region.
3.2.5 Other halocarbons
Emission estimates and uncertainty ranges for other anthro-pogenic halocarbons in the PRD region were listed in Ta-ble 4. Among these halocarbons, carbon tetrachloride (CCl4)
and chloroform (CHCl3)are used primarily as feed stocks
for producing CFC-11, CFC-12, and HCFC-22. About 75 % of CHCl3in China was consumed in the pharmaceutical
in-dustry to produce HCFC-22, and about 80–90 % of CCl4
is consumed to produce CFC-11 and CFC-12. Because the Montreal Protocol and its various amendments listed CCl4 as a controlled substance, together with the
continu-ing phase-out of CFC-11 and CFC12, large-scale production of this species has been declining rapidly. However, CHCl3
is not regulated under the Montreal Protocol, and regional emissions continue. According to our estimates, emissions of CCl4 and CHCl3 from the PRD region were 1.1±0.7
and 0.8±0.6 Gg respectively, indicating widespread anthro-pogenic use of these halocarbons in this region. A study using matrix factorization receptor model analysis and cor-relations of the mixing ratios of CCl4, CHCl3, and DCM (a
solvent tracer) suggested that solvents were the main source of CCl4in the inner PRD region, but not the most important
contributor of CHCl3.
CH3Br was regulated under the Montreal Protocol as
an Annex E controlled substance, and emissions have been frozen in China since 2004. Our emissions es-timates for CH3Br and CH3Cl were 0.1±0.1 Gg and
0.6±0.4 Gg, respectively. Similar emissions, 0.3±0.06 Gg and 5.4±0.4 Gg for each of CH3Br and CH3Cl have were
reported from Japan. In addition to anthropogenic sources, such as coal combustion and incineration, CH3Br and CH3Cl
have also natural sources, including the oceans, vegetation, and biomass burning. CH3Cl, especially, can be emitted from
oceanic or terrestrial biogenic processes, biomass burning as well as many anthropogenic activities. However, no signif-icant correction between oceanic tracers and biogenic trac-ers was found in the same areas, indicating that the tropi-cal coastal belt is not likely the main CH3Cl source in the
PRD area. In the case of CH3Br, the dominant anthropogenic
emission results from the ratio estimate method. Addition-ally, the concentrations of CH3Br (more than 20 pptv for
20-th-percentile of the dataset) and CH3Cl (more than 900 pptv
for 20-th-percentile of the dataset) in PRD were much higher than at any oceanic background sites (8.40 for CH3Br and
486–535 pptv for CH3Cl; Table 1), further indicating that a
large part of these CH3Br and CH3Cl emissions were not
from oceanic sources.
3.3 Comparison with emission inventories
Where possible, comparisons of the ratio estimates results of the halocarbons were made with estimates from inventory techniques. However, limited data were available from the bottom-up inventory method. Based on production and con-sumption, the available inventory information for four CFCs, CFC-11, CFC-12, CFC-113, and CFC-114, were plotted in Fig. 3. Another reason for choosing these species was that the chinese government allowed to produce the CFCs un-til 1 July in 2007, which include 11, 12, CFC-13,CFC-113, CFC-114 and CFC-115. Additionally, as re-ported by the Ministry of Environmental Protection of China, these four CFCs accounted for more than 99 % of all CFCs consumed. Thus, neither CFC-13 nor CFC-115 was included in this comparison. Because the studied CFCs are primarily consumed in the refrigeration, air-conditioning, foam blow-ing, solvent, tobacco, aerosol, and chemical industry sectors, the inventoried halocarbon emissions from these seven sec-tors were aggregated. A method developed based on the Intergovernmental Panel on Climate Change Good Practice Guidance was introduced to estimate the inventoried emis-sions.
Our ratio estimated emissions of CFC-11 and CFC-12 were 23.4 % and 165.3 % of the respective inventory esti-mates. These results suggested a more rapid phase-out of CFC-11 than CFC-12. Also, predictions of industry inven-tory models that included data on annual leak rates and re-lease profiles from the seven sectors may also overestimated for CFC-11, but not for CFC-12. Other explanations for the higher inventory estimates for CFC-11 may be an overesti-mate of the residual stock of blown-in foam, and the lower inventory estimates for CFC-12 may be due to the presence of many unexpected sources of refrigeration systems in the PRD region (e.g., the number of remaining vehicles with CFC-22 charged air-conditioning systems is still uncertain).
Prior to the ban on CFC-113 and CFC-114, the primary use of both of these CFCs was as a cleansing agent for electrical and electronic components. In this manner, these species would be released directly into the atmosphere upon use; thus, it is reasonable to assume that the ratio esti-mates closely follow consumption. The 113 and CFC-114 annual emissions from the PRD region in 2004 were 0.12 and 0.00 Gg, respectively, compared with the values of 0.04±0.05 and 0.02±0.02 Gg from the present study. The
production and consumption of these two CFCs were much lower than those of CFC-11 and CFC-12, and they were also brought under the control of the Montreal Protocol in China before 11 and 12. Thus, both 113 and CFC-114 were approaching zero emissions in the PRD region in 2004. The lower emission levels of these two CFCs were confirmed by both ratio and inventory estimate methods.
Since the Montreal Protocol came into effect, not only the production but also the consumption of CFCs had been de-clined in China. However, demand for HCFC-22 appeared to be governed by organic growth, and the decreasing CFCs trends were countered by the substitution of HCFCs. Evi-dently, the Chinese HCFC-22 emissions were substantial (in-ventory estimate 33.8 Gg in 2004), but the contribution of Guangdong Province alone accounted for more than 14.5 % of the national inventory estimate. The PRD, the most active region in Guangdong Province, emitted about 3.9 Gg HCFC-22, based on bottom-up estimates. Our ratio estimates were about 89 % of the inventoried emissions. Thus, there was good consistency between different methods for HCFC-22 emissions, but the ratio estimation method had greater un-certainty (2.2 Gg).
Emissions inventories of MCF and CCl4were also
aggre-gated sector by sector for comparison. These halocarbons were used primarily as industrial cleaning solvents, and were therefore emitted into the atmosphere immediately. As a re-sult, the consumption data should provide a reliable estimate of emissions. The inventory consumption data suggested emissions of 0.38 and 1.14 Gg for MCF and CCl4,
respec-tively, which were in good agreement with the emissions results (0.35 and 1.05 Gg for MCF and CCl4, respectively)
from the enhancement ratio estimate method.
A comparison of the available species for the study pe-riod in 2004 was shown in Fig. 3. Considerable interspecies variation under the enhancement ratio technique wasevident. Furthermore, linear curve fitting (y= 0.99x+ 0.19;R=0.91) of the estimated emissions for the different species and meth-ods were also showed that the overall estimate was very close to the unbiased estimate (y=x). Emission estimates using two different approaches were of similar magnitude for most halocarbons (except CFC-11 and CFC-12). Thus, we are cautiously optimistic that the method used here has potential for assessing regional halocarbon emissions.
4 Conclusions
and higher mixing ratios than those from background sites. The RSDs of CFC-11, CFC-12, CFC-113, CFC-114, and CH3Cl were less than 25 %. By contrast, the RSDs of
HCFC-22 (more than 60 %) and other halocarbon gases were signif-icantly greater. These results indicate that emissions, mixing, and removal of anthropogenic halocarbons were still occur-ring in the PRD region in 2004.
Given the several assumptions listed in the introduction, local anthropogenic CO emissions can be used to deduce re-gional halocarbon emissions in the PRD area. Briefly, lin-ear correlations between the halocarbons and CO were ob-tained by analyzing the air samples, and halocarbon emis-sions were deduced from the regression slopes (X/CO) and CO emissions inventories. Where possible, comparisons of these estimates were made with estimates from inventory techniques. Results showed that the ratio estimates of CFC-11 and CFC-12 were 23.4 % and 165.3 % of the respective in-ventory estimates. Very low emissions of 113 and CFC-114 were detected in the PRD region in 2004, 0.04±0.05 and 0.02±0.02 Gg, respectively, comparing with 0.1 Gg and no emission from inventory estimates. As CFC consumption decreases, consumption of HCFC-22, the temporary substi-tute for CFCs, appeared to be governed by organic growth in the region. The PRD emitted about 3.9 Gg HCFC-22, based on the bottom-up estimate for 2004, and the ratio estimate was about 89 % of the inventory result. Thus, there was good consistency in HCFC-22 emissions between the different es-timate methods. Similarly, the emission results from the en-hancement ratio estimate and the inventory algorithm were also in good agreement for MCF and CCl4. Although there
were no inventory data for other species for comparison with different emissions estimates, comparisons revealed similar results for many halocarbons from the ratio estimate method and the inventory technique, better is possible that the calcu-lated results for both methods were same in order of magni-tude.
Among the studied halocarbons emitted in the PRD re-gion, the combined estimated emissions of DCM, PCE, and TCE accounted for about 63 % of the total emissions, sug-gesting that these species were used extensively in industrial and commercial processes. Emissions of HCFC-22 (3.5 Gg), the primary alternative refrigerant to CFCs, were about 2.3 times higher than the emission of CFC-12 (1.6 Gg) in the PRD, these refrigerants could account for about 20 % of the total mass of halocarbon emissions as the second largest contributor. Moreover, emissions of other anthropogenic halocarbons (CHCl3, CH3Br, and so on) from Guangdong
Province were also estimated.
In conclusion, atmospheric observations play an impor-tant role in assessing halocarbons emissions on a regional scale, especially in a fast growing region, such as the PRD. Comparison with available inventories further verified re-gional halocarbon emissions, and can help provide informa-tion on regional conformity to the Montreal Protocol. With more sampling sites, longer-term and higher-frequency
ob-servations, and improvements and updates to CO invento-ries, the uncertainty of the ratio estimates could be reduced significantly.
Acknowledgements. This works was supported by China High-Tech project (2006AA06A309) and Daikuan huang’s participation in this work was supported by Chinese Postdoctoral Science Foundation Grant (No. 20090460148).
Edited by: S. C. Liu
References
Allen, D., Pickering, K., and Fox-Rabinovitz, M.: Evaluation of pollutant outflow and CO sources during TRACE-P using model-calculated, aircraft-based, and Measurements of Pollution in the Troposphere (MOPITT)-derived CO concentrations, J. Geophys. Res.-Atmos., 109, D15S03, doi:10.1029/2003JD004250, 2004. Aucott, M. L., McCulloch, A., Graedel, T. E., Kleiman,
G., Midgley, P., and Li, Y.-F.: Anthropogenic emissions
of trichloromethane (chloroform, CHCl3) and
chlorodifluo-romethane (HCFC-22): Reactive Chlorine Emissions Inventory. J. Geophys. Res.-Atmos., 104(D7), 8405–8415, 1999.
Barletta, B., Meinardi, S., Simpson, I. J., Khwaja, H. A., Blake, D. R., and Rowland, F. S., Mixing ratios of volatile organic com-pounds (VOCs) in the atmosphere of Karachi, Pakistan, Atmos. Environ., 36(21), 3429–3443, 2002.
Barletta, B., Meinardi, S., Simpson, I. J., Sherwood Rowland, F., Chan, C.-Y., Wang, X., Zou, S., Chan, L. Y., and Blake, D. R.: Ambient halocarbon mixing ratios in 45 Chinese cities, Atmos. Environ., 40(40), 7706–7719, 2006.
Barnes, D. H., Wofsy, S. C., Fehlau, B. P., Gottlieb, E. W., Elkins, J. W., Dutton, G. S., and Montzka, S. A., Urban/industrial pollu-tion for the New York City-Washington, D. C., corridor, 1996– 1998: 1. Providing independent verification of CO and PCE emissions inventories, J. Geophys. Res.-Atmos., 108(D6), 4185, doi:10.1029/2001JD001116, 2003.
Blake, N. J., Blake, D. R., Simpson, I. J., Meinardi, S., Swanson, A. L., Lopez, J. P., Katzenstein, A. S., Barletta, B., Shirai, T., Atlas, E., Sachse, G., Avery, M., Vay, S., Fuelberg, H. E., Kiley, C. M., Kita, K., and Rowland, F. S.: NMHCs and halocarbons in Asian continental outflow during the Transport and Chemical Evolution over the Pacific (TRACE-P) Field Campaign: Com-parison With PEM-West B. J. Geophys. Res.-Atmos., 108(D20), 8806, doi:10.1029/2002JD003367, 2003.
Cantrell, C. A.: Technical Note: Review of methods for linear least-squares fitting of data and application to atmospheric chemistry problems, Atmos. Chem. Phys., 8, 5477–5487, doi:10.5194/acp-8-5477-2008, 2008.
Chan, L. Y. and Chu, K. W.: Halocarbons in the atmosphere of the industrial-related Pearl River Delta region of China, J. Geophys. Res.-Atmos., 112, D04305, doi:10.1029/2006JD007097, 2007. Chan, C. Y., Tang, J. H., Li, Y. S., and Chan, L. Y., Mixing ratios
and sources of halocarbons in urban, semi-urban and rural sites of the Pearl River Delta, South China, Atmos. Environ., 40(38), 7331–7345, 2006.
Park and Its Implication in Compliance with the Montreal Proto-col, Environ. Sci. Technol., 35(16), 3273–3279, 2001.
Chang, C. C., Lai, C. H., Wang, C. H., Liu, Y., Shao, M., Zhang, Y. H., and Wang, J. L.: Variability of ozone depleting substances as an indication of emissions in the Pearl River Delta, China, Atmos. Environ., 42(29), 6973–6981, 2008.
Daniel, J. S., Velders, G. J. M., Solomon, S., McFarland, M., and Montzka, S. A.: Present and future sources and emissions of halocarbons: Toward new constraints, J. Geophys. Res.-Atmos., 112(D2), D02301, doi:10.1029/2006jd007275, 2007.
Dunse, B. L., Steele, L. P., Wilson, S. R., Fraser, P. J., and Krummel, P. B.: Trace gas emissions from Melbourne, Australia, based on AGAGE observations at Cape Grim, Tasmania, 1995–2000, At-mos. Environ., 39(34), 6334–6344, 2005.
Fisher, D. A., Hales, C. H., Wang, W.-C., Ko, M. K. W., and Sze, N. D.: Model calculations of the relative effects of CFCs and their replacements on global warming, Nature, 344(6266), 513–516, 1990.
Gentner, D. R., Miller, A. M., and Goldstein, A. H.: Seasonal Vari-ability in Anthropogenic Halocarbon Emissions, Environ. Sci. Technol., 44(14), 5377–5382, 2010.
Glavas, S. and Moschonas, N.: First measurements of carbon tetrachloride and tetrachloroethene in the atmosphere of Athens, Greece, Sci. Total Environ., 290(1–3), 231–237, 2002.
Grimvall, A. and De Leer, E.: Naturally-produced organohalogens, Springer, Hardcover, Kluwer Academic Publishers, Dordrecht, The Netherlands, 21–33, 1995.
Guo, H., Ding, A. J., Wang, T., Simpson, I. J., Blake, D. R., Barletta, B., Meinardi, S., Rowland, F. S., Saunders, S. M., Fu, T. M., Hung, W. T., and Li, Y. S.: Source origins, modeled profiles, and apportionments of halogenated hydrocarbons in the greater Pearl River Delta region, southern China, J. Geophys. Res.-Atmos., 114, D11302, doi:10.1029/2008JD011448, 2009.
Hartley, D. and Prinn, R.: Feasibility of Determining Surface Emis-sions of Trace Gases Using an Inverse Method in a Three-Dimensional Chemical Transport Model, J. Geophys. Res.-Atmos., 98(D3), 5183–5197, 1993.
Hoffman, J. S.: Replacing CFCs: The Search for Alternatives, Am-bio, 19(6/7), 329–333, 1990.
Hurst, D. F., Lin, J. C., Romashkin, P. A., Daube, B. C., Gerbig, C., Matross, D. M., Wofsy, S. C., Hall, B. D., and Elkins, J. W.: Con-tinuing global significance of emissions of Montreal Protocol-restricted halocarbons in the United States and Canada, J. Geo-phys. Res.-Atmos., 111, D15302, doi:10.1029/2005JD006785, 2006.
Jobson, B. T., McKeen, S. A., Parrish, D. D., Fehsenfeld, F. C., Blake, D. R., Goldstein, A. H., Schauffler, S. M., and Elkins, J. W.: Trace gas mixing ratio variability versus lifetime in the troposphere and stratosphere: Observations, J. Geophys. Res., 104(D13), 16091–16113, 1999.
Khalil, M. A. K., Moore, R. M., Harper, D. B., Lobert, J. M., Erick-son, D. J., Koropalov, V., Sturges, W. T., and Keene, W. C.: Nat-ural emissions of chlorine-containing gases: Reactive Chlorine Emissions Inventory, J. Geophys. Res.-Atmos., 104(D7), 8333– 8346, 1999.
Khan, M. A. H., Mead, M. I., White, I. R., Golledge, B., Nickless, G., Knights, A., Martin, D., Rivett, A. C., Greally, B. R., and Shallcross, D. E.: Year-long measurements of C1-C3 halocar-bons at an urban site and their relationship with meteorological
parameters, Atmos. Sci. Lett., 10(2), 75–86, 2009.
Kopacz, M., Jacob, D. J., Henze, D. K., Heald, C. L., Streets, D. G., and Zhang, Q.: Comparison of adjoint and analyti-cal Bayesian inversion methods for constraining Asian sources of carbon monoxide using satellite (MOPITT) measurements of CO columns, J. Geophys. Res.-Atmos., 114, D04305, doi:10.1029/2007JD009264, 2009a.
Kopacz, M., Jacob, D. J., Henze, D. K., Heald, C. L., Streets, D. G., and Zhang, Q.: Comparison of adjoint and analyti-cal Bayesian inversion methods for constraining Asian sources of carbon monoxide using satellite (MOPITT) measurements of CO columns, J. Geophys. Res.-Atmos., 114, D04305, doi:10.1029/2007jd009264, 2009b.
Koppmann, R., Johnen, F. J., Plass-D¨ulmer, C., and Rudolph,
J.: Distribution of Methylchloride, Dichloromethane,
Trichloroethene and Tetrachloroethene Over the North and South Atlantic, J. Geophys. Res.-Atmos., 98(D11), 20517– 20526, 1993.
Krol, M. C., Lelieveld, J., Oram, D. E., Sturrock, G. A., Penkett, S. A., Brenninkmeijer, C. A. M., Gros, V., Williams, J., and Scheeren, H. A.: Continuing emissions of methyl chloroform from Europe, Nature, 421(6919), 131–135, 2003.
Lasa, J. and Sliwka, I.: Long-term measurements of the concentra-tions of halocarbons in an urban area of Krak´ow, Poland, Appl. Energ., 75(3–4), 155–163, 2003.
Lashof, D. A. and Ahuja, D. R.: Relative contributions of green-house gas emissions to global warming, Nature, 344(6266), 529– 531, 1990.
Liu, Ying, Shao, Min, Lu, Sihua, Chang, Chih-chung, Wang, Jia-Lin, and Chen, Gao: Volatile Organic Compound (VOC) mea-surements in the Pearl River Delta (PRD) region, China, At-mos. Chem. Phys., 8, 1531–1545, doi:10.5194/acp-8-1531-2008, 2008.
Lovelock, J. E.: Atmospheric turbidity and CCl3F concentrations in rural Southern England and Southern Ireland, Atmos. Environ. (1967), 6(12), 917–925, 1972.
Lu, S. H., Liu, Y., Shao, M., and Huang, S.: Chemical specia-tion and anthropogenic sources of ambient volatile organic com-pounds (VOCs) during summer in Beijing, 2004, Frontiers of Environmental Science & Engineering in China, 1(2), 147–152, 2007.
Manning, A. J., Ryall, D. B., Derwent, R. G., Simmonds, P.
G., and O’Doherty, S.: Estimating European emissions of
ozone-depleting and greenhouse gases using observations and a modeling back-attribution technique. J. Geophys. Res.-Atmos., 108(D14), 4405, doi:10.1029/2002JD002312, 2003.
McCulloch, A.: Fluorocarbons in the global environment: a re-view of the important interactions with atmospheric chemistry and physics, J. Fluorine Chem., 123(1), 21–29, 2003.
McCulloch, A. and Midgley, P. M.: The production and global dis-tribution of emissions of trichloroethene, tetrachloroethene and dichloromethane over the period 1988–1992, Atmos. Environ., 30(4), 601–608, 1996.
McCulloch, A. and Midgley, P. M.: Estimated historic emissions of fluorocarbons from the European Union, Atmos. Environ., 32(9), 1571–1580, 1998.
McCulloch, A., Aucott, M. L., Benkovitz, C. M., Graedel, T. E., Kleiman, G., Midgley, P. M., and Li, Y.-F.: Global emissions of hydrogen chloride and chloromethane from coal combustion, incineration and industrial activities: Reactive Chlorine Emis-sions Inventory, J. Geophys. Res.-Atmos., 104(D7), 8391–8403, 1999a.
McCulloch, A., Aucott, M. L., Graedel, T. E., Kleiman, G., Midg-ley, P. M., and Li, Y. F.: Industrial emissions of trichloroethene,
tetrachloroethene, and dichloromethane: Reactive Chlorine
Emissions Inventory, J. Geophys. Res.-Atmos., 104(D7), 8417– 8427, 1999b.
McCulloch,A., Ashford, P., and Midgley, P. M.: Historic emissions of fluorotrichloromethane (CFC-11) based on a market survey, Atmos. Environ., 35(26), 4387–4397, 2001a.
McCulloch, A., Midgley, P. M., and Ashford, P.: Releases of re-frigerant gases (CFC-12, HCFC-22 and HFC-134a) to the atmo-sphere, Atmos. Environ., 37(7), 889–902, 2003.
McCulloch, A., Midgley, P. M., and Lindley, A. A.: Recent changes in the production and global atmospheric emissions of chlorod-ifluoromethane (HCFC-22), Atmos. Environ., 40(5), 936–942, 2006.
Millet, D. B. and Goldstein, A. H.: Evidence of continuing
methylchloroform emissions from the United States, Geophys. Res. Lett., 31, L17101, doi:10.1029/2004GL020166, 2004. Millet, D. B., Atlas, E. L., Blake, D. R., Blake, N. J., Diskin, G.
S., Holloway, J. S., Hudman, R. C., Meinardi, S., Ryerson, T. B., and Sachse, G. W.: Halocarbon Emissions from the United States and Mexico and Their Global Warming Potential, Environ. Sci. Technol., 43(4), 1055–1060, 2009.
Molina, M. J. and Rowland, F. S.: Stratospheric sink for chloroflu-oromethanes: chlorine atomc-atalysed destruction of ozone, Na-ture, 249(5460), 810–812, 1974.
Montzka, S. A., Hall, B. D., and Elkins, J. W.: Accelerated increases observed for hydrochlorofluorocarbons since 2004 in the global atmosphere, Geophys. Res. Lett., 36, L03804, doi:10.1029/2008gl036475, 2009.
O’Doherty, S., Cunnold, D. M., Manning, A., Miller, B. R., Wang, R. H. J., Krummel, P. B., Fraser, P. J., Simmonds, P. G., Mc-Culloch, A., Weiss, R. F., Salameh, P., Porter, L. W., Prinn, R. G., Huang, J., Sturrock, G., Ryall, D., Derwent, R. G., and Montzka, S. A.: Rapid growth of hydrofluorocarbon 134a and hydrochlorofluorocarbons 141b, 142b, and 22 from Advanced Global Atmospheric Gases Experiment (AGAGE) observations at Cape Grim, Tasmania, and Mace Head, Ireland, J. Geophys. Res.-Atmos., 109, D06310, doi:10.1029/2003JD004277, 2004. Ohara, T., Akimoto, H., Kurokawa, J., Horii, N., Yamaji, K.,
Yan, X., and Hayasaka, T.: An Asian emission inventory of anthropogenic emission sources for the period 1980-2020, At-mos. Chem. Phys., 7, 4419–4444, doi:10.5194/acp-7-4419-2007, 2007.
Olaguer, E. P.: The distribution of the chlorinated solvents
dichloromethane, perchloroethylene, and trichloroethylene in the global atmosphere, Environ. Sci. Pollut. R., 9(3), 175–182, 2002. Palmer, P. I., Jacob, D. J., Jones, D. B. A., Heald, C. L., Yantosca, R. M., Logan, J. A., Sachse, G. W., and Streets, D. G.: Invert-ing for emissions of carbon monoxide from Asia usInvert-ing aircraft observations over the western Pacific, J. Geophys. Res.-Atmos., 108(D21), doi:10.1029/2003JD003397, 2003a.
Palmer, P. I., Jacob, D. J., Mickley, L. J., Blake, D. R., Sachse,
G. W., Fuelberg, H. E., and Kiley, C. M.: Eastern Asian emissions of anthropogenic halocarbons deduced from aircraft concentration data, J. Geophys. Res.-Atmos., 108(D24), 4753, doi:10.1029/2003JD003591, 2003b.
Prinn, R. G., Weiss, R. F., Miller, B. R., Huang, J., Alyea, F. N., Cunnold, D. M., Fraser, P. J., Hartley, D. E., and Simmonds, P. G.: Atmospheric Trends and Lifetime of CH3CCI3 and Global OH Concentrations, Science, 269(5221), 187–192, 1995. Prinn, R. G., Huang, J., Weiss, R. F., Cunnold, D. M., Fraser, P.
J., Simmonds, P. G., McCulloch, A., Harth, C., Salameh, P., O’Doherty, S., Wang, R. H. J., Porter, L., and Miller, B. R.: Ev-idence for Substantial Variations of Atmospheric Hydroxyl Rad-icals in the Past Two Decades, Science, 292(5523), 1882–1888, 2001.
Qin, D. J.: Decline in the concentrations of chlorofluorocarbons (CFC-11, CFC-12 and CFC-113) in an urban area of Beijing, China, Atmos. Environ., 41(38), 8424–8430, 2007.
Reimann, S., Manning, A. J., Simmonds, P. G., Cunnold, D. M., Wang, R. H. J., Li, J., McCulloch, A., Prinn, R. G., Huang, J., Weiss, R. F., Fraser, P. J., O’Doherty, S., Greally, B. R., Stemm-ler, K., Hill, M., and Folini, D.: Low European methyl chloro-form emissions inferred from long-term atmospheric measure-ments, Nature, 433(7025), 506–508, 2005.
Rhew, R. C., Miller, B. R., and Weiss, R. F.: Natural methyl bro-mide and methyl chloride emissions from coastal salt marshes, Nature, 403(6767), 292–295, 2000.
Rivett, A. C., Martin, D., Nickless, G., Simmonds, P. G., O’Doherty, S. J., Gray, D. J., and Shallcross, D. E.: In situ gas chromato-graphic measurements of halocarbons in an urban environment, Atmos. Environ., 37(16), 2221–2235, 2003.
Rudolph, J., Koppmann, R., and Plass-D¨ulmer, C.: The budgets of ethane and tetrachloroethene: Is there evidence for an impact of reactions with chlorine atoms in the troposphere?, Atmos. Envi-ron., 30(10–11), 1887–1894, 1996.
Simmonds, P. G., Cunnold, D. M., Weiss, R. F., Prinn, R. G., Fraser, P. J., McCulloch, A., Alyea, F. N., and O’Doherty, S., Global
trends and emission estimates of CCl4from in situ background
observations from July 1978 to June 1996, J. Geophys. Res.-Atmos., 103(D13), 16017–16027, 1998.
Simpson, I. J., Meinardi, S., Blake, N. J., Rowland, F. S., and Blake, D. R.: Long-term decrease in the global atmospheric burden of tetrachloroethene (C2Cl4), Geophys. Res. Lett., 31, L08108, doi:10.1029/2003GL019351, 2004.
Singh, H. B., Thakur, A. N., Chen, Y. E., and Kanakidou, M.: Tetra-chloroethylene as an Indicator of Low Cl Atom Concentrations in the Troposphere, Geophys. Res. Lett., 23(12), 1529–1532, 1996. Stohl, A., Kim, J., Li, S., O’Doherty, S., M¨uhle, J., Salameh, P. K., Saito, T., Vollmer, M. K., Wan, D., Weiss, R. F., Yao, B., Yokouchi, Y., and Zhou, L. X.: Hydrochlorofluorocar-bon and hydrofluorocarHydrochlorofluorocar-bon emissions in East Asia determined by inverse modeling, Atmos. Chem. Phys., 10, 3545–3560, doi:10.5194/acp-10-3545-2010, 2010.
doi:10.5194/acp-9-1597-2009, 2009.
Streets, D. G., Bond, T. C., Carmichael, G. R., Fernandes, S. D., Fu, Q., He, D., Klimont, Z., Nelson, S. M., Tsai, N. Y., Wang, M. Q., Woo, J. H., and Yarber, K. F.: An inventory of gaseous and primary aerosol emissions in Asia in the year 2000, J. Geophys. Res.-Atmos., 108(D21), doi:10.1029/2002JD003093, doi:10.1029/2002JD003093, 2003.
Streets, D. G., Yu, C., Bergin, M. H., Wang, X. M., and Carmichael, G. R.: Modeling study of air pollution due to the manufacture of export goods in China’s Pearl River Delta, Environ. Sci. Tech-nol., 40(7), 2099–2107, 2006a.
Streets, D. G., Zhang, Q., Wang, L. T., He, K. B., Hao, J. M., Wu, Y., Tang, Y. H., and Carmichael, G. R.: Revisiting China’s CO emissions after the Transport and Chemical Evolution over the Pacific (TRACE-P) mission: Synthesis of inventories, atmo-spheric modeling, and observations, J. Geophys. Res.-Atmos., 111(D14), doi:10.1029/2006JD007118, 2006b.
Tanimoto, H., Sawa, Y., Yonemura, S., Yumimoto, K., Mat-sueda, H., Uno, I., Hayasaka, T., Mukai, H., Tohjima, Y., Tsuboi, K., and Zhang, L.: Diagnosing recent CO emissions and ozone evolution in East Asia using coordinated surface observa-tions, adjoint inverse modeling, and MOPITT satellite data, At-mos. Chem. Phys., 8, 3867–3880, doi:10.5194/acp-8-3867-2008, 2008.
Tonooka, Y., Kannari, A., Higashino, H., and Murano, K.: NMVOCs and CO Emission Inventory in East Asia, Water Air Soil Poll., 130(1), 199–204, 2001.
United Nations Environment Programme: The Montreal Protocol on Substances that Deplete the Ozone Layer as adjusted and/or amended in in London 1990, Copenhagen 1992, Vienna 1995, Montreal 1997, Beijing 1999, Ozone Secretariat, United Nations Environment Programme, 2000.
United Nations Environment Programme (UNEP): Report of theforty-fourth meeting of the executive committee, in: State En-vironment Protection Administration (S.E.P.A.), edited by: State Environment Protection Administration, Annex XVII Agree-mentbetween China and the executive committee of the multi-lateralfund for the CFCs/Halons accelerated phased-out plan in China, Prague, 2004.
United Nations Environment Programme (UNEP): Production and Consumption of Ozone Depleting Substances under the Montreal Protocol, Secretariat for The Vienna Convention for the Protec-tion of the Ozone Layer & The Montreal Protocol on Substances that Deplete the Ozone Layer, Nairobi, Kenya, 2005.
Vollmer, M. K., Zhou, L. X., Greally, B. R., Henne, S., Yao, B., Reimann, S., Stordal, F., Cunnold, D. M., Zhang, X. C., Maione, M., Zhang, F., Huang, J., and Simmonds, P. G.: Emissions of ozone-depleting halocarbons from China, Geophys. Res. Lett., 36, L15823, doi:10.1029/2009gl038659, 2009.
Wan, D., Xu, J. H., Zhang, J. B., Tong, X. C., and Hu, J. X.: His-torical and projected emissions of major halocarbons in China, Atmos. Environ., 43(36), 5822–5829, 2009.
Wang, J.-L., Lin, W.-C., and Chen, T.-Y.: Using atmospheric CCl4
as an internal reference in gas standard preparation, Atmos. En-viron., 34(25), 4393–4398, 2000a.
Wang, J. L., Chew, C., Chen, S. W., and Kuo, S. R.: Concentra-tion Variability of Anthropogenic Halocarbons and ApplicaConcentra-tions as Internal Reference in Volatile Organic Compound Measure-ments, Environ. Sci. Technol., 34(11), 2243–2248, 2000b. Wang, Q. Q., Shao, M., Liu, Y., William, K., Paul, G., Li, X. H.,
Liu, Y., and Lu, S. H.: Impact of biomass burning on urban air quality estimated by organic tracers: Guangzhou and Beijing as cases, Atmos. Environ., 41(37), 8380–8390, 2007.
Wang, T., Guo, H., Blake, D. R., Kwok, Y. H., Simpson, I. J., and Li, Y. S.: Measurements of trace gases in the inflow of South China Sea background air and outflow of regional pollution at Tai O, Southern China, J. Atmos. Chem., 52(3), 295–317, 2005. Wang, Y. X., McElroy, M. B., Jacob, D. J., and Yantosca, R. M.: A nested grid formulation for chemical transport over Asia: Applications to CO, J. Geophys. Res., 109, D22307, doi:10.1029/2004JD005237, 2004a.
Wang, Y. X., McElroy, M. B., Wang, T., and Palmer, P. I.: Asian emissions of CO and NOx: Constraints from aircraft and Chinese station data, J. Geophys. Res.-Atmos., 109, D24304, doi:10.1029/2004JD005250, 2004b.
Wiedmann, T. O., Guethner, B., Class, T. J., and Ballschmiter, K.: Global Distribution of Tetrachloroethene in the Troposphere: Measurements and Modeling, Environ. Sci. Technol., 28(13), 2321–2329, 1994.
Yokouchi, Y., Inagaki, T., Yazawa, K., Tamaru, T., Enomoto, T., and Izumi, K.: Estimates of ratios of anthropogenic halocar-bon emissions from Japan based on aircraft monitoring over Sagami Bay, Japan, J. Geophys. Res.-Atmos., 110, D06301, doi:10.1029/2004JD005320, 2005.
Yokouchi, Y., Taguchi, S., Saito, T., Tohjima, Y., Tanimoto, H., and Mukai, H.: High frequency measurements of HFCs at a remote site in east Asia and their implications for Chinese emissions, Geophys. Res. Lett., 33, L21814, doi:10.1029/2006GL026403, 2006.
Zhang, F., Wang, X. M., Yi, Z. G., Li, L. F., Chan, C. Y., Chan, L. Y., and Donald R. B.: Preliminary investigation on levels and trends of atmospheric chlorodifuoromethane (HCFC-22) in the Pearl River Delta, Acta Seientiae Cireumstantiae, 26(6), 987– 991, 2006.
Zheng, J., Shao, M., Che, W., Zhang, L., Zhong, L., Zhang, Y., and Streets, D.: Speciated VOC Emission Inventory and Spatial Patterns of Ozone Formation Potential in the Pearl River Delta, China, Environ. Sci. Technol., 43(22), 8580–8586, 2009a. Zheng, J. Y., Zhang, L. J., Che, W. W., Zheng, Z. Y., and Yin, S.