www.atmos-chem-phys.net/11/4105/2011/ doi:10.5194/acp-11-4105-2011
© Author(s) 2011. CC Attribution 3.0 License.
Chemistry
and Physics
Emission inventory of anthropogenic air pollutants and VOC species
in the Yangtze River Delta region, China
C. Huang1, C. H. Chen1, L. Li1, Z. Cheng2, H. L. Wang1, H. Y. Huang1, D. G. Streets3, Y. J. Wang4, G. F. Zhang1, and Y. R. Chen1
1Shanghai Academy of Environmental Sciences, Shanghai 200233, China
2Department of Environmental Science and Engineering, Tsinghua University, Beijing 100084, China 3Argonne National Laboratory, Argonne, Illinois 60439, USA
4School of Environmental and Chemical Engineering, Shanghai University, Shanghai 200444, China
Received: 20 November 2010 – Published in Atmos. Chem. Phys. Discuss.: 14 January 2011 Revised: 21 April 2011 – Accepted: 21 April 2011 – Published: 4 May 2011
Abstract. The purpose of this study is to develop an emis-sion inventory for major anthropogenic air pollutants and VOC species in the Yangtze River Delta (YRD) region for the year 2007. A “bottom-up” methodology was adopted to compile the inventory based on major emission sources in the sixteen cities of this region. Results show that the emis-sions of SO2, NOx, CO, PM10, PM2.5, VOCs, and NH3in the
YRD region for the year 2007 are 2392 kt, 2293 kt, 6697 kt, 3116 kt, 1511 kt, 2767 kt, and 459 kt, respectively. Ethy-lene, mp-xyEthy-lene, o-xyEthy-lene, toluene, 1,2,4-trimethylbenzene, 2,4-dimethylpentane, ethyl benzene, propylene, 1-pentene, and isoprene are the key species contributing 77 % to the total ozone formation potential (OFP). The spatial distribu-tion of the emissions shows the emissions and OFPs are mainly concentrated in the urban and industrial areas along the Yangtze River and around Hangzhou Bay. The industrial sources, including power plants other fuel combustion facil-ities, and non-combustion processes contribute about 97 %, 86 %, 89 %, 91 %, and 69 % of the total SO2, NOx, PM10,
PM2.5, and VOC emissions. Vehicles take up 12.3 % and
12.4 % of the NOx and VOC emissions, respectively.
Re-garding OFPs, the chemical industry, domestic use of paint & printing, and gasoline vehicles contribute 38 %, 24 %, and 12 % to the ozone formation in the YRD region.
Correspondence to:C. Huang (huangc@saes.sh.cn)
1 Introduction
The complex and regional air pollution issues such as acid deposition, photochemical smog and haze caused by fine par-ticles have become the most crucial topics for atmospheric environment research in the Yangtze River Delta (YRD) re-gion in China. High ozone concentration and fine particle pollution were monitored to demonstrate the deteriorating re-gional air pollution situation in this region (Gao et al., 2009; Geng et al., 2009; Tie et al., 2009). Rapid growth of trans-portation, industries, and urbanization in the YRD region has become the major environmental driving force for the dete-rioration of urban and regional air quality. Therefore, the quantification of anthropogenic air pollutant emissions will be fundamental to the understanding of air pollutant emission levels, forecasting air quality status, and guiding air pollutant control strategies.
As the key to air pollutant emission control and manage-ment, emission inventories are being paid increasing atten-tion by policy-makers and researchers. In the last decade, some emission inventories have been developed on multi-scales in China, and most of them were compiled on na-tional scale, even covering the whole of East Asia (Streets et al., 2003; Zhang, 2005; Ohara et al., 2007; Q. Zhang et al., 2009). The objectives of prior studies were mainly focused on the primary air pollutants from fuel combustion sources, like SO2, NOx, and CO, etc. (Akimoto and Narita, 1994; Hao
introduced PM and VOCs emission inventories based on sur-veys of the cement industry and other non-combustion indus-trial sources. Biomass burning emissions were also quanti-fied as an important air pollution source in some studies (Cao et al., 2005; Yan et al., 2006). Besides primary air pollutants, researchers are gradually emphasizing the key precursors of secondary air pollution, in order to mitigate the complex air pollution of ozone and haze in the regions of China. The species in the VOCs and PM emissions were quantified for various emission sources in past studies (Streets et al., 2001; Cao et al., 2006; Bo et al., 2008), but confidence in the results was not high.
Emission factors are important parameters in the compila-tion of an emission inventory. Compared with European and American studies (EEA, 2006; USEPA, 2002), the funda-mental work of emission factors in China is relatively weak. Former studies typically used an average emission factor for one fuel category in a whole sector, such as industry, do-mestic, and transport (Kato and Akimoto, 1992; Hao et al., 2002; Streets et al., 2003). To refine the emission inventory, Tian (2003), Wang et al. (2005), and Zhang (2005) improved the emission factors to facility level based on domestic mea-surement studies. Some recent studies reported more detailed emission inventories which can be refined to technology level for one facility category (Zhang et al., 2007; Lei et al., 2008). Most of the emission inventories in China were estab-lished based on a top-down approach with low resolution of emission allocation, since the detailed activity data are hard to obtain. The previous studies on macro- or meso-scale emission inventories mainly depended on the statisti-cal data of each administrative region. It is hard to allo-cate the emissions to the specific sources just based on the statistical data. Low-resolution inventories were thought to cause under-estimation of air pollution simulation in recent modeling studies (Liu et al., 2010). In order to support re-gional air pollution study and management in the city clusters of China, some studies introduced highly resolved regional air pollutant emission inventories by using a bottom-up ap-proach (Zheng et al., 2009a, b; Li et al., 2011). Most of the studies on air pollutant emission inventories in the YRD region were still on the city-scale. Chen et al. (2006) and Zhang et al. (2008) have published the emission inventories for Shanghai and Hangzhou city, respectively. However, with city-scale emission inventories, it is hard to draw a whole pic-ture of the total emission level and emission distribution for the YRD region.
Therefore, this paper aims to create an anthropogenic air pollutant emission inventory of the YRD region based on the year 2007. The pollutant types include SO2, NOx, CO,
PM10, PM2.5, VOCs and NH3. VOCs species emissions were
further developed to evaluate the ozone formation potential in the YRD region. After calculation, the emissions were distributed into 4 km×4 km resolved grids to describe the
spatial characteristics of air pollutant emissions in the YRD region.
2 Materials and methods 2.1 Domain of the study
The YRD region is located on China’s eastern coast and covers eight county-scale administrative regions in Jiangsu Province, which include Nanjing, Yangzhou, Tai’zhou, Nan-tong, Zhenjiang, Changzhou, Wuxi, and Suzhou; seven county-scale administrative regions of Zhejiang Province, namely Hangzhou, Huzhou, Jiaxing, Shaoxing, Ningbo, Zhoushan, and Taizhou; and lastly Shanghai municipality it-self. Each administrative region is about 7000 km2on aver-age. Most of the regions consist of an urban area and several suburban areas, dozens of towns and villages, and extensive rural areas. Figure 1 shows the domain for the YRD regional emission inventory. The area is from 118.25◦E to 122.42◦E, and 28.90◦N to 33.30◦N, and is divided into 11 979 grid
cells with 4 km×4 km resolution.
The total area of the YRD region is about 110 000 km2, representing 2 % of China’s total land area. However, the GDP (Gross Domestic Product) of the YRD region reached 6.55 trillion yuan, about 20 % of total national GDP in 2007 (National Bureau of Statistics of China, 2008b). Correspond-ingly, the energy consumption in the YRD region reached 440 million tce, about 17 % of the national total by the end of 2007. Coal was still the major energy category of the region, which contributed over 60 % of the total energy consumed (National Bureau of Statistics of China, 2008a). The auto-mobile population grew to 8 million units in 2007, which ac-counts for 18 % of the national whole. The huge energy con-sumption and vehicle population induced a great amount of primary emissions and precursors in the region. Satellite ob-servations of the tropospheric NO2showed a sharp increase
of 100 % over the YRD region from the year 2000 to 2008, based on the measurements of the Global Ozone Monitoring Experiment (GOME) on the ESA European research satellite ERS-2 (http://www.temis.nl/airpollution/no2.html). Figure 1 shows the satellite observed NO2concentration over eastern
China in 2007. 2.2 Methodology
The Y angtze River
The Hangzhou Bay
Fig. 1. Satellite observed tropospheric NO concentration in 2007 (left) and research domain of
Fig. 1.Satellite observed tropospheric NO2concentration in 2007 (left) and research domain of the YRD region (right).
from livestock feeding, fertilizer application and biomass burning. The pollutants included in this study are SO2, NOx,
CO, PM10, PM2.5, VOCs and NH3. As an important
precur-sor of photochemical smog, VOCs emissions were decom-posed into various species by each kind of emission source.
A large amount of activity data on sources and emission factors of these pollutants was collected to compile the emis-sion inventory of the YRD region in 2007. Then GIS tech-nology was utilized to allocate the emissions based on the geographical information of the individual emission source types. Finally, the emissions in the YRD region were allo-cated to the 4 km×4 km grid cells.
2.3 Determination of emission factors 2.3.1 Fuel-related combustion sources
Fuel-related combustion sources in the YRD region mainly include power plants, boilers, furnaces, kilns, and some res-idential stoves. A nationwide campaign of pollution source census was conducted to get the basic data of these facil-ities one by one in each administrative region for the year of 2007. For regions where census data were not available, the activity data were collected from the national key pol-lution source lists reported by the government every year. These two datasets covered most of the industrial sources in the YRD region and supplied detailed information for
in-dividual emission source calculation, such as geographical data, fuel type, fuel consumption, sulfur content, ash con-tent, boiler type, capacity, and exhaust control efficiency, etc. Since there were no census data available for the emission sources in the commercial and civil sector, we collected fuel consumption data for a whole administrative region from its statistical yearbook and calculated the emissions with aver-age emission factors. Relatively high uncertainty can be ex-pected by use of statistical yearbook data compared with the census data.
The air pollutant emissions of fuel-related combustion are estimated using emission factor methods by Eq. (1): Ei,j=
X
j,k
Aj,kEFi,j,k 1−ηi,j
(1)
where,Ais the activity level of the source (e.g., annual fuel consumption); EF is the average emission factor; η is the exhaust control efficiency; andi,j,krepresent the pollutant type, source category, and technology type, respectively.
For SO2emissions, the annual inventory was compiled
us-ing the mass balance method by Eq. (2).
EFSO2=2×Cs×P×1000 (2)
where,Cs is the percentage of fuel sulfur content;P is the
Table 1.Emission factors of coal combustion sources.
Emission factor (kg t−1)
NOx CO PM10 PM2.5 VOCs
Source Technology Zhang et al. (2007) Wang et al. (2005) Zhang (2005) Zhang (2005) Bo et al. (2008)
Power plant <100 MW, without LNB 10.50 100∼300 MW, without LNB 8.85 100∼300 MW, with LNB 5.85
>300 MW, with LNB 5.55
stoker furnace 8.00 13.88 5.25
pulverized coal boiler 2.00 46.00 12.00
other 0.15
Boiler hand-feed stoker furnace 3.80 124.00 5.40 1.89 automatic stoker furnace 4.00 15.00 5.40 1.89 fluidized-bed furnace 7.50 2.00 28.08 5.40
other 0.18
Kiln shaft kiln 1.70 155.70
New-dry process 15.30 17.80 other rotary kiln 18.50 17.80
lime kiln 1.70 155.70
brick kiln 4.70 150.00
other 5.40 1.89 0.18
Commercial use 3.75 75.00 3.50 2.00 0.60
Residential use 1.88 75.00 8.82 6.86 0.60
The emission factors of NOx, CO, PM10, PM2.5, and
VOCs were taken directly from the latest literature. Domes-tic measurements or relative studies in recent years have pri-ority to be applied in this study. Foreign studies in line with the current technology level in China are used when there is no domestic information available.
The literature reviews of previous studies obtain a range of 2.38–10.0 kg t−1for NOxemission factors (Kato and
Aki-moto, 1992; Hao et al., 2002; Streets et al., 2003). To better understand the NOx emission level of coal-fired boilers in
China, Tian (2003) studied more than 100 power plant boil-ers and obtained a mix of NOxemission factors of various
boiler types with and without LNB. Based on Tian’s study, Zhang et al. (2007) predicted the NOx emission factors of
coal-fired boilers for 1995–2004 in China, which we believe are more representative of the current NOxemission level of
the facilities in the YRD region.
Previous studies illustrate the big differences of CO emis-sion factors between different types of combustion facilities. Ge et al. (2001) obtained the average CO emission factor (15 kg t−1)of automatic stoker furnaces based on
measure-ments. While the CO emission factor of hand-feed stoker furnaces could be 7 times higher according to USEPA’s study (2002). Zhang et al. (2000) tested 19 household stoves and obtained a range of 19–170 kg t−1for CO emission fac-tor. Based on these studies, Wang et al. (2005) summarized the CO emission factors of each kind of fuel combustion source in China, so we used the CO emission factors from the study of Wang et al. (2005).
PM emission factors usually depend on ash content in coal, boiler technology, and the efficiency of exhaust con-trol. There have been few PM emission measurements made in China. Zhang (2005) summarized the domestic and for-eign studies from USEPA (2002), Klimont et al. (2002a), and Zhang et al. (2002) and reported a group of PM10and PM2.5
emission factors, which we have listed in Tables 1 and 2 ac-cording to the technology level of the facilities in China. The emission factors of other pollutants were mainly based on European or American results due to the lack of correspond-ing measurement data in China. VOCs emission factors came from the study of Bo et al. (2008). NH3 emission factors
were negligible for fuel combustion sources.
The emission factors from coal combustion sources with different technologies are listed in Table 1. The emission factors of other fuel types are given in Table 2.
2.3.2 Non-combustion sources in industry
Table 2.Emission factors of other fuel combustion sources in industry.
Pollutant Source Coal gas Natural gas LPG Diesel Fuel oil Reference
(g m−3) (g m−3) (kg t−1) (kg t−1) (kg t−1)
NOx power plant 4.10 7.40 10.06 Tian (2003)
Other industry 1.35 2.09 2.63 9.62 5.84 Tian (2003)
residential use 0.74 1.46 1.58/0.88 5.77 3.50 Tian (2003)
CO – 1.30 1.30 0.36 0.60 0.60 Wang et al. (2005)
PM10 power plant 0.12 0.50 0.85 Zhang (2005)
Other industry 0.20 0.12 0.08 0.50 1.03 Zhang (2005)
residential use 0.20 0.12 0.08 0.50 1.20 Zhang (2005)
PM2.5 power plant 0.12 0.50 0.62 Zhang (2005)
Other source 0.20 0.12 0.08 0.50 0.67 Zhang (2005)
residential use 0.20 0.12 0.08 0.50 0.90 Zhang (2005)
VOCs power plant 0.18 0.13 0.13 Bo et al. (2008)
Other source 0.00044 0.18 0.19 0.15 0.15 Bo et al. (2008)
residential use 0.00044 0.18 0.19 0.15 0.15 Bo et al. (2008)
PM emission sources in this study, such as coke production, iron & steel manufacturing, steel foundries, ferroalloy, and aluminum products, etc., are mainly taken from AP-42 with some adjustments to reflect poorer performance and lower particulate collection efficiencies of the technology level in China. VOCs emission from industrial processes is an impor-tant source which contributes about 32 % of the total in China according to a previous study (Wei et al., 2008). For the in-dustrial processes of beer & spirits manufacturing, paint & ink, plastic, fiber and tire production, we collect the emis-sion factors from the studies of Klimont et al. (2002b) and Bo et al. (2008), which originate from European and Amer-ican studies, respectively. The VOCs emission factor of oil refining is hard to determine because of its complicated pro-cesses and miscellaneous fugitive segments. USEPA (2002) reported an overall THC emission factor of 3.54 kg t−1 for
the refinery industry without control. European studies ob-tained lower emission factors, which are about 1.63 kg t−1 (Passant et al., 1998) and 1.05 kg t−1 (EEA, 2006). We cite a median value (2.65 kg t−1) reported by Klimont et al. (2002b) to represent the current level of oil refining in the YRD region. VOCs emission factors of industrial uses of paint and solvent have large differences in the different lit-eratures (USEPA, 2002; EEA, 2006; Wei et al., 2008; Bo et al., 2008). Based on the fact that the paint used in industry is mainly conventional solvent paint with high solvent content, we determine the emission rates of paint application, print-ing, degreasing operations, and solvent use by Klimont et al. (2002b) and USEPA (2002). The emission factors of ce-ment and bricks manufacturing are based on domestic stud-ies (Lei et al., 2008; C. Y. Zhang et al., 2009). Table 3 lists the emission factors and their references for non-combustion industrial process sources.
2.3.3 Road transport emission sources
The IVE model (ISSRC, 2004) is used to calculate vehicle emissions during the phases of driving, cold start and VOCs evaporation. According to the model needs, we classify the vehicle fleet into light-duty car, light-duty truck, taxi, urban bus, heavy-duty bus, heavy-duty truck, and motorcycle. The study surveys the numbers of each vehicle type from the sta-tistical yearbook of each administrative region. To prepare the fleet files of each city, detailed information about vehicle technology, fuel type, emission standard, and vehicle age is surveyed in the representative cities of Nanjing, Hangzhou, and Shanghai. The average annual travel mileage of each vehicle type is simultaneously obtained based on the rela-tionship between vehicle ages and odometers in these cities (H. K. Wang et al., 2008). After that, we assume fuel econ-omy data (mileage per liter of fuel) for each vehicle and fuel type and obtain total gasoline and diesel consumption in each administrative region by multiplying the fuel economies by annual travel mileages. Some adjustments are made when there are large differences between the predicted data and statistical data. Other input data on driving cycle, fuel qual-ity, and environmental conditions in the study were obtained from existing studies in the representative cities of Shanghai and Hangzhou (Guo et al., 2007; H. K. Wang et al., 2008). Some real-world test data of heavy-duty diesel vehicles were used to adjust the emission factors calculated by the model (Chen et al., 2007).
Table 3.Emission factors of industrial process sources.
Process Activity rate Unit SO2 NOx CO PM10 PM2.5 VOCs NH3 Refence
Vegetable oil processing production kg t−1 2.45 USEPA (2002) Beer manufacturing production kg m−1 0.20 Klimont et al. (2002) Spirits manufacturing production kg m−1 20.00 Klimont et al. (2002) Oil refining crude oil feed kg t−1 1.58 0.22 2.65 Klimont et al. (2002) Coke production coal charged kg t−1 2.01 0.02 0.64 2.75 1.75 2.10 0.09 USEPA (2002) Synthetic Ammonia production kg t−1 0.03 7.90 4.72 2.10 USEPA (2002) Sulfuric Acid production kg t−1 7.00 USEPA (2002) Urea production kg t−1 1.74 1.50 9.69 USEPA (2002) Paint production production kg t−1 15.00 Klimont et al. (2002) Ink production production kg t−1 30.00 Klimont et al. (2002) Plastic processing production kg t−1 2.20 Bo et al. (2008) Synthetic fibre production kg t−1 73.40 Bo et al. (2008) Tyres production production kg tyre−1 0.29 Klimont et al. (2002) Synthetic rubber production kg t−1 15.00 Klimont et al. (2002) Cement manufacturing production kg t−1 8.05 3.40 Lei et al. (2008) Bricks production production kg t−1 0.13 0.04 C. Y. Zhang et al. (2009) Iron manufacturing production kg t−1 0.30 0.09 40.50 0.72 0.45 USEPA (2002) Steel manufacturing Production kg t−1 9.00 11.78 8.62 0.06 USEPA (2002) Steel foundries Production kg t−1 3.58 1.70 USEPA (2002) Ferroalloy production kg t−1 3.61 2.79 USEPA (2002) Aluminum products production kg t−1 2.63 2.08 USEPA (2002) Paint application paint used kg t−1 730.00 Klimont et al. (2002) Print Ink used kg t−1 300.00 Klimont et al. (2002) Degreasing operations solvent used kg t−1 900.00 Klimont et al. (2002) Solvent use solvent used kg t−1 300.00 USEPA (2002)
size multiplier. However, our estimation of this source is very simple and has high uncertainty, since there is little local in-formation that can be compared. The parameters of road sur-face silt loading and particle size multiplier are determined by the studies of Sun et al. (2003) and Huang et al. (2006) with some modifications for different road types of different areas in the YRD region.
2.3.4 Fugitive VOCs emission sources
The fugitive VOCs emission sources considered in this study mainly consist of domestic paint use for building and furni-ture, domestic solvent use, and oil/gas evaporation. For the architectural and domestic use of paint, this study uses paint consumption as the activity unit for these activities and for vehicle treatment. The emission factors of domestic paint and solvent uses and waste landfills are taken from Klimont et al. (2002). The volatilization and leakage of VOCs emis-sions from the distribution and storage of petroleum products mainly involve liquid loading losses, tank breathing losses, and vehicle refueling operation losses. Bo et al. (2008) indicate that most gas stations adopted underground tanks and had no control in vehicle refueling operations by 2007. Therefore, we select the emission factors from that study. The activity data of each source come from the statistical
yearbook of each administrative region, and the emission fac-tors and their references are listed in Table 4.
2.3.5 Anthropogenic ammonia sources
Anthropogenic ammonia sources include livestock feeding, N-fertilizer application, sewage treatment, waste landfills, and human discharge in this study. The emission rates of major ammonia sources are influenced by local geography and climate conditions, so the emission factors mainly come from domestic studies (Dong et al., 2009; Zhang et al., 2010; Yin et al., 2010). Only the human discharge emission fac-tor comes from a European study (EEA, 2006), since there is no local study available. The activity data of these sources are collected from the annual statistical data of each admin-istrative region. The emission factors of each source type are listed in Table 5.
2.3.6 Biomass burning
Table 4.Emission factors of fugitive VOCs emission sources.
Source Activity rate Unit Emission factor Reference
Domestic paint use paint used kg t−1 0.36 Klimont et al. (2002)
Domestic solvent use solvent used kg capita−1 0.20 Klimont et al. (2002)
Vehicle treatment cars registered kg vehicle−1 1.11 Klimont et al. (2002)
Waste landfills amount of waste kg t−1 0.23 Klimont et al. (2002)
Oil storage
Crude oil storage rate kg t−1 0.12 Bo et al. (2008)
Gasoline storage rate kg t−1 0.16 Bo et al. (2008)
Underground tank filling gasoline consumed kg t−1 1.16 Bo et al. (2008)
Tank breathing and emptying gasoline consumed kg t−1 0.16 Bo et al. (2008)
Vehicle refueling operations
displacement losses (uncontrolled) gasoline consumed kg t−1 1.74 Bo et al. (2008)
Spillage gasoline consumed kg t−1 0.11 Bo et al. (2008)
Table 5.Emission factors of anthropogenic ammonia emission sources.
Source Activity rate Unit Emission factor Reference
Livestock
Dairy cattle livestock kg N head−1 21.93 Zhang et al. (2010)
Other cattle livestock kg N head−1 7.31 Zhang et al. (2010)
Pig livestock kg N head−1 4.61 Zhang et al. (2010)
Sheep and goat livestock kg N head−1 2.24 Zhang et al. (2010)
Horse livestock kg N head−1 5.66 Zhang et al. (2010)
Poultry livestock kg N head−1 0.41 Zhang et al. (2010)
N-fertilizer application fertilizer applied kg kg−1 16.81 Dong et al. (2009)
Sewage treatment amount of sewage kg m−3 0.0032 Yin et al. (2010)
Waste landfills amount of waste kg t−1 0.56 Yin et al. (2010)
Human discharge capita kg capita−1 0.05 EEA (2006)
et al. (2000). We use the summarized emission factors re-ported by Cao et al. (2005) in this study.
2.4 Speciation of VOC emissions
VOC emissions were broken down into their chemical con-stituents based on the species profiles of the various emission sources. Sources included were coal burning, petrochemi-cal industry, coking industry, paint and solvent use, gasoline-fueled vehicles, diesel-gasoline-fueled vehicles, gasoline evaporation, andbiomass burning. Some local experimental results from the coking industry were adopted to determine the source profiles; however, most of the source profile data were cited from the work of Liu et al. (2008), B. G. Wang et al. (2008) and Yuan et al. (2010).
In order to evaluate the impact of the VOC species on ozone formation, the ozone formation potentials (OFP) of each of the VOC species was calculated by multiplying the emissions by its corresponding maximum increment
reactiv-ity (MIR) factor (Carter, 1994). The total OFP of each source can be calculated by summarizing all of the OFPs of individ-ual VOC species, as shown in Eq. (3).
OFPi= X
j=1
Eij×MIRj (3)
where, OFPi is the ozone formation potential of sourcei, Eij is the VOC emission of sourcei, MIRj is the maximum
increment reactivity for thejthchemical species.
2.5 Methodology for emission allocation
Table 6.Air pollutant emission inventory of the cities in the YRD region in 2007.
Annual air pollutant emissions/kt
Province City Distance to Shanghai/km SO2 NOx CO PM10 PM2.5 VOCs NH3
Jiangsu Suzhou 85 281.7 368.6 1205.1 389.2 208.1 483.3 26.3
Nantong 98 139.4 90.5 308.9 111.6 56.8 87.7 71.1
Wuxi 117 261.4 183.7 488.0 347.5 167.8 191.7 26.8
Changzhou 158 145.4 90.7 455.4 211.6 98.8 73.2 16.3
Tai’zhou 200 18.2 52.5 148.7 64.9 31.2 62.8 32.9
Zhenjiang 220 131.6 103.3 128.5 208.3 96.4 45.9 14.3
Yangzhou 234 43.9 110.4 164.8 81.8 48.3 58.1 50.7
Nanjing 272 221.0 144.2 739.7 255.9 129.7 153.2 24.1
Zhejiang Jiaxing 85 120.9 114.3 203.3 219.7 97.4 58.0 36.7
Huzhou 137 81.3 71.5 144.2 190.0 83.2 53.7 20.1
Ningbo 150 254.8 211.0 284.0 211.6 111.6 150.3 25.4
Zhoushan 157 4.2 15.7 18.6 10.4 6.1 17.9 1.7
Shaoxing 163 135.0 105.0 213.5 196.8 88.2 287.3 21.3
Hangzhou 164 126.2 134.5 482.5 282.0 129.3 391.6 29.6
Taizhou 267 28.1 117.1 156.5 69.1 38.5 66.0 19.0
Shanghai 0 398.8 380.0 1555.5 265.5 119.2 586.9 42.6
Total – 2391.8 2292.9 6697.1 3115.7 1510.8 2767.4 458.9
then allocated to grid cells according to 1 km×1 km
reso-lution level GDP distribution data in China (RESDC, 2003). The other anthropogenic emissions are deemed to be related to the distribution of population density. Therefore, these kinds of emissions were spatially allocated into grid cells based on 30′′×30′′ resolution gridded population densities
from 2006 LandScan Asia Population data (ORNL, 2007).
3 Results and discussion
3.1 Air pollutant emissions and distributions
The anthropogenic emission inventories in the sixteen ad-ministrative regions of the YRD region for the year 2007 are summarized in Table 6. The total emissions of SO2, NOx,
CO, PM10, PM2.5, VOCs, and NH3 were 2392 kt, 2293 kt,
6697 kt, 3116 kt, 1511 kt, 2767 kt, and 459 kt, respectively. Shanghai, Suzhou, Wuxi, Ningbo, Hangzhou, and Nanjing are the six largest contributors. These regions totally account for 65 %, 62 %, 71 %, 56 %, 57 %, 71 %, and 38 % of SO2,
NOx, CO, PM10, PM2.5, VOCs, and NH3 emission. It is
worthwhile to mention that flue-gas desulfurization (FGD) projects are being implemented at power plants in the YRD region during the national 11th Five-Year Plan (2006–2010). By the end of 2007, about 40 % of power plants had accom-plished the installation of FGD units. The units achieved a SO2emission reduction of approximately 153 kt, assuming
their removal efficiencies reached 90 %. Another 79 kt SO2
emission could be expected before the end of 2010, provided that the remaining planned FGD installation is implemented. Figure 2 illustrates the spatial allocation of emissions and relative concentrations of SO2, NO2, and PM10
(concentra-tions of Shanghai are equivalent to (1) in the YRD region. The annual average concentrations of SO2, NO2, and PM10
came from the annual statistical data of the monitoring net-work in each administrative region (JSEPB, 2008; ZJEPB, 2008; SEPB, 2008). Figure 2a–e show that the highest emis-sion intensities of SO2, NOx, PM10, PM2.5, and VOCs are
located along the banks of the Yangtze River and Hangzhou Bay. The area along the southern bank of the Yangtze River has a lot of industrial zones for manufacturing, steel produc-tion, chemical producproduc-tion, etc. The major emission sources of Hangzhou Bay are oil refining and its downstream indus-try. High emission intensities in the city centers of Shanghai, Hangzhou, Nanjing, and Wuxi mainly come from on-road vehicles. As NH3emission mainly comes from the
agricul-ture sector, high NH3emission intensity is distributed in
ru-ral areas of Nantong, Jiaxing, Yangzhou, Taizhou, and the suburban area of Shanghai, as shown in Fig. 2f. The emis-sion distributions in the YRD region are reasonably corre-lated with SO2, NO2, and PM10 annual concentrations, as
shown in Fig. 2g–i. Relatively, PM10 concentration seems
(a) SO2 emission (b) NOx emission (c) PM10 emission
(d) PM2.5 emission (e) VOCs emission (f) NH3 emission
(g) SO2 concentration (h) NO2 concentration (i) PM10 concentration
Fig. 2. Spatial allocation of air pollutant emissions and annual concentrations in the YRD region
0% 20% 40% 60% 80% 100%
SO2 NOx CO PM10 PM2.5 VOC NH3
S o ur c e c o nt ri b ut ion ( % )
Power plants Boilers Fuel combustion Iron & steel process Refinery process Process of mineral product Chemical process Industrial coating Other process Vehicle Residential fuel Road dust Domestic paint & printing Gas evaporation Livestocks N fertilizer application Waste treatment Human discharge Biomass burning
单位面积排
放强度
Fig. 3. Emission contribution of source categories in the YRD
re-gion in 2007.
3.2 Emission contributions by source categories Figure 3 shows the emission contributions of more than 20 source categories in the YRD region. It is shown that power plants are the major pollution source of the primary pollu-tants, comprising 46 %, 59 %, 21 %, and 28 % of the total SO2, NOx, PM10, and PM2.5 emissions, respectively. The
SO2emission contribution of power plants will be reduced
to about 19 % when the FGD projects are accomplished in 2010. CO emission mainly comes from iron and steel man-ufacturing and on-road vehicles, which contribute 34 % and 30 % of the total, respectively. The non-combustion indus-trial processes, include iron and steel manufacturing, refiner-ies, and paint and solvent use, are the major sources of fugi-tive dust and VOC, comprising 58 %, 54 %, and 68 % of PM10, PM2.5, and VOC emissions. The process of mineral
production contributes 45 % and 39 % of PM10 and PM2.5
emission, respectively. Mineral production is a major indus-trial sector that includes the production of cement, lime, plate glass, and bricks, etc. Based on the study of Lei et al. (2008), the PM10and PM2.5emissions from cement production takes
up 32 % and 28 % compared with the total PM10and PM2.5
emissions in the 2006 INTEX-B data of China (Q. Zhang et al., 2009). Other VOC emission mainly comes from the domestic use of paint and solvent, gasoline evaporation, and biomass burning, contributing about 20 %, 2 %, and 3 % of the total. On-road vehicles contribute 12.3 % and 12.4 % of total NOx and VOC emissions. The NH3 emissions from
livestock feeding and N-fertilizer application take up 48 % and 40 % of the total, respectively. Based on the studies of Ge et al. (2011a, b), livestock feeding and N-fertilizer ap-plication might also be large sources of amines, whose ten-dency to partition into the particle phase is similar to or even greater than ammonia. However, determining the emission level of amines requires more future work in the YRD region. According to this inventory, the contributions of SO2, NOx,
PM10, PM2.5, VOC, and NH3emission for biomass burning
0.00 5.00 10.00 15.00 20.00 25.00 30.00
YRD PRD YRD PRDYRD PRD YRD PRDYRD PRD YRD PRDYRD PRD SO2 NOx CO/10 PM10 PM2.5 VOCs NH3
单位面积排
放强度
/t· k m -2 Other Biomass burning Waste treatment Livestocks N-fertilizer application VOCs products-related Residential fuel Vehicle Industry Power plant
Fig. 4.Comparison of air pollutant emissions and source
contribu-tions in the YRD and PRD regions.
are 0.1 %, 0.7 %, 1.6 %, 2.6 %, 3.5 %, and 2.2 %. But it is necessary to emphasize that the crop residue burning emis-sions are usually concentrated in the spring harvest period during May to June and the autumn harvest period during September to October, which frequently correspond to the heavy pollution episodes in the YRD region.
3.3 Comparison with emission inventories for other regions
To better understand the emission level in the YRD region, we select another developed city cluster in southern China, the Pearl River Delta (PRD) region (including Guangzhou, Hong Kong, etc.), to compare their emission intensities of SO2, NOx, PM10, PM2.5, VOCs, NH3, and source
contri-butions as shown in Fig. 4. The emission data come from 2006 PRD emission inventories (Zheng et al., 2009b; Yin et al., 2010). The emission intensities of SO2, NOxand VOCs
in the YRD and PRD regions are similar and all relatively high, reaching (22–25) t km−2 and (18–22) t km−2, respec-tively. However, the PM10 and PM2.5 emission intensities
in the YRD region are more than 2.5 times the values in the PRD region. Primary particulate matter from power plants and industrial facilities could be the major contributors that need to be focused on for the air pollution control strategies in the YRD region. Relatively speaking, the industrial sec-tor plays a more important role in the emissions of the YRD region. The statistical data indicate that the products of oil refining, ethylene, cement, iron, and steel in the YRD region are about 2.0, 1.8, 2.6, 7.8, and 6.3 times those of the same products in the PRD region (National Bureau of Statistics of China, 2008b). In contrast, road transport in the PRD region contributes more (about 36 % and 53 % of NOx and VOCs
emissions) than that of the YRD region (about 12.3 % and 12.4 % of NOxand VOCs emissions).
Table 7.Emission contributions of the YRD region to the whole China.
SO2 NOx VOC PM10 PM2.5 References
Power
YRD (2007)/China (2000) 10 % 40 % – – – Lamarque et al. (2010)
YRD (2007)/China (2005) 5 % 11 % – – – EC-JRC/PBL (2011)
YRD (2007)/China (2005) 7 % 30 % – 25 % 46 % Amann et al. (2008)
YRD (2007)/China (2006) 6 % 15 % – 26 % 28 % Q. Zhang et al. (2009)
Industry
YRD (2007)/China (2000) 28 % 14 % 120% – – Lamarque et al. (2010)
YRD (2007)/China (2005) 10 % 10 % 34 % – – EC-JRC/PBL (2011)
YRD (2007)/China (2005) 9 % 8 % 59 % 26 % 17 % Amann et al. (2008)
YRD (2007)/China (2006) 13 % 12 % 23 % 20 % 14 % Q. Zhang et al. (2009) Road transport
YRD (2007)/China (2005) 23 % 16 % 14 % – – EC-JRC/PBL (2011)
YRD (2007)/China (2005) 4 % 7 % 11 % 8 % 8 % Amann et al. (2008)
YRD (2007)/China (2006) 14 % 6 % 5 % 10 % 10 % Q. Zhang et al. (2009)
Total
YRD (2007)/China (2000) 13 % 20 % 12 % – – Lamarque et al. (2010)
YRD (2007)/China (2005) 7 % 10 % 16 % – – EC-JRC/PBL (2011)
YRD (2007)/China (2005) 8 % 14 % 17 % 17 % 12 % Amann et al. (2008)
YRD (2007)/China (2006) 8 % 11 % 12 % 17 % 11 % Q. Zhang et al. (2009)
sector of the YRD generates nearly 20 % of the electricity in China, and its NOxand PM10emissions contribute about
11 %–40 % of the total compared with the studies mentioned above. The proportion of SO2 emissions in the YRD
re-gion is only 5 %–10 % due to the installation of FGD units in some power plants by 2007. The industry sector of the YRD consumes 18 % of the energy used in the industry sector of China, and its SO2, NOx, PM10, and PM2.5emissions
con-tribute about 8 %–28 % of the total. The proportion of VOCs emission in industry of the YRD is relatively higher, about 23 %–120 % of the industry sector in China, which is mainly because there are a number of industrial activities with high VOCs emissions, such as oil refineries, petrochemical plants, etc., that have co-located in the YRD region. The road trans-port sector in the YRD region contributes 4 %–23 % of the emissions and 18 % of automobile ownership. In general, the comparisons reveal that the YRD emission inventory in this study is in line with most of the national inventories. How-ever, there are still some contradictions between this inven-tory and some studies which will require further investigation in the future.
The 2006 INTEX-B Asian emission inventory (Q. Zhang et al., 2009) is compared to this emission inventory. The re-sult shows that the differences of SO2, NOx, PM10and VOCs
emissions between the relative grids of both studies are about
−3.8 %, 7.0 %, 58.1 % and 23.8 %, respectively. SO2 and
NOxemissions have relatively high agreement, while the
un-certainties of PM10 and VOCs emission in both inventories
are all higher than the others. The correlation coefficients of the grids are about 0.81, 0.80, 0.78 and 0.79, implying
similar spatial distribution patterns of emissions for the two studies. The emission intensities of PM10 and VOCs
emis-sion in this study are generally higher than INTEX-B. This might be because the activity data collected for this study are based on a bottom-up approach and are usually more detailed and concentrated in some grids compared with the national-or continental-scale inventnational-ory.
3.4 VOCs species emissions and ozone formation potentials
Figure 5 shows the ten most important species for ozone formation potential and their relative emissions in the YRD region in 2007. The figure illustrates that ethylene, mp-xylene, o-xylene, toluene, 1,trimethylbenzene, 2,4-dimethylpentane, ethyl benzene, propylene, 1-pentene, and isoprene are the key species for the formation of secondary air pollution. These 10 species contribute 77 % to the total OFP and 49 % to total VOC emissions in the region.
0 200 400 600 800 1000 1200 1400 ethy lene m, p-xyle ne o-xy lene tolu ene 1,2, 4-trime thyl benze ne 2,4-d ime thyl pen tane ethy l be nzen e propy lene 1-pe nten e isop rene O FP ( k t/ y e a r) 0 50 100 150 200 250 300 350 E m is sio n ( k t/y e a r) OFP Emission
Fig. 5. The most important 10 VOC species of OFP contribution
and their emissions in the YRD in 2007.
0% 10% 20% 30% 40% 50% 60% 70% 80% 90% 100% ethyl ene m, p-xylen e o-xyl ene tolue ne 1,2, 4-trim ethy lben zene 2, 4-dim ethyl pent ane ethyl benz ene prop ylen e 1-pe nten e isopr ene OF
P
Biomass burning Paint & printing Gas evaporation Diesel vehicle Gasoline vehicle Industrial coating Coking industry Chemical industry Refinery industry Coal burning
Fig. 6.Source contributions of the most important 10 VOC species
and OFP in the YRD region.
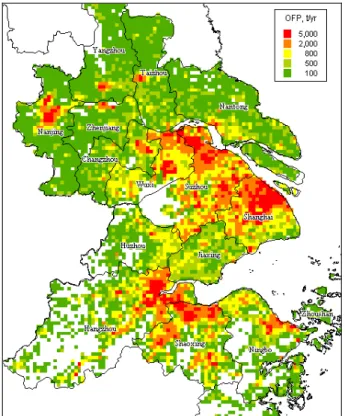
In terms of OFP, chemical industry, domestic paint and printing, gasoline vehicles, industrial coating, and oil refiner-ies are the five major sources for ozone formation, account-ing for 38.2 %, 23.9 %, 11.6 %, 9.6 %, and 4.2 %, respec-tively. The VOC emission contributions of these sources are about 34.5 %, 21.7 %, 9.7 %, 18.8 %, and 6.0 %, respectively. The results shows the ozone formation contributions of the sources are not always correlated with their emission values in the YRD region. It is worthwhile to mention that gaso-line vehicles are responsible for 9.7 % of VOC emissions, as well as 11.6 % for ozone formation. Figure 7 shows the spatial allocation of the OFPs in the YRD region. It can be seen from the figure that high OFP values are mainly concen-trated in the well-developed urban and industrial areas along the Yangtze River and around Hangzhou Bay.
3.5 Assessment of uncertainty in the emission inventory The YRD regional emission inventory was compiled by a bottom-up approach based on local surveys of major air pol-lution sources in the region. Most of the activity data, in-cluding fuel consumption, sulfur content, ash content, ex-haust control efficiency and geographic location of industrial
Fig. 7.Spatial distribution of the OFPs in the YRD region.
sources, were collected from the local pollution source cen-sus in the YRD region. However, most of the emission fac-tors used in this study is still subject to considerable uncer-tainty due to the lack of local measurement data. Table 8 illustrates the uncertainty analysis at the 95 % confidence in-terval for each source category in the emission inventory. The coefficients of variation of the activity and emission factor data of each source are classified into seven grades in the range of 2 %–100 % based on expert judgment. The coeffi-cient of activity data is determined based on the quality of data source. The census data of the industrial sources are assigned the lowest coefficient of uncertainties, while the es-timated activity data based on statistical yearbooks such as biomass burning are assigned the highest values. The coeffi-cient of emission factor is mainly determined by its source. The emission factors based on local measurements with large samples are assigned the lowest values, while those from lim-ited European or American studies are assigned high coef-ficients. Then the uncertainty of each pollutant from each emission source is combined by Eqs. (1–3).
CV=U
E=1.96× r
1+C2
a
1+Cf2−1 (4)
Uj= s
X
k
Table 8.Uncertainty assessment of major emission sources in the YRD region.
Sources SO2 NOx CO PM10 PM2.5 VOCs NH3
Power plants ±5.5% ±5.5% ±66.8% ±35.5% ±98.1% ±98.1% –
Boilers ±5.5% ±35.5% ±66.8% ±35.5% ±98.1% ±98.1% –
Other fuel combustion ±50.3% ±76.4% ±76.4% ±76.4% ±136.1% ±105.6% –
Iron & steel process – – ±123.1% ±123.1% ±213.5% – –
Refinery process – – – – – ±96.9% –
Process of mineral product – – – ±152.0% ±213.5% – –
Chemical process – – – – – ±152.0% –
Industrial coating – – – – – ±152.0% –
Vehicle ±50.3% ±50.3% ±50.3% ±76.4% ±76.4% ±50.3% ±136.1%
Road dust – – – ±201.9% ±264.0% – –
Domestic paint & printing – – – – – ±147.0% –
Gas evaporation – – – – – ±76.4% –
Livestocks – – – – – – ±105.6%
N fertilizer application – – – – – – ±136.1%
Biomass burning ±152.0% ±152.0% ±152.0% ±182.4% ±213.5% ±152.0% –
U=
s X
j
Uj2 (6)
where,CVis the coefficient of variation of the emission rate, Eis the emission rate,U is the uncertainty of the emission source,Cais the uncertainty of activity data,Cfis the
uncer-tainty of emission factor,j andkrepresent for pollutant and emission source respectively.
The uncertainty assessment indicates that the fuel-related combustion sources such power plants and boilers are more reliable compared with the other source categories, because the emissions are calculated based on detailed census data of fuel consumption, technology, and exhaust control efficiency. The industrial processes, including iron and steel production, oil refinery, mineral products process, and chemical produc-tion, etc., have relatively higher uncertainties mainly due to the lack of local emission factors for each production pro-cess and exhaust control technology. Vehicle emissions are expected to have low uncertainties. Vehicle emission fac-tors have been modified by real-world measurement data in Shanghai (Chen et al., 2007; H. K. Wang et al., 2008), and average mileage data is adjusted by the statistical data of gasoline and diesel consumption in each region. Relatively, road dust emissions have much high uncertainty since the parameters have large differences in different areas. Other emission sources like domestic painting and printing, fertil-izer application, and biomass burning all have high uncer-tainties in the study. More research is necessary both on emission factors and on activity surveys in the future in the YRD region.
The overall uncertainties for SO2, NOx, CO, PM10, PM2.5,
VOCs, and NH3 emissions in the inventory are,
respec-tively, ±19.1 %, ±27.7 %, ±47.1 %, ±117.4 %, ±167.6 %, ±133.4 %, and ±112.8 %. The uncertainties of SO2, NOx,
and CO are improved due to the fact that the activity data of major emission sources such as power plants, boilers, and other fuel combustion facilities are refined by the bottom-up approach. However, PM10, PM2.5, VOCs, and NH3
emis-sions still have high uncertainty, since their emission factors are mainly taken from the research findings in the United States and Europe, which result in large differences com-pared with the real situation in the YRD region.
There are still some sources not considered in this study, such as off-road emission sources, including locomotives, shipping, aircraft, and construction machinery, and dust emissions from yards and construction sites. The omission of these sources will cause a slight underestimate in the emis-sion inventory. In addition, many studies have confirmed the impact of biogenic sources on the air quality. Our study did not include biogenic emissions in the YRD region, but it can be roughly estimated that biogenic VOC emissions comprise 23 % of the total in the summer and 3 % of the total VOC emissions in the winter, using the GEIA natural VOC emis-sion database for 1990.
4 Conclusions and recommendations
A regional emission inventory for the YRD region for the year 2007 was compiled based on local source information, urban energy consumption, vehicle composition, as well as other information on the industry, commercial and agricul-ture sectors. It is estimated that the emissions of SO2, NOx,
CO, PM10, PM2.5, VOCs and NH3 in the YRD region
1,2,4-trimethylbenzene, 2,4-dimethylpentane, ethyl benzene, propylene, 1-pentene, and isoprene are the key species which contribute 77 % to the total OFP and 49 % to the VOC emis-sion in the whole region. The air pollutant emisemis-sions and OFPs in the YRD region were mainly concentrated in the ur-ban and industrial areas along the Yangtze River and around Hangzhou Bay, where the conventional air pollutant concen-trations are relatively high.
The industrial sources including power plants, other fuel combustion facilities, and non-combustion processes are the major contributors to in the YRD region, generally account for 97 %, 86 %, 89 %, 91 %, and 69 % of the total SO2,
NOx, PM10, PM2.5, and VOC emissions. On-road vehicles
in the YRD region contribute 12.3% of the NOx emission
and 12.4 % of the VOC emission. The livestock feeding and N-fertilizer application source take up 48 % and 40 % of the total NH3emission, respectively. In addition, chemical
in-dustry, domestic paint & printing, gasoline vehicle, indus-trial coating, and oil refinery are the five major sources to the ozone formation, accounting for 38 %, 24 %, 12 %, 10 %, and 4 %, respectively.
NOxand VOC emissions are the key precursors required
to be reduced to improve the regional ozone and secondary aerosol pollution. However, neither of the pollutants is regu-lated currently in China. Therefore, more targeted air pollu-tion control measures on reducing NOxand VOC emissions
are needed to be put forward in the national or regional plan-ning. Based on the emission inventory in the YRD region, power plants and vehicles should be taken into accounts to re-duce the NOxemission. In this case, some control measures
such as denitrification of power plants, universally upgrad-ing new vehicle emission standard and fuel quality (Shang-hai has implemented Euro IV standard in 2009), should be considered in the next stage for the cities of the YRD region. VOC emissions are more complicated to be controlled. The control measures of supervising the fugitive VOC emission in the refining, chemical, and other industries, gasoline vapor recovery, and the use of water-based paint are expected to re-duce the total VOC emissions in the YRD region. In addition, considering most of the gasoline vehicle emissions are con-centrated in urban areas and have strong reactivity to ozone formation, some corresponding measures such as accelerat-ing the phase out of old vehicles and strengthenaccelerat-ing vehicle inspection and maintenance would be more effective to the mitigation of ozone concentration.
Acknowledgements. This study was supported by the “Chinese Na-tional Key Technology R&D Program” via grants 2009BAK43B33 and “The characteristics of haze and control strategy in the typical areas in China” via grants HY10096784. We would like to show our gratitude to Chinese Research Academy of Environmental Sciences very much for their data support on the study.
Edited by: T. Butler
References
Akimoto, H. and Narita, H.: Distribution of SO2, NOx, and CO2
emissions from fuel combustion and industrial activities in Asia with 1◦×1◦resolution, Atmos. Environ., 28, 213–225, 1994. Amann, M., Jiang, K. J., Hao, J. M., Wang, S. X., Zhuang, X.,
Wei, W., Deng, Y. X., Liu, H., Xing, J., Zhang, C. Y., Bertok, I., Borken. J., Cofala, J., Heyes, C., H¨oglund, L., Klimont, Z., Purohit, P., Rafaj, P., Sch¨opp, W., Toth, G., Wagner, F., and Winiwarter, W.: Scenarios for cost-effective control of air pol-lution and greenhouse gases in China. International Institute for Applied Systems Analysis (IIASA), Laxenburg, Austria, 2008. Andreae, M. O. and Merlet, P.: Emission of trace gases and aerosols
from biomass burning, Global Biogeochem. Cy., 15, 955–966, 2001.
Bo, Y., Cai, H., and Xie, S. D.: Spatial and temporal variation of his-torical anthropogenic NMVOCs emission inventories in China, Atmos. Chem. Phys., 8, 7297–7316, doi:10.5194/acp-8-7297-2008, 2008.
Cao, G. L., Zhang, X. Y., Wang, D., and Zheng, F. C.: Inventory of atmospheric pollutants discharged from biomass burning in China continent, China Environmental Science, 25(1), 389–393, 2005 (in Chinese).
Cao, G. L., Zhang, X. Y., and Zheng, F. C.: Inventory of black car-bon and organic carcar-bon emissions from China, Atmos. Environ., 40, 6516–6527, 2006.
Carter, W. P. L.: Development of ozone reactivity scales for volatile organic compounds, J. Air Waste Manage. Assoc., 44, 881–899, 1994.
Chen, C. H., Wang, B. Y., Fu, Q. Y., Green, C., and Streets, D. G.: Reductions in emissions of local air pollutants and co-benefits of Chinese energy policy: a Shanghai case study, Energy Policy, 34(3), 754–762, 2006.
Chen, C. H., Huang, C., Jing, Q. G., Wang, H. K., Pan, H. S., Li, L., Zhao, J., Dai, Y., Huang, H. Y., Schipper, L., and Streets, D. G.: On-road emission characteristics of heavy-duty diesel vehicles in Shanghai, Atmos. Environ., 41(26), 5334–5344, 2007.
Dong, Y. Q., Chen, C. H., Huang, C., Wang, H. L., Li, L., Dai, P., and Jia, J. H.: Anthropogenic emissions and distribution of ammonia over the Yangtze River Delta. Acta Scientiae Circum-stantiae, 29(8), 1–7, 2009 (in Chinese).
European Commission: Joint Research Centre (JRC)/Netherlands Environmental Assessment Agency (PBL), Emission Database for Global Atmospheric Research (EDGAR), release version 4.1, http://edgar.jrc.ec.europa.eu/index.php, (last access: 2 April 2010), 2011.
European Environment Agency (EEA): EMEP/CORINAIR emis-sion inventory guidebook-2006. No. 1112006 Denmark: Euro-pean Environment, 2006.
Gao, J., Wang, T., Zhou, X. H., Wu, W. X., and Wang, W. X.: Measurement of aerosol number size distributions in the Yangtze River delta in China: Formation and growth of particles under polluted conditions, Atmos. Environ., 43, 829–836, 2009. Ge, S., Bai, Z. P., Liu, W. L., Zhu, T., Wand T. J., Qing, S., and
Zhana, J.: Boiler briquette coal versus raw coal : Part I - Stack gas emissions, J. Air Waste Manage. Assoc., 51, 524–533, 2001. Ge, X. L., Wexler, A. S., and Clegg, S. L.: Atmospheric amines-Part
I. A review, Atmos. Environ., 45, 524–546, 2011a.
Atmos. Environ., 45, 561–577, 2011b.
Geng, F. H., Zhang, Q., Tie, X. X., Huang, M. Y., Ma, X. C., Deng, Z. Z., Yu, Q., Quan, J. N., and Zhao, C. S.: Aircraft measure-ments of O3, NOx, CO, VOCs, and SO2in the Yangtze River
Delta region, Atmos. Environ., 43, 584–593, 2009.
Guo, H., Zhang, Q. Y., Shi, Y., and Wang, D. H.: On-road remote sensing measurements and fuel-based motor vehicle emission in-ventory in Hangzhou, China, Atmos. Environ., 41, 3095–3107, 2007.
Hao, J., Tian, H., and Lu, Y.: Emission inventories of NOx from commercial energy consumption in China, 1995–1998, Environ. Sci. Technol., 36, 552–560, 2002.
Hao, C. and Xie, S. D.: Estimation of vehicular emission inventories in China from 1980 to 2005, Atmos. Environ., 41, 8963–8979, 2007.
Huang, Y. M., Shu, J., Wei, H. P., and Wang, Q.: The estimate and GIS of fugitive dust emission from paved roads in industrial estate, Environ. Sci. Manage., 31(1), 46–52, 2006 (in Chinese). ISSRC: IVE model users manual version 1.1.1. Document available
online at: http://www.gssr.net/ive/, 2004.
Jiangsu Environment Protection Bureau (JSEPB): Jiangsu Provin-cial Environment Bulletin 2008, Jiangsu Environment Protection Bureau press, Jiangsu, 2008 (in Chinese).
Kato, N. and Akimoto, H.: Anthropogenic emissions of SO2and
NOxin Asia: Emission inventories, Atmos. Environ., 26, 2997–
3017, 1992.
Klimont, Z., Cofala, J., Bertok, I., Amann, M., Heyes, C., and Gyarfas, F.: Modelling particulate emissions in Europe: A framework to estimate reduction potential and control costs. In-terim report, IR-02-076, International Institute for Applied Sys-tems Analysis, Laxenburg, Austria, 2002a.
Klimont, Z., Streets, D. G., Gupta, S., Cofala, J., Fu, L. X., and Ichikawa, Y.: Anthropogenic emissions of non-methane volatile organic compounds in China, Atmos. Environ., 36, 1309–1322, 2002b.
Lamarque, J.-F., Bond, T. C., Eyring, V., Granier, C., Heil, A., Klimont, Z., Lee, D., Liousse, C., Mieville, A., Owen, B., Schultz, M. G., Shindell, D., Smith, S. J., Stehfest, E., Van Aardenne, J., Cooper, O. R., Kainuma, M., Mahowald, N., Mc-Connell, J. R., Naik, V., Riahi, K., and van Vuuren, D. P.: His-torical (1850–2000) gridded anthropogenic and biomass burning emissions of reactive gases and aerosols: methodology and ap-plication, Atmos. Chem. Phys., 10, 7017–7039, doi:10.5194/acp-10-7017-2010, 2010.
Lei, Y., He, K. B., Zhang, Q., and Liu, Z. Y.: Technology-based emission inventory of particulate matters (PM) from cement in-dustry, Environ. Sci., 29(8), 2366–2371, 2008 (in Chinese). Li, L., Chen, C. H., Fu, J. S., Huang, C., Streets, D. G., Huang,
H. Y., Zhang, G. F., Wang, Y. J., Jang, C. J., Wang, H. L., Chen, Y. R., and Fu, J. M.: Air quality and emissions in the Yangtze River Delta, China, Atmos. Chem. Phys., 11, 1621– 1639, doi:10.5194/acp-11-1621-2011, 2011.
Liu, Y., Shao, M., Fu, L. L., Lu, S. H., Zeng, L. M., and Tang, D. G.: Source profiles of volatile organic compounds (VOCs) measured in China: Part I, Atmos. Environ., 42, 6247–6260, 2008. Liu, X. H., Zhang Y., Cheng, S. H., Xing, J., Zhang, Q., Streets,
D. G., Jang, C., Wang, W. X., and Hao, J. M.: Understanding of regional air pollution over China using CMAQ, part I perfor-mance evaluation and seasonal variation, Atmos. Environ., 44,
2415–2426, 2010.
National Bureau of Statistics of China: China Energy Statistical Yearbook 2008. China Statistics Press, Beijing, 2008a.
National Bureau of Statistics of China: China Statistical Yearbook 2008. China Statistics Press, Beijing, 2008b.
Oak Ridge National Laboratory (ORNL): LandScan global popula-tion 2006 database. Oak Ridge Napopula-tional Laboratory, Oak Ridge, Tenn., 2007.
Ohara, T., Akimoto, H., Kurokawa, J., Horii, N., Yamaji, K., Yan, X., and Hayasaka, T.: An Asian emission inventory of anthropogenic emission sources for the period 1980–2020, At-mos. Chem. Phys., 7, 4419–4444, doi:10.5194/acp-7-4419-2007, 2007.
Passant, N. R. and Vincent, K.: Review of the efficiency and cost of control measures for sulphur dioxide and volatile organic com-pounds, Draft final report AEAT-3851, AEA Technology, Cul-ham, UK, 1998.
Resource and Environmental Science Data Center: National 1 km
×1 km GDP data, 2003, available online at: http://www.resdc. cn/UA/, 2003.
Shanghai Environment Protection Bureau (SEPB): Shanghai Envi-ronment Bulletin 2008. Shanghai EnviEnvi-ronment Protection Bu-reau press, Shanghai, 2008 (in Chinese).
Streets, D. G., Gupta, S., Waldhoff, S. T., Wang, M. Q., Bond, T. C., and Bo, Y.: Black carbon emissions in China, Atmos. Environ., 35, 4281–4296, 2001.
Streets, D. G., Bond, T. C., Carmichael, G. R., Fernandes, S. D., Fu, Q., He, D., Klimont, Z., Nelson, S. M., Tsai, N. Y., Wang, M. Q., Woo, J. H., and Yarber, K. F.: An inventory of gaseous and primary aerosol emissions in Asia in the year 2000, J. Geophys. Res., 108(D21), 8809, doi:10.1029/2002JD003093, 2003. Sun, J., Shu, J., and Lu, X. Q.: Remote sensing interpretation and
its management information system of fugitive dust pollution sources in Shanghai, Shanghai Environmental Sciences, 22(2), 295–301, 2003 (in Chinese).
Tian, H. Z.: Studies on present and future emissions of nitrogen ox-ides and its comprehensive control polices in China, Ph.D. thesis, Tsinghua University, China, Beijing, 2003 (in Chinese). Tie, X. X. and Cao, J. J.: Aerosol pollution in China: Present and
fu-ture impact on environment, Particuology, 7(3), 426–431, 2009. U.S. Environmental Protection Agency (USEPA): Compilation of
air pollutant emission Factors, AP-42, 5th ed., Washington, DC, 2002.
Wang, B. G., Zhang, Y. H., Shao, M., Zhou, Y., and Feng, Z. C.: Sources apportionment of anthropogenic C2∼C9 non-methane hydrocarbons in the atmosphere of Guangzhou, China, Acta Sci-entiae Circumstantiae, 7, 1430–1440, 2008 (in Chinese). Wang, H. K., Chen, C. H., Huang, C., and Fu, L. X.: On-road
vehi-cle emission inventory and its uncertainty analysis for Shanghai, China, Sci. Total Environ., 398(1–3), 60–67, 2008.
Wang, L. T., Zhang, Q., Hao, J. M., and He, K. B.: Anthropogenic CO emission inventory of Mainland China, Acta Scientiae Cir-cumstantiae, 25(12), 1580–1585, 2005 (in Chinese).
Wei, W., Wang, S. X., Chatani, S., Klimont, Z., Cofala, J., and Hao, J. M.: Emission and speciation of non-methane volatile organic compounds from anthropogenic sources in China, Atmos. Envi-ron., 42, 4976–4988, 2008.
5273, 2006.
Yin, S. S., Zheng, J. Y., Zhang, L. J., and Zhong, L. J.: Anthro-pogenic ammonia emission inventory and characteristics in the Pearl River Delta region, Environ. Sci., 31(2), 1146–1151, 2010 (in Chinese).
Yuan, B., Shao, M., Lu, S. H., and Wang, B.: Source profiles of volatile organic compounds associated with solvent use in Bei-jing, China, Atmos. Environ., 44(15), 1919–1926, 2010. Zhang, C. Y., Wang, S. X., Zhao, Y., and Hao, J. M.: Current status
and future prospects of anthropogenic particulate matter emis-sions in China, Environ. Sci., 30(7), 1881–1887, 2009 (in Chi-nese).
Zhang, J., Smith, K. R., Ma, Y., Ye, S., Jiang, F., Qi, W., Liu, P., Khalil, M. A. K., Rasmussen, R. A., and Thorneloe, S. A.: Greenhouse gases and other airborne pollutants from household stoves in China: a data base for emission factors, Atmos. Envi-ron., 34, 4537–4549, 2000.
Zhang, Q.: Study on Regional Fine PM Emissions and Modeling in China, Ph.D. thesis, Tsinghua University, China, Beijing, 2005 (in Chinese).
Zhang, Q., Streets, D. G., He, K. B., Wang, Y. X., Richter, A., Burrows, J. P., Uno, I. Jang, C., Chen, D., Yao, Z. L., and Lei, Y.: NOxemission trend for China, 1995-2004: the view from the
ground and the view from space, J. Geophys. Res., 112, D22306, doi:10.1029/2007JD008684, 2007.
Zhang, Q., Streets, D. G., Carmichael, G. R., He, K. B., Huo, H., Kannari, A., Klimont, Z., Park, I. S., Reddy, S., Fu, J. S., Chen, D., Duan, L., Lei, Y., Wang, L. T., and Yao, Z. L.: Asian emis-sions in 2006 for the NASA INTEX-B mission, Atmos. Chem. Phys., 9, 5131–5153, doi:10.5194/acp-9-5131-2009, 2009. Zhang, Q. Y., Wei, Y. M., Tian, W. L., and Yang, K. M.: GIS-based
emission inventories of urban scale: A case study of Hangzhou, China, Atmos. Environ., 42, 5150–5165, 2008.
Zhang, Y., Dore, A. J., Ma, L., Liu, X. J., Ma, W. Q., Cape, J. N., and Zhang, F. S.: Agricultural ammonia emissions inventory and spatial distribution in the North China Plain, Environ. Pollut., 158, 490–501, 2010.
Zhejiang Environment Protection Bureau (ZJEPB): Zhejiang Provincial Environment Bulletin 2008.Zhejiang Environment Protection Bureau press, Jiangsu, 2008 (in Chinese).
Zheng, J. Y., Shao, M., Che, W. W., Zhang, L. J., Zhong, L. J., Zhang, Y. H., and Streets, D. G.: Speciated VOC emission in-ventory and spatial patterns of ozone formation potential in the Pearl River Delta, China, Environ. Sci. Technol., 43, 8580–8586, 2009a.