www.atmos-chem-phys.net/17/1227/2017/ doi:10.5194/acp-17-1227-2017
© Author(s) 2017. CC Attribution 3.0 License.
Variations of China’s emission estimates: response to
uncertainties in energy statistics
Chaopeng Hong1,2, Qiang Zhang1,5, Kebin He2,4,5, Dabo Guan1,3, Meng Li1,2, Fei Liu1,2, and Bo Zheng2
1Ministry of Education Key Laboratory for Earth System Modeling, Department of Earth System Science,
Tsinghua University, Beijing, China
2State Key Joint Laboratory of Environment Simulation and Pollution Control, School of Environment,
Tsinghua University, Beijing, China
3School of International Development, University of East Anglia, Norwich NR4 7TJ, UK
4State Environmental Protection Key Laboratory of Sources and Control of Air Pollution Complex, Beijing, China 5Collaborative Innovation Center for Regional Environmental Quality, Beijing, China
Correspondence to:Qiang Zhang ([email protected])
Received: 29 May 2016 – Published in Atmos. Chem. Phys. Discuss.: 7 June 2016
Revised: 14 November 2016 – Accepted: 19 December 2016 – Published: 25 January 2017
Abstract. The accuracy of China’s energy statistics is of great concern because it contributes greatly to the uncertain-ties in estimates of global emissions. This study attempts to improve the understanding of uncertainties in China’s energy statistics and evaluate their impacts on China’s emissions during the period of 1990–2013. We employed the Multi-resolution Emission Inventory for China (MEIC) model to calculate China’s emissions based on different official data sets of energy statistics using the same emission factors. We found that the apparent uncertainties (maximum discrep-ancy) in China’s energy consumption increased from 2004 to 2012, reaching a maximum of 646 Mtce (million tons of coal equivalent) in 2011 and that coal dominated these uncer-tainties. The discrepancies between the national and provin-cial energy statistics were reduced after the three economic censuses conducted during this period, and converging un-certainties were found in 2013. The emissions calculated from the provincial energy statistics are generally higher than those calculated from the national energy statistics, and the apparent uncertainty ratio (the ratio of the maximum dis-crepancy to the mean value) owing to energy uncertainties in 2012 took values of 30.0, 16.4, 7.7, 9.2 and 15.6 %, for SO2, NOx, VOC, PM2.5 and CO2 emissions, respectively.
SO2emissions are most sensitive to energy uncertainties
be-cause of the high contributions from industrial coal combus-tion. The calculated emission trends are also greatly affected by energy uncertainties – from 1996 to 2012, CO2and NOx
emissions, respectively, increased by 191 and 197 % accord-ing to the provincial energy statistics but by only 145 and 139 % as determined from the original national energy statis-tics. The energy-induced emission uncertainties for some species such as SO2 and NOx are comparable to total un-certainties of emissions as estimated by previous studies, in-dicating variations in energy consumption could be an im-portant source of China’s emission uncertainties.
1 Introduction
Chemical Transport Experiment-Phase B (INTEX-B; Zhang et al., 2009), Multi-resolution Emission Inventory for China (MEIC; http://www.meicmodel.org/), Regional Emission in-ventory in Asia (REAS; Ohara et al., 2007; Kurokawa et al., 2013), Emission Database for Global Atmospheric Research (EDGAR; http://edgar.jrc.ec.europa.eu/index.php) and Greenhouse Gas and Air Pollution Interactions and Synergies (GAINS; http://gains.iiasa.ac.at/models/), China’s emission inventories are thought to be quite uncertain be-cause of uncertainties in activity-related data, such as energy consumption data, and a lack of local emission factors (Zhao et al., 2011).
China has now become the world’s top consumer of pri-mary energy; however, the reliability of China’s energy statistics has frequently been questioned (Sinton, 2001; Aki-moto et al., 2006; Guan et al., 2012). The accuracy of China’s energy statistics is of great concern because it contributes greatly to uncertainties in estimates of global emissions (Marland et al., 2012). Several inconsistencies exist among different sets of official energy statistics, namely, the na-tional (CT-CESY, country-total) and provincial (PBP-CESY, province-by-province) energy balance sheets from the China Energy Statistical Yearbook (CESY) and the energy balance sheets from the International Energy Agency (IEA). These inconsistencies in energy consumption may lead to signifi-cant discrepancies in China’s emission estimates. As previ-ously reported (Akimoto et al., 2006), the increases in NOx emissions estimated based on the PBP-CESY and IEA2004 data from the 1996–2002 period are 25 and 15 %, respec-tively, and that estimated from the CT-CESY data is even lower. Zhao et al. (2011) used Monte Carlo methods to qutify the uncertainties of a bottom-up inventory of Chinese an-thropogenic atmospheric pollutants and found that emission factors, rather than activity levels (e.g., energy consumption), are the main source of uncertainties in Chinese emission esti-mates. However, relatively small uncertainties in the activity levels for the year 2005 (i.e., coefficients of variance of 5, 10 and 20 % for the activity levels of the power sector, industrial combustion and residential fossil fuel use, respectively) were considered in their study. Some studies have noted the large uncertainties in energy statistics in recent years and their im-pacts on CO2emission estimates (Guan et al., 2012; Z. Liu et
al., 2015; Korsbakken et al., 2016). Guan et al. (2012) found that CO2emissions calculated on the basis of two publicly
available energy data sets (i.e., CT-CESY and PBP-CESY) for 2010 differ by 1.4 gigatons, which is equivalent to ap-proximately 5 % of the global total. Z. Liu et al. (2015) es-timated that total energy consumption in China was 10 % higher in 2000–2012 than the value reported by China’s na-tional statistics. Korsbakken et al. (2016) used correlated economic quantities to constrain growth rates in total coal-derived energy use. They pointed out uncertainties around reductions in China’s coal use and CO2emissions in recent
years, questioned the 2.9 % drop in Chinese coal consump-tion in 2014 in preliminary official statistics and showed that
it was inappropriate for estimating CO2emissions. Previous
studies on the uncertainties in China’s energy statistics and emissions are typically applicable either to an early period or for only a few species (usually CO2and NOx).
This paper strives to present an evaluation of the uncertain-ties in China’s energy statistics and their effects on emission estimates for China during the period from 1990 to 2013. The evaluated species include SO2, NOx, VOC, PM2.5and CO2.
In this study, apparent uncertainties in China’s energy statis-tics were evaluated through detailed comparisons of publicly available energy statistics to provide indirect but still useful information regarding the range of uncertainty of existing en-ergy activity data. We defined the apparent uncertainty as the maximum discrepancy among different data sets and the ap-parent uncertainty ratio as the ratio of the maximum discrep-ancy to the mean value from the different data sets. Apparent uncertainty is a straightforward metric used to quantitatively gauge the apparent discrepancies between different existing data sets. Apparent uncertainty ratio is a metric to quantify the relative deviation. Thus apparent uncertainty could partly reflect actual uncertainty. In general, large apparent uncer-tainty reflects large discrepancies, which might indicate large actual uncertainty. However, it should be noted that appar-ent uncertainty could not fully represappar-ent actual uncertainty, and apparent uncertainty would likely be conservative esti-mates as it might be subjected to the data sets used. Thus small apparent uncertainty does not necessarily mean small actual uncertainty. To evaluate the impact of these energy un-certainties on China’s emissions and the emission trends, we established several emission inventories based on these en-ergy statistics in the framework of the MEIC inventory using the same emission factors.
This paper is organized as follows. Section 2 summarizes the methods and data that were used in this work, including the energy statistics for China, and the MEIC emission in-ventory. In Sect. 3, we evaluate the apparent uncertainties in China’s energy statistics and their impacts on China’s emis-sions and the emission trends. In Sect. 4, we discuss the re-liability of China’s energy statistics and the implications for other inventories.
2 Data and methods 2.1 China’s energy statistics
na-Table 1.The energy statistics for China involved in this work.
Energy statistics Data source National/provincial Description level
CT-CESY-Ori NBS National For each year from 1990 to 2013, the original edition of the national Energy balance sheets published in the CESY was used.
CT-CESY-1C NBS National For 1999–2003, the revised edition of the national energy balance sheets released after the first economic census (published in CESY2005) was used; for other years, the data were the same as in CT-CESY-Ori.
CT-CESY-2C NBS National For 1996–2007, the revised edition of the national energy balance sheets released after the second economic census (published in CESY2009) was used; for other years, the data were the same as in CT-CESY-1C.
CT-CESY-3C NBS National For 2000–2012, the revised edition of the national energy balance sheets released after the third economic census (published in CESY2014) was used; for other years, the data were the same as in CT-CESY-2C.
PBP-CESY NBS Provincial The provincial energy balance sheets for each year published in the CESY were used.
CT-IEA-2012 IEA National China’s energy statistics from the IEA World Energy Balances (2012 edition) were used.
CESY: China Energy Statistics Yearbook; NBS: National Bureau of Statistics; IEA: International Energy Agency. CESY2005, CESY2009 and CESY2014 denote the revised national energy data for the periods of 1999–2003, 1996–2007 and 2000–2012, which were released after the first, second and third economic censuses, respectively. Note that the IEA energy statistics were used for comparison, but they were excluded from the uncertainty calculations in the current work.
tional energy data for the periods of 1999–2003, 1996–2007 and 2000–2012, respectively, based on the results of the first, second and third national economic censuses conducted dur-ing this time. The IEA also publishes energy statistics for China, which have been widely used in international emis-sion inventories (such as EDGAR). The IEA also regularly revises its energy statistics and is now operating in coop-eration with the NBS, who annually provides the IEA with China’s energy statistics, and in recent years the IEA statis-tics have been found to be quite consistent with the NBS’s national energy balance sheet.
Six data sets of energy statistics were involved in this study: the original edition of the national energy balance sheets from the CESY (CT-CESY-Ori) and its revisions fol-lowing the first economic census (CT-CESY-1C), the sec-ond economic census (CT-CESY-2C) and the third eco-nomic census (CT-CESY-3C); the provincial energy balance sheets from the CESY (PBP-CESY); and the 2012 edition of China’s energy statistics from the IEA (CT-IEA-2012). These data sets are summarized in Table 1. Note that here CT-CESY-Ori represents the first edition of national energy statistics covering the whole period 1990–2013. For revised national energy statistics (i.e., CT-CESY-1C, CT-CESY-2C, CT-CESY-3C), the data were taken from the previous edition for years for which revised data were unavailable. Although energy statistics for 2014 are already published, we did not include the year 2014, for the reason that the emission inven-tory is being updated. The IEA energy statistics were used for comparison, but they were excluded from the uncertainty
Figure 1.Apparent uncertainties (shown as filled areas) in China’s energy consumption from 1990 to 2013, by energy type. Note that CT-CESY-Ori, CT-CESY-1C, CT-CESY-2C and CT-CESY-3C are shown for 1990–2003, 1999–2007, 1996–2012 and 2000–2013, re-spectively.
2.2 Emission inventory
The MEIC emission inventory model (http://www. meicmodel.org) was used in this study to investigate the emission responses to different energy statistics. MEIC is a dynamic technology-based inventory developed for China covering the years from 1990 to 2013 by Tsinghua University following the work of INTEX-B (Zhang et al., 2009), with several updates, such as a unit-based emission inventory of power plants (F. Liu et al., 2015), a high-resolution vehicle emission inventory at the county level (Zheng et al., 2014) and an improved non-methane volatile organic carbon (NMVOC) speciation approach for various chemical mechanisms (Li et al., 2014). The MEIC inventory includes recent control policies based on the available official reports (Ministry of Environmental Protection of China (MEP), 1991–2014, 2000–2014). The MEIC version 1.1 (MEIC v1.1) uses energy consumption data from PBP-CESY, excluding diesel and gasoline consumption data, which are taken from the national energy statistics (currently CT-CESY-1C) because the diesel consumption data provided in the national energy statistics were thought to possibly be more reliable (Zhang et al., 2007). The emissions in MEIC were estimated as a product of the activity rate (such as energy consumption or material production), the technology distributions of fuel/production and emission control, the unabated emission factor and the removal efficiency. Thus, the emission estimates can be simplified as the activity rates multiplied by their respective net emission factors of different fuel/product types in different sectors. Note that the net emission factors in MEIC change dynamically driven by the technology renewal process year by year. Technology distributions within each sector are obtained from Chinese statistics, a wide range of unpublished statistics by various industrial association and technology reports. For example, technology distributions in the power sector were obtained from a unit-base database (F. Liu et al., 2015). Technology distributions in the transportation sector were estimated based on a fleet model (Zheng et al., 2014). The methods of emission estimates have been documented in our previous work (Zhang et al., 2007, 2009; Zheng et al., 2014; F. Liu et al., 2015).
To further explore the impact of energy data inconsisten-cies on estimates of China’s emissions, five emission invento-ries based on five sets of energy statistics (i.e., CT-CESY-Ori, CT-CESY-1C, CT-CESY-2C, CT-CESY-3C and PBP-CESY) were established in the framework of the MEIC inventory. Note that only energy data were changed in the calculations of these emission inventories, while other data such as net emission factors remained the same as in the MEIC inven-tory. Thus the emission uncertainties derived from these in-ventories are only those associated with energy uncertainties. They do not include uncertainties in the emission factors and other parameters in the MEIC inventory, which is not ad-dressed in this study. For different energy data sets, the same
net emission factors were applied for fuel consumption in a given sector in each year during the emission calculations. In fact, energy differences might change the technology re-newal process and further change the net emission factors. However, considering that those assumptions would likely add additional uncertainty and we do not discuss the uncer-tainties in emission factors, such indirect impacts on emis-sion factors are not included in this study. We only applied all the fuel consumption differences to the combustion sectors. The sectoral categories are consistent across all the energy data sets from NBS (Table S1 in the Supplement). The same scale factor in fuel consumption was applied for all the sub-categories in the same major sector (e.g., industrial coal-fired boilers and kilns in the industrial sector, on-road diesel vehi-cles and off-road mobile sources in the transportation sector). The possible uncertainties in feedstocks and products result-ing from energy uncertainties are not included in this study, and also the uncertainties in biomass consumption are not included due to lack of multiple data sets; thus our estimates of emission uncertainties are likely on the conservative side. As the emission calculations were performed with province-level data, energy consumption in the national energy statis-tics was directly allocated to provinces by using the ratios derived from the provincial energy statistics.
3 Results
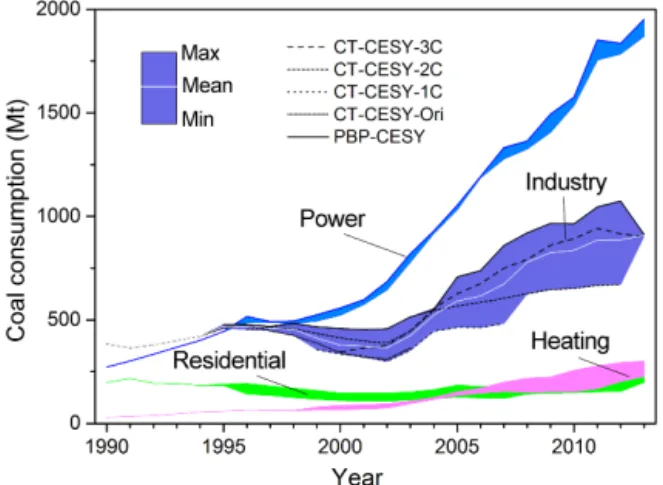
Figure 2.Apparent uncertainties (shown as filled areas) in China’s coal consumption from 1990 to 2013, by sector. Note that CT-CESY-Ori, CT-CESY-1C, CT-CESY-2C and CT-CESY-3C are shown for 1990–2003, 1999–2007, 1996–2012 and 2000–2013, re-spectively.
period have been reported in many previous studies (Sinton, 2001; Akimoto et al., 2006; Zhang et al., 2007), but few stud-ies (Guan et al., 2012; Z. Liu et al., 2015; Korsbakken et al., 2016) have noted the more recent rapid-growth period. Con-verging uncertainties are observed in 2013, with the release of the newest energy statistics based on the third economic census – the apparent uncertainty in total energy consump-tion for 2013 is reduced to 62 Mtce, and the corresponding apparent uncertainty ratio is only 1.5 %. We notice that the apparent uncertainty for 2014 (not shown here) is similar to that for 2013, also much smaller than that during the recent period of rapid growth (2004–2012).
With regard to different types of energy, coal domi-nates the apparent uncertainties in total energy tion. The average apparent uncertainties in coal consump-tion for 1996–2003, 2004–2012 and 2013 are 147, 428 and 194 Mtce, respectively, and the corresponding apparent un-certainty ratios are 14.2, 19.4 and 6.7 %. The sum of the provincial data (PBP-CESY) is generally higher than the na-tional total (i.e., CT-CESY-Ori, CT-CESY-1C, CT-CESY-2C and CT-CESY-3C) with regard to total energy consumption and coal consumption. After each of the three economic cen-suses, the national total energy consumption data (CT-CESY-1C, CT-CESY-2C and CT-CESY-3C) were revised upward to approach the provincial totals, primarily by adjusting the coal-related data. The apparent uncertainties in oil consump-tion during 1996–2003 are relatively large, with a mean of 48 Mtce and an average apparent uncertainty ratio of 15.8 %. The provincial total oil consumption is lower than the na-tional total for 1996–2003, but this situation is reversed be-tween 2005 and 2011. The apparent uncertainties in the con-sumption of natural gas and other types of energy are smaller than the uncertainties in coal and oil, suggesting that the
sta-tistical data for natural gas and other energy sources may be more accurate because their use is generally metered.
The apparent uncertainties in coal consumption were fur-ther analyzed by sector, as shown in Fig. 2. As the largest consumer of coal in China, the power sector is found to ex-hibit less uncertainty in its coal consumption than other sec-tors. Coal consumption in the industrial sector is highly un-certain, with an apparent uncertainty ratio for 2012 of 45.4 %, which represents the greatest contribution to the total uncer-tainty in coal consumption. A significant decrease in coal consumption in the industrial sector during 1996–2002 is ob-served in the CT-CESY-Ori data, and this decrease resulted in a slight decrease in the total coal consumption. For the heating sector and the residential sector, although the levels of coal consumption in these two sectors are smaller than those in the power and industrial sectors, comparable appar-ent uncertainties are also found; the apparappar-ent uncertainty ra-tios for the heating and residential sectors in 2012 are 37.8 and 46.9 %, respectively.
3.2 Effects on China’s emission estimates
To evaluate the effects of uncertainties in the energy statis-tics on China’s emission estimates, five emission invento-ries based on different sets of energy statistics (i.e., CT-CESY-Ori, CT-CESY-1C, CT-CESY-2C, CT-CESY-3C and PBP-CESY) were established. Figure 3 shows the apparent uncertainties in China’s emissions during 1990–2013. Fig-ure 4 shows the apparent uncertainty ratio in China’s sions during 1990–2013. It should be noted that the emis-sion uncertainties discussed below, which were derived from these five emission inventories, are based only on uncertain-ties in the energy data; thus, they could reflect the impacts of energy uncertainties on emission estimates. For the early period (1996–2003), the average apparent uncertainties for SO2, NOx, VOC, PM2.5and CO2are 2.10, 0.83, 0.41, 0.34
and 278 Tg, respectively, and the corresponding apparent un-certainty ratios are 10.2, 6.7, 3.2, 2.8 and 6.7 %. For the re-cent period of rapid growth (2004–2012), the apparent un-certainties are increasing over time and are more significant than those in the early period, although this fact has rarely been discussed in the literature; the average apparent uncer-tainties during this period for SO2, NOx, VOC, PM2.5 and
CO2are 5.77, 2.98, 1.60, 0.80 and 1026 Tg, respectively, and
the corresponding apparent uncertainty ratios are 20.4, 12.6, 7.7, 6.4 and 12.4 %. For 2012, the apparent uncertainties for these species are 7.76, 4.68, 1.90, 1.10 and 1633 Tg, respec-tively, and the corresponding apparent uncertainty ratios are 30.0, 16.4, 7.7, 9.2 and 15.6 %. The apparent uncertainty for CO2 in 2010 is 1283 Tg in this study, which is similar to
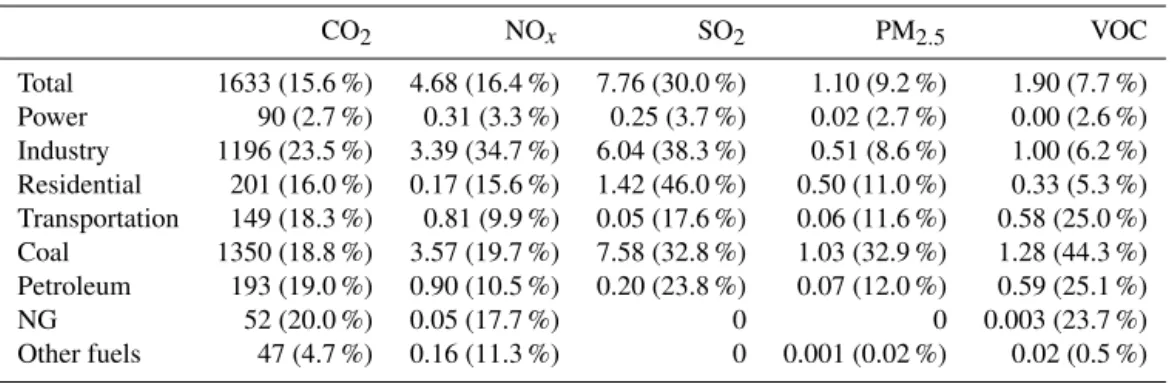
Table 2.Apparent uncertainties in China’s emissions in 2012 by sector and energy type. The apparent uncertainties are expressed in units of teragrams (Tg). The percentages shown in parentheses indicate the apparent uncertainty ratios. Note that the emission uncertainties shown here are only those associated with energy uncertainties.
CO2 NOx SO2 PM2.5 VOC
Total 1633 (15.6 %) 4.68 (16.4 %) 7.76 (30.0 %) 1.10 (9.2 %) 1.90 (7.7 %) Power 90 (2.7 %) 0.31 (3.3 %) 0.25 (3.7 %) 0.02 (2.7 %) 0.00 (2.6 %) Industry 1196 (23.5 %) 3.39 (34.7 %) 6.04 (38.3 %) 0.51 (8.6 %) 1.00 (6.2 %) Residential 201 (16.0 %) 0.17 (15.6 %) 1.42 (46.0 %) 0.50 (11.0 %) 0.33 (5.3 %) Transportation 149 (18.3 %) 0.81 (9.9 %) 0.05 (17.6 %) 0.06 (11.6 %) 0.58 (25.0 %) Coal 1350 (18.8 %) 3.57 (19.7 %) 7.58 (32.8 %) 1.03 (32.9 %) 1.28 (44.3 %) Petroleum 193 (19.0 %) 0.90 (10.5 %) 0.20 (23.8 %) 0.07 (12.0 %) 0.59 (25.1 %) NG 52 (20.0 %) 0.05 (17.7 %) 0 0 0.003 (23.7 %) Other fuels 47 (4.7 %) 0.16 (11.3 %) 0 0.001 (0.02 %) 0.02 (0.5 %)
Figure 4.Apparent uncertainty ratio in China’s emissions during 1990–2013. Note that the emission uncertainties shown here are only those associated with energy uncertainties.
after the third economic census. Note that the emission dis-crepancies calculated from the provincial and national en-ergy statistics get smaller after the third economic census (i.e., PBP-CESY and CT-CESY-3C), compared with those before the third economic census (e.g., PBP-CESY and CT-CESY-2C). For example, CO2emission discrepancy in 2010
between PBP-CESY and CT-CESY-3C is only 548 Tg, much less than that reported by Guan et al. (2012), in which the NBS’s data before the third economic census were used.
It should be noted that the apparent uncertainties calcu-lated in this study are subjected to the energy data sets used. For example, the small apparent uncertainties before 1996 might become larger if a new energy data set that revises the data of this period is included. Apparent uncertainties during the recent period of rapid growth (2004–2012) are higher than during the early period (1996–2003), implying that the discrepancies might be accumulated and expanded for a period of rapid growth. For example, underestimates of the growth trends of small enterprises might result in accu-mulated underestimations. Note that the energy consumption apparently became more consistent between provincial and
national statistics after the three economic censuses, indicat-ing that the new energy statistics after the economic census may include evolved methodologies for data collection and more cross-checks to reduce the discrepancies. In this case, conducting censuses in some interval years could help to reduce the accumulated discrepancies. The apparent uncer-tainty ratio in the years when economic censuses were newly conducted (i.e., 2004, 2008 and 2013) is generally less than that in previous years (i.e., 2003, 2007 and 2012), as shown in Fig. 4. The converging uncertainties in 2013 may also be caused by the third economic census.
As seen, the energy-induced uncertainties in emissions dif-fer by species; the largest uncertainties are observed for SO2,
followed by NOx and CO2, and the smallest are found for
PM2.5and VOC. Taking the year 2012 as a case in which the
uncertainties are prominent, the emission uncertainties were separated by sector and by energy type, as shown in Table 2. SO2 emissions are more sensitive to energy uncertainties
than are CO2emissions because of the high contribution
(ap-proximately 50 %) from industrial coal combustion, which is the largest source of uncertainty in SO2emissions (6.04 Tg).
A large fraction (approximately 24 %) of NOx emissions is contributed by the use of diesel in the transportation sector; the corresponding activity data have a lower uncertainty ratio than that for coal use, leading to a lower sensitivity than that of SO2. PM2.5 and VOC emissions also show less
sensitiv-ity to energy uncertainties because they represent relatively small contributions from energy consumption and high con-tributions (approximately 40–60 %) from industrial process emissions. Note that non-combustion emission uncertainty is not addressed in this study. With regard to contributions by sector, industry is the dominant sector, accounting for 77.8, 72.3, 46.8, 52.4 and 73.2 % of the total apparent uncertainties in SO2, NOx, PM2.5, VOC and CO2emissions, respectively.
Although the power sector is a major source of emissions of many species (contributing approximately 25–35 % of the total emissions of CO2, NOxand SO2), it is estimated to
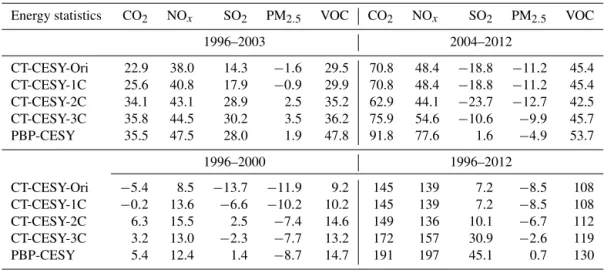
con-Table 3.Emission trends for China derived from different energy statistics (growth rate, %).
Energy statistics CO2 NOx SO2 PM2.5 VOC CO2 NOx SO2 PM2.5 VOC
1996–2003 2004–2012
CT-CESY-Ori 22.9 38.0 14.3 −1.6 29.5 70.8 48.4 −18.8 −11.2 45.4 CT-CESY-1C 25.6 40.8 17.9 −0.9 29.9 70.8 48.4 −18.8 −11.2 45.4 CT-CESY-2C 34.1 43.1 28.9 2.5 35.2 62.9 44.1 −23.7 −12.7 42.5 CT-CESY-3C 35.8 44.5 30.2 3.5 36.2 75.9 54.6 −10.6 −9.9 45.7 PBP-CESY 35.5 47.5 28.0 1.9 47.8 91.8 77.6 1.6 −4.9 53.7
1996–2000 1996–2012
CT-CESY-Ori −5.4 8.5 −13.7 −11.9 9.2 145 139 7.2 −8.5 108 CT-CESY-1C −0.2 13.6 −6.6 −10.2 10.2 145 139 7.2 −8.5 108 CT-CESY-2C 6.3 15.5 2.5 −7.4 14.6 149 136 10.1 −6.7 112 CT-CESY-3C 3.2 13.0 −2.3 −7.7 13.2 172 157 30.9 −2.6 119 PBP-CESY 5.4 12.4 1.4 −8.7 14.7 191 197 45.1 0.7 130
sumption in the power sector. Transportation is another key contributor to emission uncertainties for NOx (contributing 17.3 % of the uncertainty for this species), whereas the res-idential sector is significant for SO2(contributing 18.3 % of
the uncertainty). With regard to energy type, 97.6 and 93.8 % of the emission uncertainties of SO2and PM2.5, respectively,
originate from coal, whereas 31.2 % of the VOC emission uncertainties come from oil. The contributions of gas and other fuels are negligible because uncertainties in biomass consumption are not included and other emissions are rela-tively small. Note that biomass consumption, which is usu-ally thought to be quite uncertain, would contribute more un-certainties in emissions.
Discrepancies in energy data affect not only the abso-lute emission estimates for individual years but also multi-year emission trends because of the interannual variability of these discrepancies. Table 3 compares the emission trends for China derived from different energy statistics. For the early period (1996–2003), slower growth rates of CO2, NOx and SO2emissions are found from the CT-CESY-Ori
inven-tory (22.9, 38.0 and 14.3 %, respectively) than from the PBP-CESY inventory (35.5, 47.5 and 28.0 %, respectively), which is consistent with previous studies (Akimoto et al., 2006; Zhang et al., 2007). The trends derived from the national en-ergy statistics were revised upward after each of the three economy censuses, bringing them closer to those indicated by the provincial energy statistics. SO2and CO2show a dip
according to the CT-CESY-Ori inventory, but this effect is not significant in the PBP-CESY inventory. SO2 emissions
declined by 13.7 % during the period of 1996–2000 accord-ing to the CT-CESY-Ori inventory but increased by 1.4 % ac-cording to the PBP-CESY inventory. These differences re-flect the large uncertainties in industrial coal consumption during 1996–2000 – a decline of 28.4 % is indicated by CT-CESY-Ori, whereas only a slight decrease of 3.8 % is found from PBP-CESY. It should be noted that the dip for NOx
emissions is not as distinct as that for CO2. This is because
the fuel consumption in the power and transportation sec-tors, for which the NOxemission factors are the largest, was steadily increasing during this period.
In the recent period of rapid growth (2004–2012), CO2and
NOx emissions, respectively, increased by 91.8 and 77.6 % according to the PBP-CESY inventory but by only 70.8 and 48.4 % as determined from the CT-CESY-Ori inventory; SO2 emissions increased by 1.6 % according to the
PBP-CESY inventory but decreased by 18.8 % as indicated by the CT-CESY-Ori inventory. For the period from 1996 to 2012, the CO2growth rates inferred from the CT-CESY-Ori,
CT-CESY-3C and PBP-CESY inventories are 145, 172 and 191 %, respectively, similar to the growth rates in the total energy consumption (160, 197 and 207 %); the differences between different energy statistics demonstrate that trends in CO2 emissions are good indicators of trends in energy
consumption. NOx and SO2 also show marked differences
in emission growth – increases by 197 and 45.1 % during 1996–2012 according to the provincial energy statistics but by only 139 and 7.2 % as determined from the original na-tional energy statistics. From 2012 to 2013, the total energy consumption and CO2emissions, respectively, increased by
3.7 and 3.7 % as seen from CT-CESY-3C but decreased by 0.4 and 2.1 % according to PBP-CESY. The GDP increased by 7.7 % between 2012 and 2013; thus, the decreasing trend in CO2 emissions indicated by PBP-CESY is unexpected.
Korsbakken et al. (2016) also pointed out that initial claims that Chinese CO2 emissions fell in 2014 according to
pre-liminary official statistics were probably premature. The un-expected energy and CO2emission decline in 2013 in
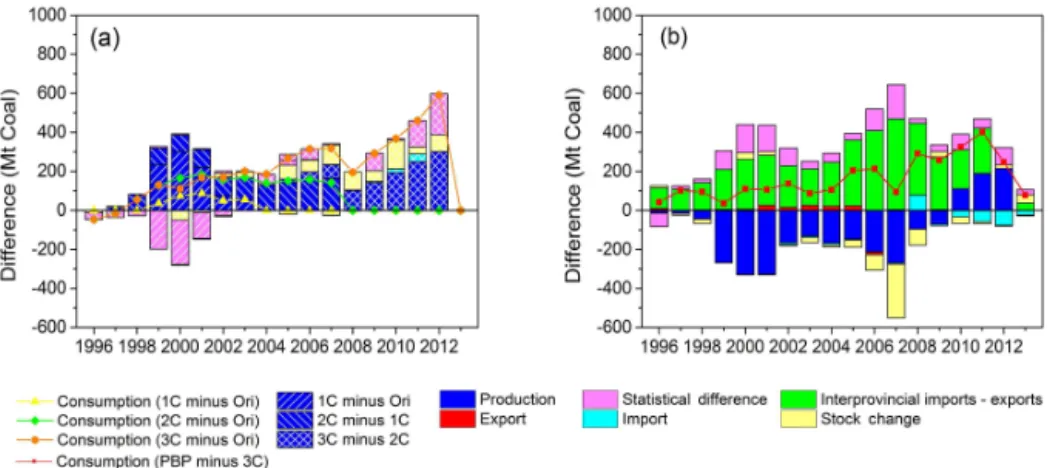
Figure 5.Differences in coal consumption between different energy statistics, from the supply perspective:(a)CT-CESY-1C (1C)/ CT-CESY-2C (2C)/CT-CESY-3C (3C)−CT-CESY-Ori (Ori);(b)PBP-CESY (PBP)−CT-CESY-3C (3C). From the supply perspective, con-sumption=production−exports+imports+change in stock+statistical difference.
other for the period 1996–2013 than periods before 2013 (e.g., 1996–2012). As part of the Chinese five-year plan, the Chinese government established a set of targets for emission reduction, including a 10 % SO2reduction from the 2005
lev-els by 2010 and reductions of 10 % in NOx and 8 % in SO2
from the 2010 levels by 2015. Our results show that, because uncertainties in energy statistics can lead to the inference of different emission trends, reliable energy data are crucially important for obtaining accurate estimates of both the abso-lute levels of emissions and their trends.
4 Discussion
4.1 Understanding the reliability of energy statistics The large uncertainties between the national and provincial energy statistics can be explained in terms of both inade-quacies in China’s statistical system and artificial factors. First, China’s statistical data are generally collected and re-ported from bottom to top, and there is a lack of effective means of cross-checking at the local level; thus, these data are faced with problems such as data inconsistency and dou-ble counting (Wang et al., 2014). Inconsistencies between interprovincial imports and exports have been found in the provincial energy statistics – the sum of coal “interprovincial imports” is higher than the sum of coal “interprovincial ex-ports” (Zhang et al., 2007). Also, provincial statistics more likely include double counting because certain interprovin-cial activities are claimed by all provinces involved. A simi-lar situation affects economic statistics: the aggregate provin-cial GDP in 2012 was approximately 11 % larger than the national total. Second, unlike for large- and medium-size en-terprises, which have defined data collection and reporting procedures, the energy data for small enterprises are merely estimated, which could strongly degrade the data quality of the energy statistics (Jiang et al., 2009; Wang and William,
2011; Wang, 2014). A typical example is that the original of-ficial statistics (CT-CESY-Ori) did not fully count the coal production of illegal small coal mines, leading to underesti-mations in coal production around 2000 (Wang and William, 2011; Guan et al., 2012). Third, certain signs indicate that en-ergy data may be modified for artificial purposes (Guan et al., 2012). The energy revisions after the second economic cen-sus (CT-CESY-2C) were found to bring the country closer to achieving its energy conservation targets (Aden, 2010). We also notice that some provinces had zero statistical dif-ference; i.e., the supply data matches the consumption data exactly, which might mean that some provincial data were adjusted to achieve the exact match.
(CT-CESY-Ori) and lower than that from the revised national energy statistics (CT-CESY-3C), which could help partially explain the interprovincial net imports during this period as underestimates in production. Moreover, the provincial en-ergy statistics likely include double counting and thus might result in overestimates. This effect may be more significant in recent years with the more frequent collaboration among companies at the provincial level.
Satellite observations, which have been widely used in the assessment of emission trends in previous studies (e.g., Richter et al., 2005; van de A et al., 2008; Stavrakou et al., 2008; Lamsal et al., 2011), could be used as one independent approach to verifying energy statistics. Akimoto et al. (2006) compared trends in bottom-up NOxemissions with satellite-derived NO2columns for the period of 1996–2002 and found
that the emission trends derived from various energy statis-tics were all lower than those inferred from the satellite ob-servations (which increased by 50 %). The PBP-CESY trends were within the uncertainty of the satellite observations, whereas the IEA2004 and CT-CESY trends were apparently underestimated beyond the uncertainty of the satellite obser-vations. Zhang et al. (2007) compared trends over China in bottom-up NOx emissions with satellite NO2 columns
ob-served from 1996 to 2004 and found a larger trend in the satellite NO2 columns than in the NOx emissions. Berezin et al. (2013) derived top-down estimates of CO2 emission
trends by means of the satellite-derived NOxemission trends obtained using an inverse model and CO2-to-NOx emis-sion ratios (i.e., CO2/NOx) from bottom-up inventories. They also found a significant quantitative difference between bottom-up and indirect top-down estimates of the CO2
emis-sion trend for the period of 1996–2001, and the difference for the period of 2001–2008 was found to be in the range of possible systematic uncertainties associated with their esti-mation method.
Previous studies have investigated the decline in energy consumption between 1997 and 2001 indicated by CT-CESY-Ori (Akimoto et al., 2006; Sinton, 2001; Sinton and Fridley, 2000; Zhang et al., 2007; Berezin et al., 2013). This supposed decline was completely eliminated after the revi-sions following the three censuses. This fact may support the conclusion of these early studies that the trend in en-ergy consumption indicated by the provincial enen-ergy statis-tics was more accurate than that derived from the unrevised national energy statistics during the early period. Z. Liu et al. (2015) estimated total Chinese energy consumption by adopting the apparent consumption approach and estimated a value for 2000–2012 that was 10 % higher than that reported in China’s national statistics before the third economic cen-sus and lower than that from the provincial energy statistics. The discrepancies between the national and provincial en-ergy statistics were reduced after the three economic cen-suses. These facts indicate that the newest energy statistics after the third economic census may include evolved method-ologies for data collection and more cross-checks to reduce
Figure 6. (a) CO2 and (b) NOx emission trends in China, and the temporal evolution of the overall NOx-to-CO2ratio(c)from
different inventories and(d) in different major sectors according to the MEIC, EDGAR v4.2 and REAS (v1.11 and v2.1) emis-sion inventories. The following trends (2008 values relative to 1996 values) are also shown: trends in total energy consumption from PBP-CESY (Energy-PBP-CESY) and CT-CESY-Ori (Energy-CT-CESY); NOxemission trends calculated using the CO2trend from
MEIC and the NOx-to-CO2ratios from EDGAR (EDGAR−MEIC
CO2); and satellite-derived CO2emission trends from Berezin et
al. (2013) derived using the CO2-to-NOx ratios from EDGAR (Berezin-EDGAR), MEIC (Berezin-MEIC) and the lower bound-ary of MEIC (Berezin-MEIC-HighNOx).
inconsistencies between the national and provincial energy statistics and thus can be recommended for use. In con-trast, the energy consumption indicated by the national en-ergy statistics from before the third economic census may be underestimated because of underestimations in energy pro-duction, whereas the energy consumption indicated by the provincial energy statistics from before the third economic census may be overestimated because of double counting.
4.2 Implications for other studies
In this study, we find that uncertainties in energy statistics have great impacts on China’s emission estimates, which could also be used to partially explain different emission estimates from other inventories. The Ministry of Environ-mental Protection of China tends to estimate lower SO2and
NOx emissions than MEIC (e.g., 30 % lower for SO2 and
20 % lower for NOx in 2012). Lower energy consumption from the national energy statistics, compared with provin-cial energy statistics, could help to explain the differences in emissions. Trends in CO2emissions are good indicators of
compared the emission trends for CO2and NOx in MEIC, the Asian inventory REAS and the global inventory EDGAR (Fig. 6). From 1996 to 2001, CO2emissions increased by 9.6
and 9.2 % according to MEIC and REAS, respectively, but increased by only 0.4 % according to EDGAR; total energy consumption increased by 11.5 and 3.1 % according to PBP-CESY and CT-PBP-CESY-1C, respectively, during the same pe-riod. From 1996 to 2008, CO2emissions increased by 135 %
according to MEIC but increased by only 114 % according to EDGAR; total energy consumption increased by 138 and 110 % according to PBP-CESY and CT-CESY-1C, respec-tively. These differences indicate that the energy consump-tion indicated by EDGAR, which was created using the IEA energy statistics, is likely closer to the national energy statis-tics.
The differences in NOx emission trends could be par-tially explained by differences in the energy statistics. Dur-ing the period of 1996–2008, NOx emissions increased by 127 % according to MEIC but by only 76 % according to EDGAR. If the CO2growth trend were to be replaced with
that from MEIC while keeping the same NOx-to-CO2
ra-tios, a greater (93 %) increase in NOx emissions would be found from EDGAR. However, significant differences also arise from the emission factors (i.e., the NOx-to-CO2ratios):
the overall NOx-to-CO2 ratio decreased by only 3.5 % in
MEIC for the 1996–2008 period but decreased by 17.9 % in EDGAR. Similar trends in the overall NOx-to-CO2ratio are
found between MEIC and REAS: it increased from 1996 to 2001, primarily driven by a faster growth rate of diesel con-sumption (46–51 %), which has a higher NOx-to-CO2ratio,
than of coal consumption (−15 to 7 %), but it then decreased after 2004, primarily because of the implementation of NOx emission standards in the power and transportation sectors. It should be noted that EDGAR tends to estimate a much earlier and more rapid decline in NOxemission factors com-pared with those seen from MEIC and REAS (see Fig. 6c), for which the underlying driving forces are difficult to under-stand. For example, the NOx-to-CO2ratios in EDGAR began
to decrease significantly for the power and transportation sec-tors in 1993 and 1990, respectively (see Fig. 6d), earlier than the years of implementation of major control measures re-garding NOxemissions in these sectors (1996 and 2001, re-spectively) (State Environmental Protection Administration of China (SEPA), 1996, 2001).
The CO2-to-NOx emission ratios taken from bottom-up inventories could be an important potential source of error in top-down estimates of CO2emission trends based on satellite
NO2columns. Berezin et al. (2013) used the emission ratios
from EDGAR and found an increase in CO2emissions of as
high as 240 % for the 1996–2008 period using the top-down approach, much larger than the trends observed in bottom-up inventories (e.g., 114 % in EDGAR). These substantial dif-ferences should be attributable mainly to the rapidly increas-ing CO2-to-NOxratios in EDGAR. If we adopt the emission ratios from MEIC (including uncertainties), we find an
in-crease of 147–197 %, much closer to the values from bottom-up inventories. Although uncertainties still exist, these results indicate that the energy consumption from EDGAR, which is similar to CT-CESY-1C, as well as energy consumption in 2008 from CT-CESY-2C, is likely to be underestimated.
Top-down estimates of the CO2-to-NOx emission ra-tios using satellite observations could offer an alternative approach. Reuter et al. (2014) used top-down estimation methods and found that the CO2-to-NOx emission ratio for the years 2003–2011 in east Asia had increased by 4.2±1.7 % yr−1. They found a large positive trend in CO2 emissions in east Asia (9.8±1.7 % yr−1) that exceeded the positive trend in NOx emissions (5.8±0.9 % yr−1). The MEIC inventory reports a similar CO2 trend in
China (10.4 % yr−1) during the same period. Reuter et
al. (2014) noted a considerably smaller CO2trend in EDGAR
(6.9 % yr−1)than in these top-down estimates; it appears that
considering the possible underestimations in Chinese CO2
trends in EDGAR due to uncertainties in energy statistics could help to explain this difference. The MEIC inventory reports a larger NOx trend in China (8.1 % yr−1)than that reported by Reuter et al. (2014) for east Asia, which is con-sistent with Wang et al. (2014), who also found a faster NOx growth rate in China (34 %) than in east Asia as a whole (25 %) for 2005–2010.
Zhao et al. (2011) estimated the uncertainties (i.e., 95 % confidence intervals around the central estimates) of Chinese total SO2, NOx and PM2.5emissions in 2005 to be−14 to
13,−13 to 37 % and−17 to 54 %, respectively. We found that the apparent uncertainty ratios arising from the 2012 en-ergy statistics for SO2and NOxemissions could be as large as 30.0 and 16.4 %, respectively, indicating the importance of energy statistics to Chinese emission estimates for recent years, especially for SO2and NOx. Variations in energy con-sumption could be an important source of emission uncer-tainties for SO2and NOx. For VOC and PM2.5, uncertainties
in energy consumption act as a minor source due to emission contributions from non-energy activities and large uncertain-ties from emission factors.
5 Conclusions
found to be the most sensitive to energy uncertainties because of its high contribution from industrial coal combustion. The calculated emission trends are also greatly affected by en-ergy uncertainties – from 1996 to 2012, CO2and NOx emis-sions, respectively, increased by 191 and 197 % according to the provincial energy statistics but by only 145 and 139 % as determined from the original national energy statistics. For SO2and NOx, the energy-induced emission uncertainties are comparable to total uncertainties of emissions as estimated by previous studies, indicating variations in energy consump-tion could be an important source of emission uncertainties. The reliability of the energy statistics cannot yet be regarded as conclusive, but possible explanations for the discrepancies include inconsistencies in interprovincial energy transport, double counting in provincial energy consumption and un-derestimates in energy production from small mines. While large uncertainties are present in this study, it is of critical importance to reform the statistical system, and to introduce more cross-checks and independent methods to help to ver-ify the quality of energy data and to reduce uncertainties in energy consumption as well as emissions.
6 Data availability
The MEIC emission inventory can be accessed from http: //www.meicmodel.org (Tsinghua University, 2015). The data used in this study can be provided upon request.
The Supplement related to this article is available online at doi:10.5194/acp-17-1227-2017-supplement.
Acknowledgements. This work was supported by China’s National Basic Research Program (2014CB441301), the National Science Foundation of China (41625020 and 41222036), the National Key Technology R&D Program (2014BAC16B03 and 2014BAC21B02) and the public welfare program of China’s Ministry of Environ-mental Protection (201509014). This work is a contribution to the TransChina project, funded by the Research Council of Norway (235523). We thank Glen Peters and Jan Ivar Korsbakken for their helpful suggestions. Qiang Zhang and Kebin He are supported by the Collaborative Innovation Center for Regional Environmental Quality.
Edited by: S. Buehler
Reviewed by: three anonymous referees
References
Aden, N.: Initial Assessment of NBS Energy Data Revisions, Ernest Orlando Lawrence Berkeley National Laboratory, China Energy Group, 2010.
Akimoto, H., Ohara, T., Kurokawa, J., and Horii, N.: Verification of energy consumption in China during 1996–2003 by using satellite observational data, Atmos. Environ., 40, 7663–7667, doi:10.1016/j.atmosenv.2006.07.052, 2006.
Berezin, E. V., Konovalov, I. B., Ciais, P., Richter, A., Tao, S., Janssens-Maenhout, G., Beekmann, M., and Schulze, E.-D.: Multiannual changes of CO2emissions in China: indirect
esti-mates derived from satellite measurements of tropospheric NO2
columns, Atmos. Chem. Phys., 13, 9415–9438, doi:10.5194/acp-13-9415-2013, 2013.
Guan, D. B., Liu, Z., Geng, Y., Lindner, S., and Hubacek, K.: The gigatonne gap in China’s carbon dioxide inventories, Nat. Clim. Change, 2, 672–675, doi:10.1038/nclimate1560, 2012.
International Energy Agency (IEA): World Energy Statistics and Balances (2012 edition), IEA, Paris, 2012.
Jiang, S.: Coal production statistics data analysis, Data, 4, 32–33, doi:10.3969/j.issn.1006-5954.2009.04.016, 2009 (in Chinese). Korsbakken, J. I., Peters, G. P., and Andrew, R. M.: Uncertainties
around reductions in China’s coal use and CO2emissions, Nat.
Clim. Change, 6, 687–690, doi:10.1038/nclimate2963, 2016. Kurokawa, J., Ohara, T., Morikawa, T., Hanayama, S.,
Janssens-Maenhout, G., Fukui, T., Kawashima, K., and Akimoto, H.: Emissions of air pollutants and greenhouse gases over Asian re-gions during 2000–2008: Regional Emission inventory in ASia (REAS) version 2, Atmos. Chem. Phys., 13, 11019–11058, doi:10.5194/acp-13-11019-2013, 2013.
Lamsal, L. N., Martin, R. V., Padmanabhan, A., van Donke-laar, A., Zhang, Q., Sioris, C. E., Chance, K., Kurosu, T. P., and Newchurch, M. J.: Application of satellite ob-servations for timely updates to global anthropogenic NOx emission inventories, Geophys. Res. Lett., 38, L05810, doi:10.1029/2010gl046476, 2011.
Li, M., Zhang, Q., Streets, D. G., He, K. B., Cheng, Y. F., Emmons, L. K., Huo, H., Kang, S. C., Lu, Z., Shao, M., Su, H., Yu, X., and Zhang, Y.: Mapping Asian anthropogenic emissions of non-methane volatile organic compounds to multiple chemical mech-anisms, Atmos. Chem. Phys., 14, 5617–5638, doi:10.5194/acp-14-5617-2014, 2014.
Liu, F., Zhang, Q., Tong, D., Zheng, B., Li, M., Huo, H., and He, K. B.: High-resolution inventory of technologies, activities, and emissions of coal-fired power plants in China from 1990 to 2010, Atmos. Chem. Phys., 15, 13299–13317, doi:10.5194/acp-15-13299-2015, 2015.
Liu, Z., Guan, D., Wei, W., Davis, S. J., Ciais, P., Bai, J., Peng, S., Zhang, Q., Hubacek, K., Marland, G., Andres, R. J., Crawford-Brown, D., Lin, J., Zhao, H., Hong, C., Boden, T. A., Feng, K., Peters, G. P., Xi, F., Liu, J., Li, Y., Zhao, Y., Zeng, N., and He, K.: Reduced carbon emission estimates from fossil fuel com-bustion and cement production in China, Nature, 524, 335–338, doi:10.1038/nature14677, 2015.
Marland, G.: Emissions accounting: China’s uncertain CO2
emis-sions, Nature Clim. Change, 2, 645–646, 2012.
Ministry of Environmental Protection of China: China Environment Statistical Yearbook 2000–2014, available at: http://zls.mep.gov. cn/hjtj/nb/, 2000–2014 (in Chinese).
National Bureau of Statistics: China Energy Statistical Yearbook (1991–1996, 1997–1999, 2000–2002, 2004, 2005, 2006, 2007, 2008, 2009, 2010, 2011, 2012, 2013 and 2014 editions), China Statistics Press, Beijing, 1997–2015.
Ohara, T., Akimoto, H., Kurokawa, J., Horii, N., Yamaji, K., Yan, X., and Hayasaka, T.: An Asian emission inventory of an-thropogenic emission sources for the period 1980–2020, At-mos. Chem. Phys., 7, 4419–4444, doi:10.5194/acp-7-4419-2007, 2007.
Reuter, M., Buchwitz, M., Hilboll, A., Richter, A., Schneising, O., Hilker, M., Heymann, J., Bovensmann, H., and Burrows, J. P.: Decreasing emissions of NOx relative to CO2in East Asia
inferred from satellite observations, Nat. Geosci., 7, 792–795, 2014.
Richter, A., Burrows, J. P., Nuss, H., Granier, C., and Niemeier, U.: Increase in tropospheric nitrogen dioxide over China observed from space, Nature, 437, 129–132, doi:10.1038/Nature04092, 2005.
Sinton, J. E.: Accuracy and reliability of China’s energy statistics, China Economic Review, 12, 373–383, 2001.
Sinton, J. E. and Fridley, D. G.: What goes up: recent trends in China’s energy consumption, Energ. Policy, 28, 671–687, doi:10.1016/S0301-4215(00)00053-7, 2000.
State Environmental Protection Administration of China: Emission standard of air pollutants for thermal power plants GB 13 223– 1996, State Environ, Prot. Admin., Beijing, 1996.
State Environmental Protection Administration of China: Limits and measurement methods for exhaust pollutants from compres-sion ignition (C.I.) engines of vehicles GB 17 691–2001, State Environ, Prot. Admin., Beijing, 2001.
Stavrakou, T., Müller, J.-F., Boersma, K. F., De Smedt, I., and van der A, R. J.: Assessing the distribution and growth rates of NOx emission sources by inverting a 10-year record of NO2 satellite columns, Geophys. Res. Lett., 35, L10801,
doi:10.1029/2008GL033521, 2008.
Streets, D. G., Bond, T. C., Carmichael, G. R., Fernandes, S. D., Fu, Q., He, D., Klimont, Z., Nelson, S. M., Tsai, N. Y., Wang, M. Q., Woo, J. H., and Yarber, K. F.: An inventory of gaseous and primary aerosol emissions in Asia in the year 2000, J. Geophys. Res., 108, 8809, doi:10.1029/2002jd003093, 2003.
Tsinghua University, Multi-resolution Emission Inventory for China (MEIC), available at: http://www.meicmodel.org (last ac-cess: December 2016), 2015.
van der A, R. J., Eskes, H. J., Boersma, K. F., van Noije, T. P. C., Van Roozendael, M., De Smedt, I., Peters, D. H. M. U., and Mei-jer, E. W.: Trends, seasonal variability and dominant NOxsource derived from a ten year record of NO2measured from space, J.
Geophys. Res., 113, D04302, doi:10.1029/2007JD009021, 2008. Wang, Q.: Suggestions on China’s Energy Statistical System Re-form, China Coal Consumption Cap Plan and Policy Research Project, available at: http://www.nrdc.cn/coalcap/console/Public/ Uploads/2014/12/30/CoalStats.pdf (last access: January 2015) 2014 (in Chinese).
Wang, Y. and William, C.: Understanding Energy Intensity Data in China, Carnegie Endowment for International Peace, available at: http://carnegieendowment.org/files/chinese_energy_intensity. pdf (last access: December 2016), 2011.
Zhang, Q., Streets, D. G., He, K., Wang, Y., Richter, A., Bur-rows, J. P., Uno, I., Jang, C. J., Chen, D., Yao, Z., and Lei, Y.: NOxemission trends for China, 1995-2004: The view from the ground and the view from space, J. Geophys. Res., 112, D22306, doi:10.1029/2007jd008684, 2007.
Zhang, Q., Streets, D. G., Carmichael, G. R., He, K. B., Huo, H., Kannari, A., Klimont, Z., Park, I. S., Reddy, S., Fu, J. S., Chen, D., Duan, L., Lei, Y., Wang, L. T., and Yao, Z. L.: Asian emis-sions in 2006 for the NASA INTEX-B mission, Atmos. Chem. Phys., 9, 5131–5153, doi:10.5194/acp-9-5131-2009, 2009. Zhang, Q., He, K. B., and Huo, H.: Cleaning China’s air, Nature,
484, 161–162, 2012.
Zhao, Y., Nielsen, C. P., Lei, Y., McElroy, M. B., and Hao, J.: Quan-tifying the uncertainties of a bottom-up emission inventory of anthropogenic atmospheric pollutants in China, Atmos. Chem. Phys., 11, 2295–2308, doi:10.5194/acp-11-2295-2011, 2011. Zheng, B., Huo, H., Zhang, Q., Yao, Z. L., Wang, X. T., Yang, X. F.,