Investigating new materials in the context of analog-physical models
Caroline Janette Souza Gomes
*Federal University of Ouro Preto, Geology Department, Morro do Cruzeiro, 35.400-000 Ouro Preto, Minas Gerais, Brazil
a r t i c l e
i n f o
Article history:
Received 7 February 2012 Received in revised form 19 September 2012 Accepted 20 September 2012 Available online 5 October 2012
Keywords: Analog modeling Sand mixtures Angle of internal friction Shear strength Rheology
a b s t r a c t
To broaden the availability of granular materials that are suitable for the analog modeling of upper crustal deformation, we investigated the mechanical behaviors of pure quartz sand and two sand mixtures (quartz sandepowdered barite and quartz sand mica crystals) using ring-shear tests and simple convergent sandbox experiments. The ring-shear test results indicate that the three materials have similar peak friction angles (between 39.25and 36.02), but the magnitude of the shear strain and the shear strength required to cause their failure are different. The differences between the analog models are identified by distinct fault kinematics and different grainflows, which are primarily related to differences in the plastic elasto-frictional rheology. We conclude that the use of the quartzemica mixture, which showed the strongest distributed (plastic) deformation, can improve analog models where different materials are required to simulate crystalline basement (sand) and supracrustal rocks (sand mica mixture). This is a common situation in extension and inversion tectonics, such as, for example, in inversion tectonics, when a granitic basement block acts as a buttress.
Ó2012 Elsevier Ltd. All rights reserved.
1. Introduction
The materials that are most frequently used for the physical modeling of brittle deformation are dry quartz sand and wet clay. The frictional behavior of these materials is similar, but the cohe-sive strength of sand is much less (but not negligible) than that of wet clay (Withjack et al., 2007). Several studies concerning the mechanical properties of dry sand and wet clay have been pub-lished (e.g.,Mandl, 1988; Krantz, 1991; Schellart, 2000; Eisenstadt and Sims, 2005; Withjack and Schlische, 2006; Panien et al., 2006). These studies suggest that the frictional characteristics of sand and clay in a normal gravityfield obey the Coulomb Failure Criterion (Byerlee, 1978):
s
¼ C0þm
s
N (1)where
s
ands
Nare, respectively, the shear and normal stresses,C0isthe cohesive strength, and
m
is the coefficient of internal friction.Lohrmann et al. (2003)have shown that quartz sand is charac-terized by an elastic/frictional plastic behavior in which strain hardening precedes faulting, after which strain softening occurs until stable stress values are obtained. This behavior simulates that of brittle rocks. However, the use of dry sand and wet clay as analog materials to simulate the upper crust is an oversimplification, and it
does not satisfy situations where the simulation of rock units with different rheological behaviors are called for. To address this problem, several researchers (e.g.,Schellart, 2000; Schöpfer and Steyrer, 2001; Rossi and Storti, 2003; Panien et al., 2005) have investigated new, alternative analog materials. Schöpfer and Steyrer (2001)used different sand types (sifted natural dry quartz with a rough surface and low sphericity, the same quartz without clay mineral fractions and a coarser-grained industrially produced sand with smooth grain surfaces and high-sphericity) in strike-slip fault models, and they have shown that the geometry of shear zones does not change with the varying thickness of the sand pack but that it instead changes with grain properties.Gabrielsen and Clausen (2001) used plaster of Paris to enhance the delicate details of extensional tectonics.Lohrmann et al. (2003)described changes in the geometry, kinematics and dynamics of convergent sandbox experiments using sand with different grain-size distri-butions and different shear apparatusfilling techniques.Rossi and Storti (2003)employedfine-grained, high-sphericity, low-density aluminum and siliceous hollow microspheres to simulate the mechanical behavior of ductile detachments within sand packs. They argued that an extremelyfine-grained material provides more structural detail and better scaling than coarser-grained sand. Glass microbeads were utilized by several authors to simulate multilay-ered mechanical stratigraphy, weak sedimentary rocks or ductile shear zones (e.g.,Turrini et al., 2001; Panien et al., 2006; Massoli et al., 2006; Yamada et al., 2006; Ravaglia et al., 2006; Yagupsky et al., 2008; Konstantinovskaya and Malavieille, 2011). This *Tel.:þ55 31 35591600; fax:þ55 31 35591606.
E-mail address:[email protected].
Contents lists available atSciVerse ScienceDirect
Journal of Structural Geology
j o u r n a l h o m e p a g e : w w w . e l s e v i e r . c o m / l o c a t e / j s g
material consists of highly spherical grains that have an angle of internal friction consistently lower than that of quartz sand.
The aim of our work was to contribute to the study of new elastic and frictional plastic analog materials. Shortening experiments were conducted with three types of sands, the mechanical prop-erties of which are characterized in detail. The study is not intended to represent any particular natural geological setting, but to provide an approach for the identification of materials suitable for differ-entiation among crystalline basement and supracrustal rocks in inversion tectonics or thick-skinned fold-and-thrust belts. Many sandbox experiments on basin inversion have been conducted to analyze hanging wall deformations using rigid footwalls (made of acrylic or wood) (e.g.,McClay, 1989; Buchanan and McClay, 1992; Gomes et al., 2010). However, these rigid footwalls cannot deform as a basement rock might deform in nature. In addition, the high strength contrast between the rigid footwalls and the analog material influences the model results. We analyzed pure quartz sand and mixtures of sands with two products of differing composition and shape: sand with powdered barite (2:1 by weight) and sand with mica crystals (14:1 by weight).
First, we used a ring-shear tester to examine the optimal ratio between sand and barite and sand and mica crystals. In addition, we analyzed the relationship between the frictional properties of the quartz sand and two preparation techniques. Second, we measured the angle of the internal friction and the cohesion of the pure quartz sand (for ease of description, in the following, we refer to the pure quartz sand only as sand) and the sand mixtures. Third, we applied three analog models to each of the three model mate-rials and compared the results. Finally, we used the model results to improve our knowledge of the mechanical behavior of granular materials.
It was not our intention to monitor the strain history of the sand mixture models, but rather to compare the mechanical response of each of them with that of the sand model. Accordingly toRichard and Krantz (1991)andWithjack et al. (2007), the primary defor-mation mechanism in sand is localized defordefor-mation (e.g., failure), although distributed deformation is also important (e.g., Rutter, 1986). Distributed deformation causes strain without loss of continuity, commonly referred to as ductile behavior. In the following text, we refer to the distributed deformation process in the vertical and in the horizontal directions (as described by the above authors) as vertical grainflow or vertical ejection of the sand and as horizontal grainflow, respectively. The latter is sometimes referred as layer-parallel shortening, as used byKoyi (1995).
2. The mechanical properties of sand and sand mixtures
2.1. Materials and methods
The Schulze ring-shear tester (RST-XS) was developed in 1994 based on equipment that has been used in soil mechanics (rota-tional shear testers) since the 1930s. Among the simple shear apparatuses that are currently available, the RST-XS is notable because it works with low normal loads that are within the range of stresses applied to the model materials in sandboxes.
In the present study, the methodology for use of the RST-XS followed that described by Ellis et al. (2004) and Panien et al. (2006). The measurements of the internal friction (and basal fric-tion) angles and cohesion strength were performed with normal stresses, which ranged from 800 to 2400 Pa, in intervals of 400 Pa. The computer-controlled RST-XS recorded the shear stress in three different situations: at fault initiation (the peak strength), at fault reactivation (the second peak strength or the reactivation peak strength) and at fault sliding (the dynamicestable strength); it was
also used to generate stressestrain curves in diagrams of shear stress plotted as a function of time.
The values obtained by the RST-XS were used to produce a second diagram to compare the shear stress to the normal stress (CoulombeMohr diagram). The coefficient of the internal friction (and basal friction) was derived from the linear regression analysis of the diagram, whereas the cohesion was inferred by extrapolation along the straight Coulomb fracture envelope to its intersection with the shear stress axis.
In preliminary tests, we analyzed several ratios of sand mixtures tofind a material that was characterized by a peak angle of internal friction similar to that of the sand. This was important because we were searching for materials that were only slightly different from sand (such as slightly less competent supracrustal rocks compared to infracrustal rocks). The tests revealed that the sand mixture ratios had no major influence on the peak angles of internal friction (for example, the sand mica mixtures of ratios 14:1 and 24:1, by weight, revealed a difference of only 2.03in their peak angles of
internal friction). Thus, the choice of the ratio (by weight) of our sand mixtures, sand with barite, 2:1, and sand with mica crystals, 14:1, has only impacted the shear strength and cohesion values.
Measurements of the frictional properties of sand were obtained under different preparation techniques following Krantz (1991), Schellart (2000)andLohrmann et al. (2003). The annular cell of the ring-shear tester was filled by both sifting and pouring (and afterward, leveled by scraping), and different fill heights were examined. We analyzed the frictional properties obtained by pouring the analog material into the test cell, as pouring, in contrast to sifting, can prevent the loss of powdered barite during prepa-ration. Moreover, to avoid any loss of the low-density mica crystals, especially during pouring, we poured this mixture directly from the edge of the annular cell (thus, the height was equal to zero). Finally, in one sample, a210
m
m grain size was analyzed.To minimize measurement errors, each test was repeated three times, and a total of 15 tests were performed for each sample. The statistical calculations providedR2correlation values (the square of
the correlation coefficient) that were greater than 0.99 for all tests.
2.2. Results
2.2.1. Frictional properties of sand as a function offilling techniques
The experimental results presented inTable 1(a) reveal that the
filling technique (sifting or pouring) is the only parameter that influences the angle of the internal friction of our sand. However, these variations occur only in the peak strength values, i.e., at failure (a localized shear zone). The peak friction (the internal friction angle (
F
) derived from the peak strength) of sand sifted from a height of 20 cm is 41.47, and pouring that sand from thesame height resulted in an angle of 37.97. The height and
gran-ulometry variations produced minimal differences of approxi-mately 1in the angle of peak internal friction.
The stressestrain curves of the shear stress plotted as a function of time for the sand sifted and poured from the same height are presented in Fig. 1. In the sifted sand, the peak strength is substantially higher than that of the poured sand, at values of 2254 Pa and 1996 Pa, respectively (for the highest normal load of 2400 Pa). The dynamic stable strength and the reactivation peak strength, however, vary only slightly. Consequently, the poured sand has a lower rate of strain softening (measured as the differ-ence between the coefficient of peak friction and the dynamice stable friction divided by the coefficient of the dynamicestable friction) (Table 1) than the sifted sand.
48.7 Pa, whereas these values are more than double that for the poured sand.
2.2.2. Frictional properties of sand mixtures
Table 1(b) provides the results of the frictional properties of the sand mixtures. The values of the peak (
F
) internal friction are similar among the mixtures. Note that the peak and stable internal friction values are nearly identical for the sand barite and sand mica mixtures. Consequently, both mixtures present a low strainsoftening rate (7%), which is much lower than that of the sand (32% and 18% for sand poured from 10 cm and from the edge of the cell, respectively) (Table 1(a) and (b)). Moreover, the reactivation peak friction exhibits slightly higher values than the peak friction. According toKrantz (1991), the increased internal reactivation peak strength may be related to strain hardening, which is produced by the increased compaction in sand mixtures. Thus, in our sand mixtures, the powdery barite and thefine mica crystals may have caused strain hardening during reactivation.
200 1600
1600 Pa 2000
2000 Pa 2400
2400 Pa
1200
1200 Pa 800
800 Pa 400
0
0 600400
Time (s)
Shear stress (Pa)
Reactivation strength Peak strength
Dynamic stable strength
a
200 1600
1600 Pa 2000
2000 Pa 2400
2400 Pa
1200
1200 Pa 800
800 Pa 400
0
0 600400
Time (s)
Shear stress (Pa)
b
Fig. 1.Shear stress plotted as a function of time for the tested sands in the ring-shear tester; (a) sifted and (b) poured sand, both from a height of 20 cm. Table 1
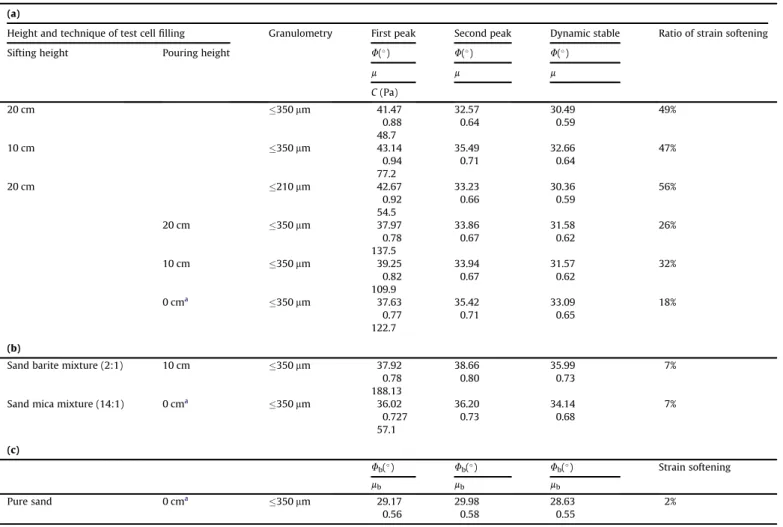
Angles (F) and coefficients (m) of internal friction, linearly extrapolated peak cohesion (C), and ratio of strain softening (expressed as a percent) obtained with a ring-shear tester. (a) Sand, using different heights, test cellfilling techniques (sifting and pouring) and granulometries; (b) sand mixtures, using only the pouring technique; (c) angles (Fb) and coefficients (mb) of the peak basal friction of the sand.
(a)
Height and technique of test cellfilling Granulometry First peak Second peak Dynamic stable Ratio of strain softening
Sifting height Pouring height F() F() F()
m m m
C(Pa)
20 cm 350mm 41.47 32.57 30.49 49%
0.88 0.64 0.59
48.7
10 cm 350mm 43.14 35.49 32.66 47%
0.94 0.71 0.64
77.2
20 cm 210mm 42.67 33.23 30.36 56%
0.92 0.66 0.59
54.5
20 cm 350mm 37.97 33.86 31.58 26%
0.78 0.67 0.62
137.5
10 cm 350mm 39.25 33.94 31.57 32%
0.82 0.67 0.62
109.9
0 cma 350
mm 37.63 35.42 33.09 18%
0.77 0.71 0.65
122.7 (b)
Sand barite mixture (2:1) 10 cm 350mm 37.92 38.66 35.99 7%
0.78 0.80 0.73
188.13 Sand mica mixture (14:1) 0 cma 350
mm 36.02 36.20 34.14 7%
0.727 0.73 0.68
57.1 (c)
Fb() Fb() Fb() Strain softening
mb mb mb
Pure sand 0 cma 350
mm 29.17 29.98 28.63 2%
0.56 0.58 0.55
aPoured from the edge of the annular cell.
2.2.3. Comparison of sand and sand mixtures
The comparison of the peak friction values of sand and sand mixtures does not reveal any substantial change. The sand and the sand barite mixture poured from a height of 10 cm present a difference of 1.33, whereas the sand and the sand mica mixture
poured from the edge of the cell exhibit a variation of 1.61.
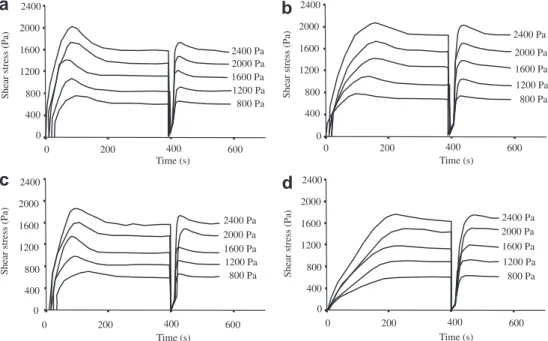
However, significant differences are seen in the stressetime relationships and in the peak strength. FromFig. 2, it is clear that the time interval (i.e., the amount of shear strain) between the onset of shear strain and failure is lowest for sand (<100 s),
inter-mediate for the sand barite mixture (ranging from 100 s to 200 s) and highest for the sand mica mixture (close to 200 s). In the literature, this interval is referred to as a diffuse deformation (Lohrmann et al., 2003; Panien et al., 2006), and it is associated with sample compaction/decompaction during pre-failure deformation. The peak strength (i.e., failure) corresponds to the maximum decompaction rate after a period of plastic strain hardening.
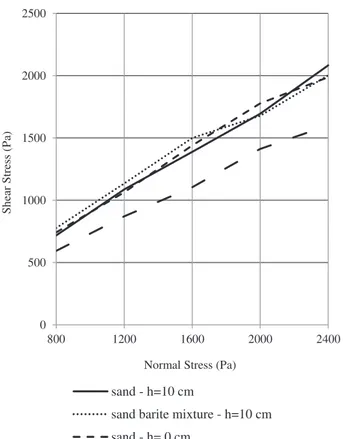
The diagram of the peak shear stress as a function of the normal stress, which is shown inFig. 3, reveals that the sand mica mixture failure under a lower amount of peak shear stress than the other tested sands, although the variation of the angle of the internal friction is low.
3. Physical-analog experiments
3.1. Scaling
According toHubbert (1937) and Ramberg (1981), to ensure dynamic similarity in the experimental models, two conditions should be satisfied: the angle of internal friction of the analog materials should be similar to that of their natural counterparts, and the models should obey the stress ratio
s
*¼r
*g*l*, wheres
*,r
*,g* andl* are the ratios of cohesion (which have the dimen-sion of stress), density, gravitational acceleration on Earth and length, respectively, between the model and nature.Based on our study, the angle of internal friction (at peak strength) varies between 36.02and 39.25for the poured sand
and sand mixtures, which justifies their use to simulate rocks of the
upper crust with angles of internal friction that vary from 31to 41
(Handin, 1966; Byerlee, 1978; Jaeger and Cook, 1979).
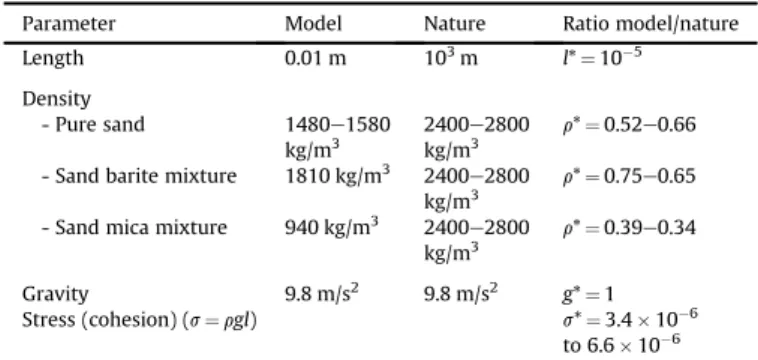
Table 3depicts values of
r
* that range from 0.34 to 0.66 andg*¼1 for a length ratiol*¼10 5(thus, 1 cm in our experiments corresponds to 1 km in nature). To ensure dynamic similarity,
s
*andl* must have similar values. In this study, similarity indicates that the stress ratio varies from 3.410 6to 6.610 6. Because sedimentary rocks exhibit a cohesion that varies between 10 MPa and 20 MPa (Handin, 1966), the cohesion of the sand used in our laboratory must be between 34 Pa and 66 Pa. These values are significantly less than those measured by the RST-XS (between 57 Pa and 188 Pa). The difference may be related to the uncer-tainties that arise from the linear extrapolation of the Coulomb envelope under low normal stresses (Schellart, 2000; Panien et al., 2006).
3.2. Materials and methods
The analog models of the sand and the two sand mixtures (Table 2) were set up on the same substrate (a sheet of cardboard) in glass-sided boxes with equal internal dimensions and a basal dip of 0. The models had a length of 35 cm, a width of 20 cm and a total
thickness of 3 cm and were deformed by the displacement of the mobile back wall (Fig. 4). To enable observations of the internal wedge structure, thin horizons of differently colored sands were introduced into the models. In all of the models, deposition was initiated with the same sand layer; hence, the angle of basal friction (
F
b¼29.17) was the same for all experiments (Table 1(c)).The deposition of the analog material was implemented manually and poured from a height of 10 cm (corresponding to the pouring height of the ring-shear tests for sand and the sand barite mixture). To prevent variations in thickness, the analog material was slightly compacted after the deposition of each 0.5-cm-thick layer with gentle pats made with a spoon. In the ring-shear tests, the normal stress variation, from 400 to 2400 Pa, modified the peak shear strength by a maximum of 200 Pa. Thus, our gentle compaction procedure in the physical models cannot substantially modify the frictional properties.Gomes and Caldeira (2011)have
Shear stress (Pa)
1600 Pa 2000 Pa 2400 Pa
1200 Pa 800 Pa
200 1600
2000
1200
800
400
0 600400
2400
0
Shear stress (Pa)
a
1600 Pa 2000 Pa 2400 Pa
1200 Pa 800 Pa
200 1600
2000
1200
800
400
0 600400
Time (s) 2400
0
b
200 1600
1600 Pa 2000
2000 Pa 2400
2400 Pa
1200
1200 Pa 800
800 Pa 400
0 600400
0
Time (s)
d
Shear stress (Pa)
Time (s)
200 1600
1600 Pa 2000
2000 Pa 2400
2400 Pa
1200
1200 Pa 800
800 Pa
400
0 600400
Shear stress (Pa)
0
Time (s)
c
Fig. 2.Shear stress plotted as a function of time, with the stressestrain curves of the analog materials; (a) sand and (b) sand barite mixture poured from a height of 10 cm; (c) sand and (d) sand mica mixture poured from the edge of the annular cell.
shown that this procedure causes a negligible change in the angle of the internal friction of the sand.
All experiments were subjected to a shortening of 12 cm (34.3%) at a constant velocity of 2.5 cm/h (0.6910 3cm/s). At regular shortening intervals (1 cm), measurements of the wedge slope angle and wedge elevation were made at the transparent sidewalls, and the cross-sectional evolution was photographed. In addition, the amount of displacement at the initiation of the forward thrust was measured. Because of a lack of accuracy along the sidewalls, the fault dip angles were not measured. At the end of the experiments, the models were wetted and sectioned. To ensure reproducibility, each experiment was performed twice.
Lateral friction between the sand and the glass sides cannot be avoided; however, the impact of this phenomenon should be nearly the same in all three of the performed experiments. The friction
caused a slightly smaller deformation at the sidewalls than at the wedge center. To show this fact, we present sections cut through the middle of the model domain (Fig. 5).
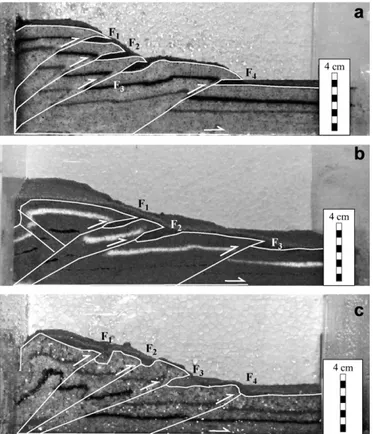
3.3. Description of the experiments
The cross-sectional structural evolution of our three models after 1, 2, 4, 8 and 12 cm of mobile wall displacement is shown along the sidewalls inFig. 4. The shortening in our models is similar to that described in several previous studies (e.g.,Mulugueta and Koyi, 1987; Huiqi et al., 1992). In front of the rigid mobile back wall, a wedge of piggyback imbricate stacks was formed by serial repetition of sand pack sliding along the basal detachment, layer-parallel shortening and subsequent faulting. During the progres-sive deformation, no reactivation of older faults was recognized, and the formation of back thrusts was not a common feature. Back thrusts were only clear in the model center of the quartzebarite mixture model (Fig. 5(b)). In the following section, the kinematics of the faults and deformation styles of the different analog mate-rials are described.
3.3.1. Kinematics of the faults
The most striking observation from the sand experiment (for ease of description, this experiment is also called experiment 1 or model 1) is the strong steepening (up to 90) of the lower F
1-fault segment, which occurs even before a new foreland-vergent thrust has nucleated in the footwall (Fig. 4(a)). Throughout the progres-sive deformation, the younger faults, F2and F3(F2Adoes not extend along the strike) exhibited a similar pattern of steepening that led to a strong convex-upward listric thrust geometry. The forward migration of the zone of shortening generated in the hinterland vertical ejection of the sand, which was progressively confined between the lower fault segments and the mobile back wall. The older thrusts became progressively inactive as the slip stopped growing, and a piggyback anticlinal stack was generated.
We suggest that the steepening of the lower fault segments is a consequence of the mechanical behavior of our sand, which enables vertical grain flow in the hinterland, while slight layer-parallel shortening occurs in the foreland. According to Koyi (1995), who used bed length balancing for two single layers at different stratigraphic levels in sand models, layer-parallel short-ening is greater in the deep layers than in the shallow layers. This layer-parallel shortening causes a buttress effect in the deepest layer and, thus, steepening of only the lower segments of thrust faults.
A similar pattern of thrust steepening of the lower fault segments is only poorly visible in the quartzebarite mixture experiment (experiment 2), and it does not occur in the quartze mica experiment (experiment 3). During the progressive deforma-tion, experiment 2 also produced a differential counterclockwise rotation of the lower segments of the thrusts. However, the fault
0 500 1000 1500 2000 2500
800 1200 1600 2000 2400
Sh
ear Stress
(P
a)
Normal Stress (Pa)
sand - h=10 cm
sand barite mixture - h=10 cm
sand - h= 0 cm
sand mica mixture - h= 0 cm
Fig. 3. Comparison between the failure envelopes for all sands analyzed. Note that the slope angles (the angles of internal friction) do not change much; however, the peak shear stress of the sand mica mixture is significantly lower than those of the other sands.his thefilling height of the annular cell.
Table 2
Physical characteristics of the analyzed analog materials.
Analog material Composition Bulk density
(kg/m3) Sand granulometry(
mm)
Sand mixtures granulometry (mm)
Shape of sand or of the mixed products
Pure sand SiO2¼99% 1580a 350 e Angular
Tourmaline, micas, opaque 1500b
1480c
Sand barite mixture Barite: BaSO4¼79.4%; SiO2¼11.4%; Fe2O3¼7.52%; other oxides
1810 350 210mm Angular/subangular/
sub-rounded
Sand mica mixture Sand and Muscovite 940 350 1mm Tabular
aSifted sand from a height of 20 cm. bPoured sand from a height of 20 cm. c Poured sand from a height of 10 cm.
rotations were more moderate, and the fault traces convexed up only slightly. Consequently, the vertical grainflow in the hinterland was less pronounced. In experiment 3, the approximately straight fault traces suggest a more homogenous behavior of the quartze mica mixture in that the layer-parallel shortening was not as great in the deep layers as it was in the sand. Consequently, counter-clockwise rotations affected the entire F1, F2, F3and F4thrust traces. In the quartzebarite mixture experiment, only three thrusts were formed (Fig. 5(b)), but on the sidewall, additional faults can be seen (e.g., fault F1A, inFig. 4(b)(iv) and (v)). The surface structures are illustrated inFig. 6(b). The reason that some faults appeared only at the sidewall became clear: the deformation is partitioned into several smaller segments. This process may be related to the rheological characteristics of the material.
In experiment 3, the hanging wall of the F1thrust shows a strong folding of the marker horizons, which cannot be simply related to the formation of a fault-propagation fold as in the other experi-ments (Figs. 4 and 5). This result suggests that the vertical grain
flow of the analog material in the back of the wedge occurred simultaneously with a horizontal ductile strain.
The surface view of experiment 3 also reveals a partitioning of the faults in several smaller segments (Fig. 6(c)). In this model,
partitioning occurs in a more homogenous and more accentuated way than that observed in experiment 2.
The progressive deformation of the three experiments reveals that the number of faults that nucleate at a particular interval of shortening is variable. From Fig. 7, it is clear that the amount of displacement is generally smaller in the sand model than in the two other experiments. The larger amount of displacement for fault initiation in experiment 2 compared to experiment 3 (with the exception of the first thrust) may be a consequence of the large number of aborted faults along the sidewall, which are not counted.
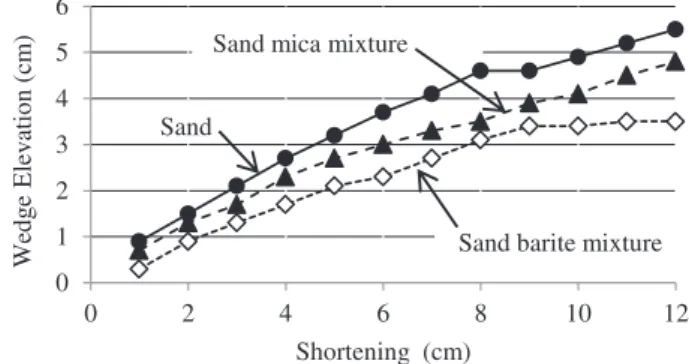
3.3.2. Wedge elevation and wedge surface slope
The wedge elevations were determined at distances of 2 cm from the inward-moving mobile wall, and the wedge surface slopes were determined by measuring the slope of the line linking the tips of the thrust sheets (Fig. 8). From Fig. 8, which compares the convergent wedges of the three experiments, it is clear that the
elevation of the wedges varied significantly after a 12 cm
displacement. Thefinal surface slopes (
a
) are equal for models 1and 3, with
a
¼22, but vary significantly compared to model 2,with
a
¼17.A progressive increase in the wedge elevation occurred during deformation in the three experiments (Fig. 9). The highest values correspond always to model 1, whereas the smallest value corre-sponds to model 2. At the end of the deformation, experiments 1, 2 and 3 presented elevation values of 5.6 cm, 3.5 cm and 4.9 cm, respectively. The thickening observed in experiments 1 and 2 is a consequence of the distributed vertical grainflow of the frictional sand in the back of the wedges. In experiment 3, an additional horizontal strain accommodation of the sand mica mixture occurred as indicated by the folded marker horizon.
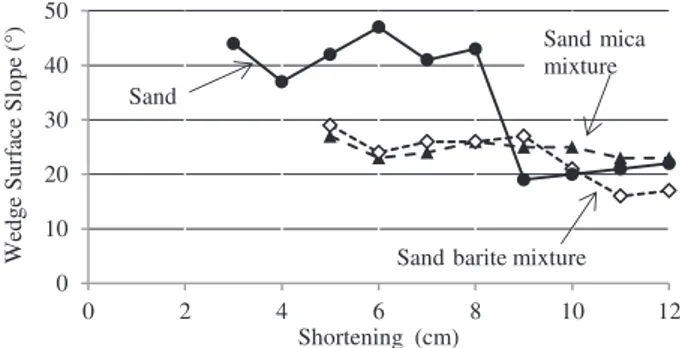
The variation of the surface slopes of the wedges is given in
Fig. 10. The high surface slope angles at 3e8 cm of shortening in model 1 (ranging from 47to 37) are the result of rapid increases
in wedge elevation caused by the strong vertical ejection of sand, as described above. An abrupt decrease (of 24) occurred because
Table 3
Model and nature ratios applicable to the present study.
Parameter Model Nature Ratio model/nature
Length 0.01 m 103m l*¼10 5
Density
- Pure sand 1480e1580 kg/m3
2400e2800 kg/m3
r*¼0.52e0.66 - Sand barite mixture 1810 kg/m3 2400
e2800 kg/m3 r*
¼0.75e0.65
- Sand mica mixture 940 kg/m3 2400 e2800 kg/m3 r*
¼0.39e0.34
Gravity 9.8 m/s2 9.8 m/s2
g*¼1 Stress (cohesion) (s¼rgl) s*¼3.410 6
to 6.610 6
b
c
a
Fig. 4.Five representative photographs of the progressive deformation of the three experiments, taken through the transparent sidewalls; (a) sand, (b) sand barite mixture and (c) sand mica mixture (length values indicate the magnitude of shortening). F1, F2, F3and F4¼thrust faults; F1A, F2Aand F3A¼thrust faults with restricted continuity in 3D, which are represented in the profile by dashed lines.
of the formation of the youngest fault, F4, which had a higher thrust space than the older ones. From that point onward, the slope angle of the wedge only grew slightly because of the small displacement along F4. In experiment 2, the sand barite mixture model also exhibited an oscillation in its surface slope angles, but the values were much smaller (varying from 29 to 17) than in model 1.
Only experiment 3 showed relatively regular surface slope angles (that ranged from 26 to 23), despite the high thrust space
between faults F3and F3A(Figs. 4 and 7).
4. Summary and discussion
4.1. Frictional properties
Our ring-shear tests were consistent with those performed by
Lohrmann et al. (2003)andPanien et al. (2006), in that the sifted
and poured sands exhibited different rheological behaviors. According to these authors, sifting produces more densely packed sand because it produces better grain fit than pouring. Conse-quently, sifted sand is associated with a higher bulk density (see also ourTable 2), higher compaction and greater strain hardening preceding failure during shear testing than that of poured sand.
Our three sands have the following common features: (1) an elastic/frictional plastic mechanical behavior and (2) a peak friction (with a maximum variation of 2.06between sands handled with
the samefilling technique, or 3.23without considering the
filling
technique).
The main differences between the analyzed sands occur in the diffuse deformation interval and in the shear strength. The latter is similar for sands and the sand barite mixture, but it is lower for the sand mica mixture (Fig. 3).
According toPanien et al. (2006), the diffuse deformation in the ring-shear tests is influenced by both the handling techniques and the type of granular material, specifically the grain shape and grain-size distribution. Angular and subangular shapes and heteroge-neous grain-size distributions demand a longer diffuse deformation because of the higher dispersion of stresses. This effect may explain the larger amount of diffuse deformation that was observed for the sand mixtures compared to the sand and, thus, their higher amount of shear strain to reach failure. Similar conclusions can be deduced from the results of our analog models, in which fault generation took longer for the two mixtures than for the sand.
4.2. Analog models
Our convergent sandbox experiments with sand and sand mixtures show a similar first-order evolution, but they differ significantly in detail. Evenflow maps have not been presented of our three models, the above model descriptions combined with the ring-shear test results allow for correlations between the different features to the types of deformation. Thus, we suggest that among our three experiments, the sand mica mixture of model 3, which
had the more homogenous grain flows, shows the strongest
distributed deformation, that is, the more plastic behavior, for a number of reasons. First, in the ring-shear tests, the sand mica mixture produced the highest amount of diffuse deformation (the most gentle strainestress curves) and the lowest amount of shear strength, which delayed thrust formation in the analog experi-ments. Second, in the thrust’s footwall layer, parallel shortening affected the deep and shallow layers in the same way, and in the thrust’s hanging wall, the strain was accommodated by both vertical and horizontal grainflow (see the F1hanging wall of the sand mica mixture inFig. 5compared to the F1hanging wall of the
Fig. 5.Cross-section photographs through the center of the three models after a 12 cm displacement of (a) sand, (b) sand barite mixture and (c) sand mica mixture.
sand and sand barite mixture). In the sand model and in model 2, the main grain flow occurred in the vertical sense. However, a horizontal grainflow, related to the layer-parallel shortening, was observed in the deepest footwall layers. These observations are in good agreement with those obtained byAdam et al. (2005)and
Nilfouroushan et al. (2012)who presented new insights about the deformation processes in sand using particle imaging velocimetry (PIV), a high-resolution strain monitoring method. According to
Adam et al. (2005), in sand, the deformation takes place by granular
flow constituted by complex non-linear deformation processes. In compression, the authors illustrated the horizontal and vertical components of the displacementfield and showed that uplift was dominant in the hanging wall of the frontal shear zone and that horizontal displacement was dominant in the frontal thrust segments.
Third, the strong fault partitioning observed in the surface view of model 3 suggests a plastic elasto-frictional rheology for the sand mica mixture. The fault partitioning was first related to plastic elasto-frictional rheology in wet clay models by Withjack et al. (2007). It was not visible in the sand model but was detected in the sand barite mixture model, although it was not very intense. Based on this feature, one can conclude that the mechanical behavior of the sand barite mixture resulted in greater affinity to sand than to the sand mica mixture. The similarity in the fault kinematics and amount of peak shear stress support this statement. The wedge elevation and slope angle of the sand barite mixture do not lie between the values for the sand and sand mica mixture, possibly because the wedge stable state has not been reached.
The homogenous variation in the evolution of the critical wedge slope (of 3) of the sand mica mixture during deformation (Fig. 10)
may be the fourth argument for its strong distributed deformation. Our sand model revealed a strong oscillation of the critical
wedge slope, similar to the observations by Mulugeta and
Koyi (1992) (with oscillations between 10 and 20). However,
comparisons of critical wedge slope evolutions are somewhat problematic. Schreurs et al. (2006) compared the evolution of
convergent wedges developed in sandboxes by 10 different labo-ratories using the same boundary conditions. As each laboratory used its own analog material, that is, sand and glass microspheres, they obtained highly variable surface slopes.
Moreover, the benchmark study by Schreurs et al. (2006)
revealed variations in thrust wedge evolution. The differences were associated with factors such as the characteristics of the granular materials, the handling techniques and the shear along the sidewalls of the sandboxes. In our analog models, we only altered the characteristics of the sand by adding different granular mate-rials (with different grain shapes and sizes), which made it possible to demonstrate the influence of these variations on the kinematics and the geometry of the convergent systems.
The comparison of our three experiments suggests that more plastic granular materials produce a more homogenous thrust fault behavior (with straight traces) than low-plasticity materials, leading to a homogenous evolution of the wedge slope. Compari-sons among the sand model and the sand mica mixture model show that, despite similarities in their peak friction (here, we do not consider cohesion because of the difficulty in determining satisfactory values, as described above), models with the same basal friction may produce distinct peak strengths. Consequently, they may be characterized by different rheological behaviors. Finally, our models suggest that when the angle of basal friction is the same in all experiments, the wedge height depends on the ability of the vertical grainflow of each analog material.
Now, the question is, are the materials suitable for simulating different competent rock units in the upper crust? Their suitability certainly depends on the deformation features being investigated. Because of insufficient knowledge of the associated rheology, shear strength and an infinite variety of other deformation processes of rocks found in nature, it is impossible to search for ideal analog materials. However, physical models allow us to discuss general similarities. For comparable conditions of pressure and tempera-ture, it is reasonable to assume that low-porosity basement rocks (e.g., migmatites and gneisses) may have higher peak strengths than
0 1 2 3 4
0 1 2 3 4 5 6 7 8 9 10 11 12
T
h
ru
st Nu
m
b
er
Shortening (cm) Sand
Sand barite mixture
Sand mica mixture
Fig. 7.Thrusts plotted against shortening measured at the moment a new fault was initiated.
Fig. 8.Comparison of the convergent wedges after a 12 cm shortening of the (a) sand, (b) sand barite mixture and (c) sand mica mixture. Dashed straight lines show how the surface slope was measured.
0 1 2 3 4 5 6
0 2 4 6 8 10 12
W
edg
e Elev
ation
(c
m
)
Shortening (cm) Sand
Sand barite mixture Sand mica mixture
supracrustal rocks or basin infills (e.g., schists, quartzites, phyllites or clastic and chemical sedimentary rocks). Among these rock types, the latter may constitute the less competent unit because of its composition and anisotropies. Thus, we suggest that the lower shear strength of the sand mica mixture renders this material to be more suitable for simulating supracrustal rocks in thick-skinned tectonics. With regards to the sand and the sand barite mixture, the former presented less ductile features during our shortening experiments, indicating that sand is the most appropriate material to use for replicating competent rock units. In extensional systems, the sand mica mixture may be used to simulate syn-rift deposits, and sand may be used to simulate the pre-rift blocks.
Acknowledgments
The author wishes to express her thanks to Petrobrás for funding the project, which made the acquisition of the ring-shear tester (RST-XS) possible, and to the Federal University of Ouro Preto, which provided financial support for language editing. Special thanks to Hemin Koyi and Fernando Ornelas Marques for the detailed, constructive comments that improved the manuscript.
References
Adam, J., Urai, J.L., Wienecke, B., Oncken, O., Pfeiffer, K., Kukowski, N., Lohrmann, J., Hoth, S., van der Zee, W., Schmatz, J., 2005. Shear localization and strain distribution during tectonic faulting e new insights from granular-flow experiments and high-resolution optical image correlation techniques. Jour-nal of Structural Geology 27, 283e301.
Buchanan, P.G., McClay, K.R., 1992. Experiments on basin inversion above reac-tivated domino faults. Marine and Petroleum Geology 9, 486e500.
Byerlee, J., 1978. Friction of rocks. Pure and Applied Geophysics 116, 615e626. Eisenstadt, G., Sims, D., 2005. Evaluating sand and clay models: do rheological
differences matter? Journal of Structural Geology 27, 1399e1412.
Ellis, S., Schreurs, G., Panien, M., 2004. Comparisons between analogue and numerical models of thrust wedge development. Journal of Structural Geology 26, 1659e1675.
Gabrielsen, R.H., Clausen, J.A., 2001. Horses and duplexes in extensional regimes: a scale-modeling contribution. In: Koyi, H.A., Mancktelow, N.S. (Eds.), Tectonic Modeling: A Volume in Honor of Hans Ramberg. Geological Society of America, Memoir, vol. 193, pp. 221e234.
Gomes, C.J.S., Caldeira, J.N.M., 2011. The frictional properties of quartz sands (natural and colored): measurements from analogue experiments and from a ring shear tester. Revista da Escola de Minas 64 (3), 293e302.
Gomes, C.J.S., Danderfer, A., Hercos, C.M., 2010. Basement-involved deformation in sandbox experiments: a case study from the Água Fria Range region (MG), São Francisco basin, Minas Gerais, Brazil. Revista Brasileira de Geociências 40 (4), 561e572.
Handin, J., 1966. Strength and ductility. In: Clark Jr., S.P. (Ed.), Handbook of Physical Constants. Geological Society of America, Memoir, vol. 97, pp. 223e289. Hubbert, M.K., 1937. Theory of scale models as applied to the study of geologic
structures. Geological Society of America Bulletin 48, 1459e1520.
Huiqi, L., McClay, K.R., Powell, D., 1992. Physical models of thrust wedges. In: McClay, K.R. (Ed.), Thrust Tectonics. Chapman and Hall, London, pp. 71e81. Jaeger, J.C., Cook, N.G.W., 1979. Fundamentals of Rock Mechanics. Chapman and
Hall, Wiley, New York.
Konstantinovskaya, E., Malavieille, J., 2011. Thrust wedges with décollement levels and syntectonic erosion: a view from analog models. Tectonophysics 502, 336e350.
Koyi, H., 1995. Mode of internal deformation in sand wedges. Journal of Structural Geology 17, 293e300.
Krantz, R.W., 1991. Measurements of friction coefficients and cohesion for faulting and fault reactivation in laboratory models using sand and sand mixtures. Tectonophysics 188, 203e207.
Lohrmann, J., Kukowski, N., Adam, J., Oncken, O., 2003. The impact of analogue material properties on the geometry, kinematics and dynamics of convergent sand wedges. Journal of Structural Geology 25, 1691e1711.
Mulugeta, G., Koyi, H., 1992. Episodic accretion and partitioning in a model sand wedge. Tectonophysics 202, 319e333.
Mandl, G., 1988. Mechanics of Tectonic Faulting. Models and Basic Concepts. Elsevier, Amsterdam.
Massoli, D., Koyi, H.A., Barchi, M.R., 2006. Structural evolution of a fold and thrust belt generated by multiple décollements: analogue models and natural exam-ples from the Northern Apennines (Italy). Journal of Structural Geology 28, 185e199.
McClay, K.R., 1989. Physical models of structural styles during extension. In: Tankard, A.J., Balkwill, H.R. (Eds.), Tectonics and Stratigraphy of the North Atlantic Margins. American Association of Petroleum Geologists, Memoir, vol. 46, pp. 95e110.
Mulugueta, G., Koyi, H., 1987. Three-dimensional geometry and kinematics of experimental piggyback thrusting. Geology 15, 1052e1056.
Nilfouroushan, F., Pysklywec, R., Cruden, A., 2012. Sensitivity analysis of numer-ical scaled models of fold-and-thrust belts to granular material cohesion variation and comparison with analog experiments. Tectonophysics 526e529, 196e206.
Panien, M., Schreurs, G., Pfiffner, A., 2005. Sandbox experiments on basin inversion: testing the influence of basin orientation and basinfill. Journal of Structural Geology 27, 433e445.
Panien, M., Schreurs, G., Pfiffner, A., 2006. Mechanical behavior of granular mate-rials used in analogue modeling: insights from grain characterization, ring-shear tests and analogue experiments. Journal of Structural Geology 28, 1710e1724.
Ramberg, H., 1981. Gravity, Deformation and the Earth’s Crust. Academic Press, New York.
Ravaglia, A., Seno, S., Toscani, G., Fantoni, R., 2006. Mesozoic extension controlling the Southern Alps thrust front geometry under the Po Plain, Italy: insights from sandbox models. Journal of Structural Geology 28, 2084e2096.
Richard, P., Krantz, R.W., 1991. Experiments on fault reactivation in strike-slip mode. Tectonophysics 188, 117e131.
Rossi, D., Storti, F., 2003. New artificial granular materials for analogue laboratory experiments: aluminum and siliceous microspheres. Journal of Structural Geology 25, 1893e1899.
Rutter, E.H., 1986. On the nomenclature of mode of failure transition in rocks. Tectonophysics 122, 381e387.
Schellart, W.P., 2000. Shear test results for cohesion and friction coefficients for different granular materials: scaling implications for their usage in analogue modeling. Tectonophysics 324, 1e16.
Schöpfer, M.P.J., Steyrer, H.P., 2001. Experimental modeling of strike-slip faults and the self-similar behavior. In: Koyi, H.A., Mancktelow, N.S. (Eds.), Tectonic Modeling: A Volume in Honor of Hans Ramberg. Geological Society of America, Memoir, vol. 193, pp. 21e28.
Schreurs, G., Buiter, S.J.H., Boutelier, D., Cavozzi, C., Corti, G., Costa, E., Cruden, A.R., Delventisette, C., Elder Brady, J.A., Daniel, J.M., Hoffmann-Rothe, A., Hoth, S., Koyi, H.A., Kukowski, N., Lohrmann, J., Mengus, J.M., Montanari, D., Ravaglia, A., Schlische, R., Withjack, M., Nilfouroushan, F., Yamada, Y., 2006. Analogue benchmarks of shortening and extension experiments. In: Buiter, S.J.H., Schreurs, G. (Eds.), Analogue and Numerical Modelling of Crustal-scale Processes. Geological Society of London, Special Publication, vol. 253, pp. 1e27.
Turrini, C., Ravaglia, A., Peroti, C., 2001. Compressional structures in a multilayered mechanical stratigraphy: insights from sandbox modeling with three-dimensional variations in basal geometry and friction. In: Koyi, H.A., Mancktelow, N.S. (Eds.), Tectonic Modeling: A Volume in Honor of Hans Ram-berg. Geological Society of America, Memoir, vol. 193, pp. 153e178.
Withjack, M.O., Schlische, R.W., 2006. Geometric and experimental models of extensional fault-bend folds. Geological Society of London, Special Publication 253, 285e305.
Withjack, M.O., Schlische, R.W., Henza, A.A., 2007. Scaled experimental models of extension: dry sand versus wet clay. Houston Geological Survey 49 (8), 31e49.
Yagupsky, D.L., Cristallini, E.O., Fantín, J., Valcarce, G.Z., Botttesi, G., Varadé, R., 2008. Oblique half-graben inversion of the Mesozoic Neuquén Rift in the Malargüe Fold and Thrust Belt, Mendonza, Argentina: new insights from analogue models. Journal of Structural Geology 30, 839e853.
Yamada, Y., Baba, K., Matsuoka, T., 2006. Analogue and numerical modelling of accretionary prisms with a décollement in sediments. In: Buiter, S.J.H., Schreurs, G. (Eds.), Analogue and Numerical Modelling of Crustal-scale Processes. Geological Society of London, Special Publication, vol. 253, pp. 169e183.
0 10 20 30 40 50
0 2 4 6 8 10 12
W
ed
g
e Su
rf
ace Slo
p
e
(°
)
Shortening (cm) Sand
Sand barite mixture Sand mica mixture
Fig. 10.Plots of wedge surface slope as a function of shortening for the three experiments.