AMTD
4, 3739–3785, 2011Information operator approach for the inversion of FTIR
spectra
C. Senten et al.
Title Page
Abstract Introduction
Conclusions References
Tables Figures
◭ ◮
◭ ◮
Back Close
Full Screen / Esc
Printer-friendly Version
Interactive Discussion
Discussion
P
a
per
|
Dis
cussion
P
a
per
|
Discussion
P
a
per
|
Discussio
n
P
a
per
|
Atmos. Meas. Tech. Discuss., 4, 3739–3785, 2011 www.atmos-meas-tech-discuss.net/4/3739/2011/ doi:10.5194/amtd-4-3739-2011
© Author(s) 2011. CC Attribution 3.0 License.
Atmospheric Measurement Techniques Discussions
This discussion paper is/has been under review for the journal Atmospheric Measure-ment Techniques (AMT). Please refer to the corresponding final paper in AMT
if available.
Information operator approach applied to
the retrieval of the vertical distribution of
atmospheric constituents from
ground-based high-resolution FTIR
measurements
C. Senten, M. De Mazi `ere, G. Vanhaelewyn, and C. Vigouroux
Belgian Institute for Space Aeronomy (BIRA-IASB), Ringlaan 3, 1180 Brussels, Belgium Received: 5 April 2011 – Accepted: 5 May 2011 – Published: 14 June 2011
Correspondence to: C. Senten ([email protected])
AMTD
4, 3739–3785, 2011Information operator approach for the inversion of FTIR
spectra
C. Senten et al.
Title Page
Abstract Introduction
Conclusions References
Tables Figures
◭ ◮
◭ ◮
Back Close
Full Screen / Esc
Printer-friendly Version
Interactive Discussion
Discussion
P
a
per
|
Dis
cussion
P
a
per
|
Discussion
P
a
per
|
Discussio
n
P
a
per
|
Abstract
The analysis of high spectral resolution Fourier Transform infrared (FTIR) solar absorp-tion spectra is an important issue in remote sensing. If this is done carefully, one can obtain information, not only about the total column abundances, but also about the ver-tical distribution of various constituents in the atmosphere. This work introduces the
5
application of the information operator approach for extracting vertical profile informa-tion from ground-based FTIR measurements. The algorithm is implemented and tested within the well-known retrieval code SFIT2, adapting the optimal estimation method such as to take into account only the significant contributions to the solution. In par-ticular, we demonstrate the feasibility of the method in an application to ground-based
10
FTIR spectra taken in the frame of the Network for the Detection of Atmospheric Com-position Change (NDACC) at Ile de La R ´eunion (21◦S, 55◦E). A thorough comparison is made between the original optimal estimation method and this alternative retrieval algorithm, regarding information content, retrieval robustness and corresponding full error budget evaluation for the target species ozone (O3), nitrous oxide (N2O), methane
15
(CH4), and carbon monoxide (CO). For O3and CH4, a comparison with the Tikhonov regularization method has also been made. It is shown that the information operator approach performs well and in most cases yields both a better accuracy and stability than the optimal estimation method. Additionally, the information operator approach has the advantage of being less sensitive to the choice of a priori information. The
20
Tikhonov regularization results seem to be situated between both methods’ results, as to profile retrievals, error budgets and column stability.
1 Introduction
Since 2002 the Belgian Institute for Space Aeronomy (BIRA-IASB) is responsible for measurements of high resolution ground-based FTIR solar absorption spectra at the
25
AMTD
4, 3739–3785, 2011Information operator approach for the inversion of FTIR
spectra
C. Senten et al.
Title Page
Abstract Introduction
Conclusions References
Tables Figures
◭ ◮
◭ ◮
Back Close
Full Screen / Esc
Printer-friendly Version
Interactive Discussion
Discussion
P
a
per
|
Dis
cussion
P
a
per
|
Discussion
P
a
per
|
Discussio
n
P
a
per
|
located at 21◦S, 55◦E, in the Indian Ocean, East of Madagascar, at the edge be-tween the southern tropics and subtropics and it is coordinated by the Laboratoire de l’Atmosph `ere et des Cyclones (LACy) of the Universit ´e de La R ´eunion. These FTIR observations contribute to the worldwide survey of the evolution of the atmospheric composition and structure, in the frame of NDACC (Kurylo and Solomon, 1990; Kurylo,
5
1991). It is therefore fundamental to extract as much information as possible about the vertical distribution of the target atmospheric constituents absorbing within the FTIR spectral ranges, and to make sure that the gained knowledge is reliable. The vertical profile information can be derived from the line shape of the absorption lines via the altitude dependence of the pressure broadening.
10
The analyses shown here focus on the atmospheric species O3, N2O, CH4, and CO. These gases have been selected for several reasons. First, they are mandatory species within the NDACC Infrared Working Group (IRWG), because of their important roles in tropospheric and stratospheric chemistry and their link to current environmental problems like climate change and stratospheric ozone depletion. Second, at Ile de La
15
R ´eunion, CO is an important tracer of biomass burning. Additional arguments to study these trace gases are that they have different numbers of degrees of freedom for signal (Sect. 2.2.2) and that they are very much wanted for satellite validation.
Within the NDACC IRWG it is common to use the optimal estimation method (OEM) (Rodgers, 2000) or Tikhonov regularization (TR) (Tikhonov, 1963) to solve the inverse
20
problem. Nevertheless, in some cases one may encounter problems like vertical profile instability or physically unrealistic retrieval results. Looking for a more robust inversion method in order to eliminate these difficulties has lead us to the information operator approach (IOA) (Doicu et al., 2007), which has been proved successful for the inversion of satellite data by Hoogen et al. (1999). The fact that the IOA is by definition based
25
AMTD
4, 3739–3785, 2011Information operator approach for the inversion of FTIR
spectra
C. Senten et al.
Title Page
Abstract Introduction
Conclusions References
Tables Figures
◭ ◮
◭ ◮
Back Close
Full Screen / Esc
Printer-friendly Version
Interactive Discussion
Discussion
P
a
per
|
Dis
cussion
P
a
per
|
Discussion
P
a
per
|
Discussio
n
P
a
per
|
to spectra measured from the ground, it is very useful to test its feasibility for ground-based FTIR observations and to verify its possibilities with respect to the OEM and TR. In order to perform the retrievals of the above mentioned trace gases with the IOA, we implemented this new algorithm into the retrieval code SFIT2 (v3.94), jointly developed at the NASA Langley Research Center, the National Center for Atmospheric Research
5
(NCAR) and the National Institute of Water and Atmosphere Research (NIWA) (Rins-land et al., 1998; Hase et al., 2004).
The paper is organised as follows: Sect. 2 provides a theoretical description of the IOA retrieval method, while Sect. 3 shows the retrieval results and error budget evalu-ations for the target species obtained from the above mentioned FTIR spectra, when
10
applying the OEM, IOA and – for O3and CH4– TR. Section 4 discusses the influence of the a priori information on the OEM, IOA and TR results. Conclusions are given in Sect. 5.
2 General description of the information operator approach
The problem we are facing is the retrieval of the vertical distribution of target
atmo-15
spheric species from ground-based high-resolution solar absorption spectra. The com-mon used algorithm, SFIT2, is based on a semi-empirical implementation of the OEM of Rodgers (2000). Applying the IOA onto the OEM, is an efficient way of automatically using only those components of the measurements that effectively contribute to the fi-nal information content, prior to knowing how much information you can get and where
20
it is situated. How this can be achieved, is explained in Sect. 2.2.
2.1 Forward model
The forward model in SFIT2 is a multi-layer multi-species line-by-line radiative trans-fer model and remains unchanged when applying the IOA. The instrument parameters in the forward model include a wavenumber scale multiplier and background curve
AMTD
4, 3739–3785, 2011Information operator approach for the inversion of FTIR
spectra
C. Senten et al.
Title Page
Abstract Introduction
Conclusions References
Tables Figures
◭ ◮
◭ ◮
Back Close
Full Screen / Esc
Printer-friendly Version
Interactive Discussion
Discussion
P
a
per
|
Dis
cussion
P
a
per
|
Discussion
P
a
per
|
Discussio
n
P
a
per
|
parameters, as well as the actual optical path difference and field of view of the in-strument. To account for deviations from the ideal instrument line shape function due to small instrument misalignments or imperfections, empirical apodization and phase error functions are included in the forward calculations. These calculations are exe-cuted on a fine altitude grid to take into account the local atmospheric pressure and
5
temperature variabilities.
2.2 Inverse model
The inverse problem consists of determining the best representation of the true state of the atmosphere from the observed absorption spectra, more specifically the vertical distributions and total column amounts of the target molecules. In order to solve this
10
ill-posed problem, some regularization within the ensemble of possible solutions is re-quired. To enhance the performance of the standard SFIT2 retrieval code, results from information theory can be taken into account explicitly. We now present the theoretical background of this adapted optimal estimation scheme incorporating the IOA, as well as its implementation in the SFIT2 algorithm.
15
2.2.1 Adapted retrieval method
First note that the retrieval of vertical profiles from FTIR data is an underconstrained problem, because of the following reasons: (1) a profile is a continuous function of altitude, whereas an FTIR spectrometer provides measurements only at a discrete number of wavelengths; and (2) there are components in the actual profile which do
20
not contribute to the measurements and, consequently, cannot be determined from them. In order to numerically solve the inverse problem, the profile is discretized to a finite number of height levels between which it is assumed to be a linear function of altitude. Additional information is needed to get a physically reasonable result. In particular, when using the OEM, a priori knowledge about the atmospheric trace gas
25
AMTD
4, 3739–3785, 2011Information operator approach for the inversion of FTIR
spectra
C. Senten et al.
Title Page
Abstract Introduction
Conclusions References
Tables Figures
◭ ◮
◭ ◮
Back Close
Full Screen / Esc
Printer-friendly Version
Interactive Discussion
Discussion
P
a
per
|
Dis
cussion
P
a
per
|
Discussion
P
a
per
|
Discussio
n
P
a
per
|
Since the vector of transmittances of the observed solar absorption spectrum within the ranges of the fitted micro-window(s) is a nonlinear function of the atmospheric state, the retrieval solution has to be found iteratively. In the iteration step i+1 the optimal estimation solution can be written as (Rodgers, 2000):
xi+1 = xa + KTi S−y1Ki + S−a1 −1
KTi S−y1
y − yi + Ki (xi − xa)
, (1)
5
wherexa is the a priori atmospheric state vector (of dimension N), Sa is the a priori covariance matrix, y is the measurement vector (of dimension M), yi is the same quantity calculated by the forward model using the resultxi from the previous iterationi, Sy is the measurement error covariance matrix, andKi is the weighting function matrix, defined asδy/δx, after thei-th iteration. When convergence has occurred, the result
10
of the last iteration is identified with the retrieval solutionxr. The corresponding solution covariance matrix is then given by Rodgers (2000):
Sr =
KTr S−y1Kr + S
−1 a
−1
. (2)
As mentioned in Sect. 2.1,yis not only influenced by the target species’ absorption but also by several other parameters, such as the background curve and wavelength shift
15
parameters, the empirical apodization and phase error polynomial function parameters, and the interfering species’ absorptions. By including these additional fit parameters in the state vector x, the target profile retrievals can be improved significantly. Note that the number of elements inxis much larger than the number of independent ele-ments that can be retrieved from the measurement. Moreover, in practice, the number
20
of independent retrieved parameters is even smaller due to inevitable measurement noise. Theoretically, the information content of the measurement can be defined as the reduction in entropy of the posteriori knowledge about the atmospheric state with respect to the a priori knowledge (Shannon and Weaver, 1949). Under the assumption thatxa andxr are Gaussian distributed, the information contentH of a measurement
25
AMTD
4, 3739–3785, 2011Information operator approach for the inversion of FTIR
spectra
C. Senten et al.
Title Page Abstract Introduction Conclusions References Tables Figures ◭ ◮ ◭ ◮ Back Close
Full Screen / Esc
Printer-friendly Version Interactive Discussion Discussion P a per | Dis cussion P a per | Discussion P a per | Discussio n P a per |
H = 1/2 ln
det (Sa)
− 1/2 ln [det (Sr)]. (3)
Using the definitionPr=SaGr, withGr=KTrS−y1Kr, Eq. (3) can be rewritten as:
H = 1/2 ln hdet SaS
−1 r
i
= 1/2 ln [det (Pr + I)] = 1/2
N
X
n=1
ln λr,n + 1
, (4)
whereλr,n (n=1, ...,N) are the eigenvalues of theN×N matrixPr, the so-called “Ko-zlov information matrix” (Ko“Ko-zlov, 1983). These eigenvalues thus represent the
informa-5
tion content in the measurement, while the corresponding eigenvectors form a basis for the solution space. Hence, only theNopteigenvalues with a relevant contribution to the information content, i.e., 1/2 ln (λr,n+1)≥1 orλr,n/(1+λr,n)≈1 (n=1, ...,Nopt≤N), should be taken into account. The associated eigenvectorsφr,n(n=1, ..., Nopt) span the effective state space accessible with the measurement. Therefore, the IOA retrieval
10
results directly depend on the information content of the measurement by expanding – in each iteration – the difference between the a priori and the true state vector into a series of the significant eigenvectors ofPi. This gives the following equation:
xi+1 − xa =
Nopt
X
n=1
βi ,nφi ,n. (5)
Now, instead of the state vectorxi+1itself, the coefficientsβi ,nhave to be determined.
15
In Hoogen et al. (1999) some straightforward calculations lead to the derivation of the expansion coefficientsβi ,n(n=1, ...,Nopt):
βi ,n = λi ,n/Ni ,n 1 + λi ,n φTi ,n K
T
i S
−1
y
y − yi + Ki (xi − xa)
, (6)
where Ni ,n=φTi ,nK
T
iS
−1
y Kiφi ,n (n=1, ..., Nopt) are normalization factors defined as such.
20
In our implementation the calculation of the eigenvectors and eigenvalues of Pi is
AMTD
4, 3739–3785, 2011Information operator approach for the inversion of FTIR
spectra
C. Senten et al.
Title Page
Abstract Introduction
Conclusions References
Tables Figures
◭ ◮
◭ ◮
Back Close
Full Screen / Esc
Printer-friendly Version
Interactive Discussion
Discussion
P
a
per
|
Dis
cussion
P
a
per
|
Discussion
P
a
per
|
Discussio
n
P
a
per
|
is iteratively decomposed into the product of an orthogonal matrix Q and an upper triangular matrixR, until the method converges and all eigenvalues and eigenvectors are determined. As the repeated QR factorizations can be quite expensive, the real non-symmetric matrixPi is first reduced to the simpler upper Hessenberg form and then the similarity transformations are accumulated.
5
It is obvious that this “eigenvector approach” uses a priori information in the same statistical sense as the original optimal estimation method. Though, it has the advan-tage that only those components are considered about which the measurement actu-ally provides information. In addition, since basicactu-ally only a linear combination of the significant eigenvectors has to be calculated and since the QR method is very efficient
10
and numerically stable, the IOA is expected to encounter less singularity problems than the OEM and TR.
2.2.2 Information content and sensitivity
The retrieved state vectorxr is related to the a priori and the true state vectorsxaand
x, respectively, by the equation (Rodgers, 2000):
15
xr = xa + A(x − xa), (7) whereAis defined asδxr/δx, or in case of OEM:
A = KTr S−1
y Kr + S
−1 a
−1
KTr S−1
y Kr. (8)
The rows of the matrixAare called the averaging kernels, and the trace of Aequals the number of degrees of freedom for signal (DOFS). For each of the retrieval layers
20
the full width at half maximum of the averaging kernel provides an estimate of the vertical resolution of the profile retrieval at the corresponding altitude, while the area of the averaging kernel represents the sensitivity of the retrieval at the corresponding altitude to the true state. The DOFS together with the averaging kernel shapes define the independent partial columns that represent the retrieval results at best.
AMTD
4, 3739–3785, 2011Information operator approach for the inversion of FTIR
spectra
C. Senten et al.
Title Page Abstract Introduction Conclusions References Tables Figures ◭ ◮ ◭ ◮ Back Close
Full Screen / Esc
Printer-friendly Version Interactive Discussion Discussion P a per | Dis cussion P a per | Discussion P a per | Discussio n P a per |
The matrixAin Eq. (8) can be written as a function ofPr, namely:
A = SaKTr S−1
y Kr + I −1
SaKTr S−1
y Kr = (Pr + I)
−1 P
r, (9)
such that the trace ofAequals
N
P
n=1
λr,n/(1+λr,n) in case of OEM.
When we derive A in case of IOA, we get the following expression for each ele-menti,j ofA(i=1, ...,Nandj=1, ...,N):
5
(A)i ,j =
Nopt
X
n=1
λr,n/
Nr,n 1 + λr,n
φTr,nKTr S−y1Kr
1,j φr,n
i ,1. (10)
The trace ofA, or the DOFS, now equals
Nopt
P
n=1
λr,n/(1+λr,n). Note that if we would use
all eigenvalues of Pr (i.e., Nopt=N), instead of only the significant ones, this would correspond to the trace ofAresulting from the OEM.
Analogous toA, in case of IOA, the gain matrixGr, defined asδxr/δy, becomes:
10
(Gr)i ,j =
Nopt
X
n=1
λr,n/
Nr,n 1 + λr,n
φTr,nKTr S−1
y
1,j φr,n
i ,1, (11)
withi=1, ...,N andj=1, ...,M.
Note that all definitions of the error components for the OEM are still valid for the IOA applied to the OEM, as this alternative retrieval method is based on the same premises. In the numerical evaluations we have to use the adapted expressions for the averaging
15
kernel and gain matrix (Eqs. 10 and 11).
2.2.3 Tikhonov regularization
AMTD
4, 3739–3785, 2011Information operator approach for the inversion of FTIR
spectra
C. Senten et al.
Title Page
Abstract Introduction
Conclusions References
Tables Figures
◭ ◮
◭ ◮
Back Close
Full Screen / Esc
Printer-friendly Version
Interactive Discussion
Discussion
P
a
per
|
Dis
cussion
P
a
per
|
Discussion
P
a
per
|
Discussio
n
P
a
per
|
TR solution is calculated iteratively by the following expression (Schimpf and Schreier, 1997):
xi+1 = xa + KTi S−1
y Ki + α RTR
−1
KTi S−1
y
y − yi +Ki (xi − xa), (12) whereRandαare the regularization matrix and regularization parameter, respectively. Both are introduced to constrain the state vector or in other words to incorporate
in-5
formation about the solution magnitude and smoothness. Again, all error components are calculated in the same way as for the OEM retrievals.
For the O3 and CH4 retrievals obtained with the TR, we have used the L1 regular-ization matrix, i.e.,R=L1. This L1 is by definition a (N−1)×N matrix composed by
zeros except for the elementsL1(i,i)=−1 andL1(i,i+1)=1, fori=1, ...,N−1. The
10
parameterαwe have used, is the one that results in the best compromise between the DOFS and the total random error on the total column, which – under the assumption that the other error components do not vary withα – we have evaluated here by sum-ming up the covariance matrices of the forward model parameter error, the smoothing error, the interfering species’ errors and the measurement noise error.
15
3 Application of the IOA to ground-based FTIR data
As discussed in the introduction, we have focused on the retrieval results of ozone (O3), methane (CH4), nitrous oxide (N2O) and carbon monoxide (CO). In addition to the total column abundances of these molecules, we have extracted information – whenever feasible – about their vertical distribution between the ground and 100 km altitude. In
20
AMTD
4, 3739–3785, 2011Information operator approach for the inversion of FTIR
spectra
C. Senten et al.
Title Page
Abstract Introduction
Conclusions References
Tables Figures
◭ ◮
◭ ◮
Back Close
Full Screen / Esc
Printer-friendly Version
Interactive Discussion
Discussion
P
a
per
|
Dis
cussion
P
a
per
|
Discussion
P
a
per
|
Discussio
n
P
a
per
|
3.1 Specifications of the FTIR measurements
Before the continuous operations started in May 2009, three FTIR solar absorption measurement campaigns have been carried out at Ile de La R ´eunion, namely in 2002, 2004 and 2007. Within the scope of this paper we concentrate on spectra taken dur-ing the third campaign, from May to October 2007. In particular, these spectra are
5
recorded using a mobile Bruker 120M Fourier Transform spectrometer installed at the St.-Denis University campus (50 m a.s.l., 20◦54′S and 55◦29′E). The 2007 campaign was performed with the same experimental setup as the 2004 campaign, which is de-scribed in detail in Senten et al. (2008). Note that the FTIR experiment at Ile de La R ´eunion is qualified as an NDACC-compliant experiment, confirming that it satisfies all
10
quality criteria imposed by the NDACC Infrared Working Group.
3.2 Retrieval results
3.2.1 Retrieval strategy and spectral fits
For all retrievals discussed in this paper the absorption line parameters were taken from the HITRAN 2008 spectral database (Rothman et al., 2009) in combination with
15
available updates on the HITRAN website (http://www.hitran.com). The spectral micro-windows in which the absorption features of the target and interfering species are fitted, are selected such that they contain unsaturated well-isolated absorption features of the target species with a minimal number of interfering absorption lines, and such that the amount of information present in the spectra – represented by the DOFS – is
20
maximized.
The used a priori profilexaand its associated covariance matrixSashould represent a good guess of the ‘true’ state, in particular at those altitudes where one can hardly get information out of the measurements. Note that in order to compare the OEM and IOA retrievals, we use the samexaandSafor both methods, rather than imposing the
25
AMTD
4, 3739–3785, 2011Information operator approach for the inversion of FTIR
spectra
C. Senten et al.
Title Page
Abstract Introduction
Conclusions References
Tables Figures
◭ ◮
◭ ◮
Back Close
Full Screen / Esc
Printer-friendly Version
Interactive Discussion
Discussion
P
a
per
|
Dis
cussion
P
a
per
|
Discussion
P
a
per
|
Discussio
n
P
a
per
|
The diagonal elements of the measurement error covariance matrix are defined to be an estimate of the squared reciprocals of a representative signal-to-noise ratio (SNR). The off-diagonal elements are set to zero, which means that the measurement errors at different wavelengths are assumed to be uncorrelated.
For the N2O and CH4retrievals the selected micro-windows (fitted simultaneously),
5
the associated interfering molecules, the used a priori profiles and the corresponding a priori covariance matrices are adopted from Senten et al. (2008). The O3 retrieval strategy is the one used by Vigouroux et al. (2008), and for CO we adopted the strategy from Duflot et al. (2010). A recapitulating overview of these choices is provided in Table 1.
10
3.2.2 Choice of eigenvalues and eigenvectors to be used
Before discussing the IOA retrieval results, we clarify the criterium to determine the most appropriate numberNopt(≤N) of terms to be used in the IOA sum, i.e., Eq. (5), yielding the best compromise between the information content and the stability of the retrieval results. In particular, a suitable thresholdg has to be searched for, meeting
15
the conditionλr,n/(1+λr,n)≥g, withg <1. As the eigenvectors corresponding to smaller
eigenvalues have the property of being more oscillatory, it is easy to understand that the more eigenvectors we include in the linear combination defining the retrieval so-lution, the more this solution will oscillate. On the other hand, if we do not include enough eigenvectors, the solution will no longer be representative of the true state and
20
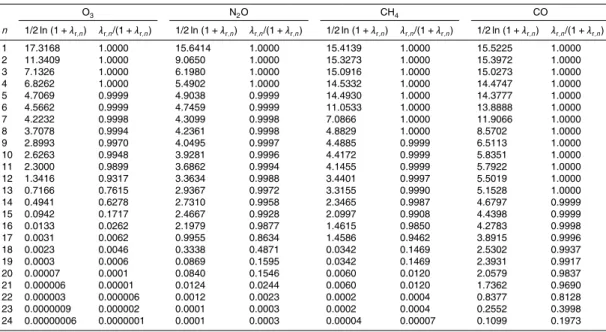
the DOFS will be considerably smaller. Table 2 shows the evolution of 1/2 ln (λr,n+1)
and λr,n/(1+λr,n) for the largest 24 eigenvalues λr,n of Pr for an illustrative IOA re-trieval of each target molecule. The systematic drop down of both quantities around 1 and 0.8, respectively, indicates that including the subsequent smaller eigenvalues and eigenvectors in the IOA calculations would not significantly contribute to the solution.
25
AMTD
4, 3739–3785, 2011Information operator approach for the inversion of FTIR
spectra
C. Senten et al.
Title Page
Abstract Introduction
Conclusions References
Tables Figures
◭ ◮
◭ ◮
Back Close
Full Screen / Esc
Printer-friendly Version
Interactive Discussion
Discussion
P
a
per
|
Dis
cussion
P
a
per
|
Discussion
P
a
per
|
Discussio
n
P
a
per
|
By definition of the IOA, when decreasingg, the IOA solution approaches the OEM solution, up to the point of using all eigenvalues and eigenvectors in the IOA sum, i.e.,
g=0, or equivalently,Nopt=Nin Eq. (5). The remaining difference – though very small – between the retrieval result from OEM and IOA withg=0 comes from the fact that the state space spanned by both methods is not exactly the same.
5
The impact of different threshold values between 0 and 1 on the retrieved profiles can be seen in Fig. 1, showing the N2O profiles for the whole 2007 campaign obtained with the OEM and with the IOA forgequal to 0.09, 0.79 and 0.99. These three values ofg
correspond to including about 20, 17 and 15 terms in the IOA decomposition, and result in 3.3, 2.9 and 1.6 DOFS on average, respectively. Consequently, the smoothing error
10
increases. The root mean square (RMS) values of the spectral fit residual, calculated from the differences between the observed and simulated spectral points, equal 0.15, 0.15 and 0.16 on average, respectively. This demonstrates the poor sensitivity of the spectral fit to the choice of g, or correspondingly, to the retained dimension of the state space. Obviously, the IOA profiles for g=0.99 are less oscillating than those
15
for g=0.79, which in turn are less oscillating than those for g=0.09. These plots also confirm the statement that in the limit the IOA profiles move toward the OEM profiles. The same behavior was observed in the tests we performed for the other target molecules.
Figure 2 shows the curves of y=1/2 ln (x+1) and y=x/(1+x) for x between 0
20
and 20 and for the eigenvalues of the Kozlov information matrixPr that lay within this domain, for O3 and CO. Clearly, the intersection point of these two curves is situated around 0.79. Note that the eigenvalues ofPrfor N2O and CH4yield similar graphs, but are left out here, just for clarity of the figure.
Based on the considerations above, we conclude that the best compromise is
at-25
AMTD
4, 3739–3785, 2011Information operator approach for the inversion of FTIR
spectra
C. Senten et al.
Title Page
Abstract Introduction
Conclusions References
Tables Figures
◭ ◮
◭ ◮
Back Close
Full Screen / Esc
Printer-friendly Version
Interactive Discussion
Discussion
P
a
per
|
Dis
cussion
P
a
per
|
Discussion
P
a
per
|
Discussio
n
P
a
per
|
3.2.3 Vertical profiles and column amounts
For the discussion of the characteristics of the IOA compared to the OEM and TR, we analyzed the vertical profile and column retrievals for the complete set of 2007 spectra. However, full error budget evaluations are made here only for one reference spectrum for each target molecule, because performing the error calculations for all
5
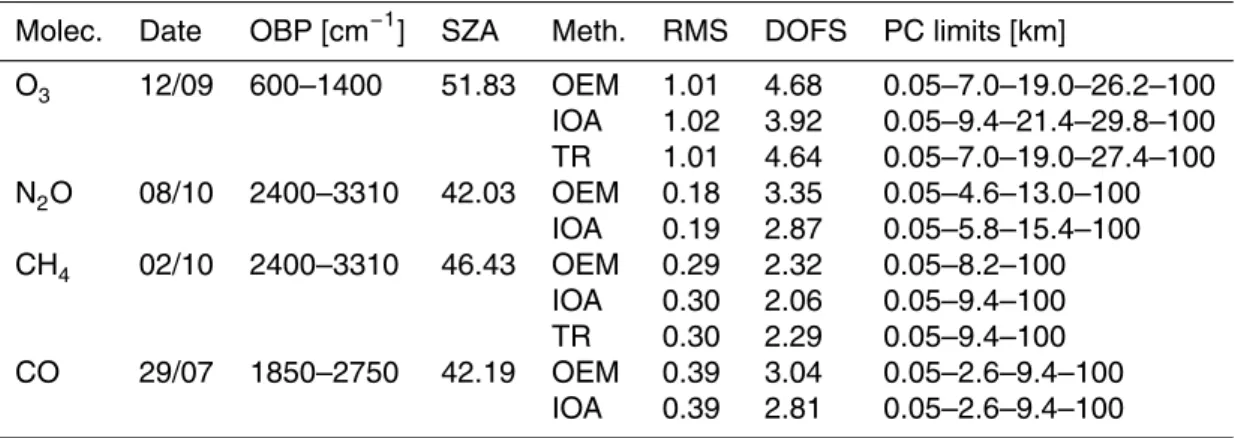
spectra would have been too time-consuming. The choice of these typical reference spectra is based on their representativeness for the whole 2007 dataset, with respect to the solar zenith angle (SZA), the retrieved profile shape and the DOFS. Table 3 lists the date, the optical bandpass (OBP) and the SZA for the reference spectra analyzed for each species, together with the RMS of the spectral fit residual, the DOFS and
10
the corresponding partial column (PC) ranges when applying the OEM, IOA and – for O3 and CH4 – TR. For each molecule the RMS value and the integer nearest to the number of degrees of freedom for signal are the same for every method, whereas the partial column limits are slightly different. These limits correspond to the altitude ranges that comprise at least one degree of freedom for signal. In order to allow direct
15
comparison of the OEM, IOA and – for O3and CH4– TR partial columns, or in other words, to discuss the retrieval results in terms of partial columns with identical altitude boundaries, from now on, the altitude ranges are deduced from the averaging kernel matrices such that the sum of the diagonal elements of A is at least one for every method, thus possibly increasing some of the partial column widths. If the remaining
20
diagonal elements add up to more than 0.6, the resulting altitude range is considered as an additional partial column.
Figures 3, 5, 7 and 9 illustrate the single or multiple micro-window fits of O3, N2O, CH4, and CO, respectively, for the reference spectra listed in Table 3, together with the residuals, computed as measured minus simulated transmission. Figures 4, 6,
25
AMTD
4, 3739–3785, 2011Information operator approach for the inversion of FTIR
spectra
C. Senten et al.
Title Page
Abstract Introduction
Conclusions References
Tables Figures
◭ ◮
◭ ◮
Back Close
Full Screen / Esc
Printer-friendly Version
Interactive Discussion
Discussion
P
a
per
|
Dis
cussion
P
a
per
|
Discussion
P
a
per
|
Discussio
n
P
a
per
|
For O3 the SNR and α are 150 and 1, respectively, and for CH4 they are 250 and
3, respectively. As the reference spectra are carefully chosen, they well represent the complete dataset and, in turn, their resulting vertical profiles have also been found to be representative. The retrieved vertical profiles will therefore not be shown individually.
For every target gas the spectral fits look very similar for each method. For O3and
5
CO the retrieved profile is similar for each method. For N2O and CH4the OEM retrieved profile slightly oscillates near the surface, whereas the IOA profile is more stable. The TR profile of CH4 oscillates less than the OEM profile but more than the IOA profile. In order to confirm and to generalize this conclusion, Fig. 11 shows the CH4 vertical VMR profiles obtained with the OEM, IOA and TR, from the whole set of FTIR spectra
10
taken at St.-Denis in 2007. In the troposphere the TR profiles are slightly more stable than the OEM and IOA profiles, whereas at higher altitudes they are less stable than the IOA profiles, but still more stable than the OEM profiles. Note that the two groups that can be distinguished most clearly in case of IOA correspond to spectra recorded at a SZA smaller and larger than 49◦, respectively. The reason for this effect is not yet
15
understood.
Table 4 summarizes the mean DOFS, the mean number of iterations in the fit (ITER), the mean RMS values of the spectral fit residual, the mean total and partial col-umn amounts (CA) (in molecules cm−2) and the mean daily relative standard deviation (STD) on the CA (in %) for each molecule when applying the OEM, IOA and – for O3
20
and CH4 – TR. The mean daily relative standard deviations are considered to provide a good measure for the quality of the retrieval method, because they reflect the stability of the retrieved column amounts. Ideally, the latter do not change much over the course of a day, as the diurnal variations of the retrieved target molecules are supposed to be small. For all retrievals performed, we observe that the quality of the spectral fits –
25
AMTD
4, 3739–3785, 2011Information operator approach for the inversion of FTIR
spectra
C. Senten et al.
Title Page
Abstract Introduction
Conclusions References
Tables Figures
◭ ◮
◭ ◮
Back Close
Full Screen / Esc
Printer-friendly Version
Interactive Discussion
Discussion
P
a
per
|
Dis
cussion
P
a
per
|
Discussion
P
a
per
|
Discussio
n
P
a
per
|
to the fact that the IOA leaves out all components that do not contribute significantly to the information content. In general, this loss – between 0 and 0.5 – does not affect the number of partial columns that can be distinguished. For O3, N2O and CO the mean daily relative standard deviations on the VCA are alike for each method, whereas for CH4it is obviously smaller for the IOA and TR. For CO the mean daily relative standard
5
deviations on the PCA are similar for each method. For O3they are largest for the IOA, for N2O they are smaller for the IOA, and for CH4they are smallest for the TR.
Figure 12 shows the time series of the total and partial column amounts (in molecules cm−2) of O3, N2O, CH4 and CO, respectively, during the FTIR campaign at St.-Denis in 2007, retrieved with the OEM, IOA and – for O3 and CH4– TR. For O3
10
and CO each method gives about the same partial and total column values, i.e., with-out significant bias. For N2O the partial and total columns are distributed in a slightly different way, with respective biases of about 0.2 %. For CH4there is a systematic bias of the order of 1.5 % between the OEM and IOA daily mean partial and total columns, while the bias between the OEM and TR column amounts is about 1 %.
15
3.2.4 Error budget evaluations
For a detailed description of all error components quantifying the reliability of the re-trieval results, we refer to Senten et al. (2008). In particular, the following error con-tributions are calculated: the smoothing error, the forward model parameter error, the measurement noise error, the errors due to the uncertainties in the temperature profile,
20
in the solar zenith angle, in the interfering species’ profiles, and in the intensity and pressure broadening of the target spectral lines, as well as the errors due to the uncer-tainties in the instrument line shape, i.e., the modulation amplitude and phase. As said before, all error components for the IOA and TR retrievals are calculated in the same way as for the OEM retrievals, using the appropriate averaging kernels and gain
matri-25
AMTD
4, 3739–3785, 2011Information operator approach for the inversion of FTIR
spectra
C. Senten et al.
Title Page
Abstract Introduction
Conclusions References
Tables Figures
◭ ◮
◭ ◮
Back Close
Full Screen / Esc
Printer-friendly Version
Interactive Discussion
Discussion
P
a
per
|
Dis
cussion
P
a
per
|
Discussion
P
a
per
|
Discussio
n
P
a
per
|
between NCEP and ECMWF temperature profiles at St.-Denis. The covariance ma-trices used for the ILS uncertainty errors represent the degradation of the modulation efficiency and the evolution of the phase error. They are both calculated from the dif-ferences between the observed ILS functions – calculated with Linefit8 (Hase et al., 1999) – over a three months time period in 2007 at St.-Denis. The maximum
uncer-5
tainty in the SZA was estimated at 0.2◦. The maximum uncertainties in the line intensity and pressure broadening of the spectral lines of the target molecule were derived from HITRAN 2008.
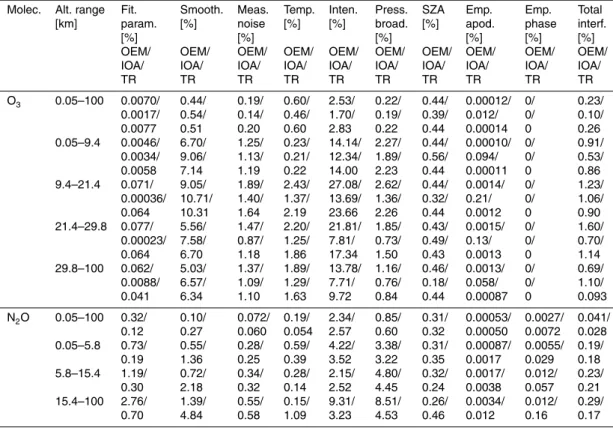
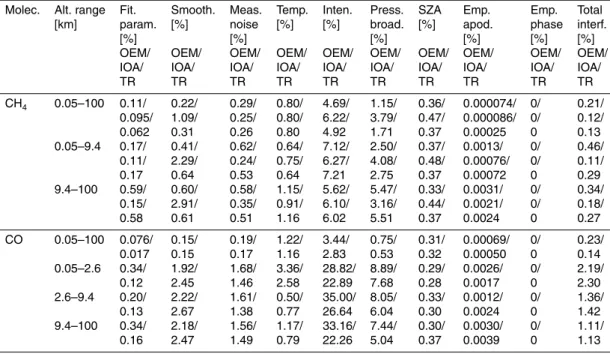
Table 5 gives an overview of the error budgets on the total and partial columns of O3, N2O, CH4and CO, when using the OEM, IOA and – for O3and CH4– TR. More
specif-10
ically, the smoothing error, the total random error without the smoothing component, the total random error, the total systematic error and the total error are shown. The in-dividual contributions to the total random error are the forward model parameters error, the ILS errors, the temperature error, the measurement noise error, the SZA error, the interfering species errors, and the smoothing error, whereas the total systematic error
15
includes the line intensity error and pressure broadening error. The complete table of all these individual contributions can be found in Table A1.
Although at first sight each retrieval method behaves similarly regarding error bud-gets, we observe non-negligible differences. For every retrieved target gas, both the total systematic error and the total random error without the smoothing contribution
20
are significantly smaller when applying the IOA, for the total as well as for the partial columns. Only for the N2O and CH4total columns the systematic error is unexpectedly larger for the IOA. The reduced random error for the IOA comes from a decrease of the forward model parameter error, the measurement noise error and the temperature error (see Table A1). The smoothing error is larger when using the IOA, which is in
25
AMTD
4, 3739–3785, 2011Information operator approach for the inversion of FTIR
spectra
C. Senten et al.
Title Page
Abstract Introduction
Conclusions References
Tables Figures
◭ ◮
◭ ◮
Back Close
Full Screen / Esc
Printer-friendly Version
Interactive Discussion
Discussion
P
a
per
|
Dis
cussion
P
a
per
|
Discussion
P
a
per
|
Discussio
n
P
a
per
|
As to the TR retrievals of O3and CH4, in general, we find that the total random error, the total systematic error and the total random error without the smoothing component lie between the values obtained with the OEM and with the IOA. However, there is one exception, namely the total systematic error for the CH4partial columns is largest when using TR.
5
4 Influence of a priori information
One of the goals of implementing the IOA was to improve the robustness of the retrieval results. We therefore studied the impact of the choice of a priori information onto the OEM, IOA and TR solutions. More specifically, we changed the diagonal elements of Sa and looked at the obtained volume mixing ratio (VMR) profiles, at the DOFS, at
10
the daily relative standard deviations on the total and partial column amounts and at the mean relative biases with respect to the original column values. In each case, the off-diagonal elements of Sa are kept unchanged and are determined by a Gaussian correlation function with an inter-layer correlation length of 4 km.
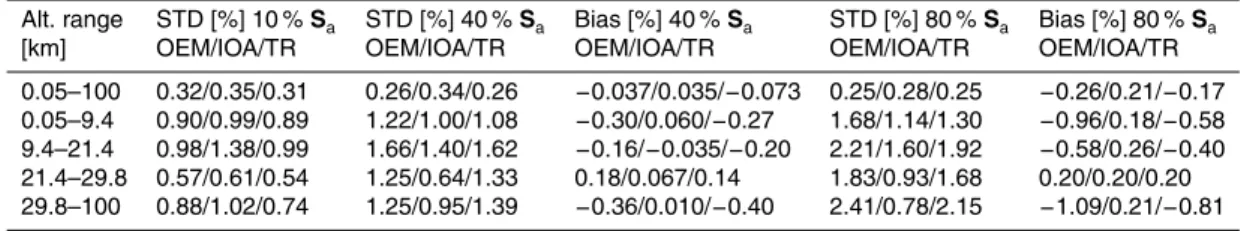
Table 6 shows the mean daily relative standard deviations (in %) for the 2007 time
15
series of the O3 total and partial column amounts (CA), when using 10 %, 40 % and 80 % as priori uncertainties on the diagonal ofSa, together with the mean relative bi-ases (in %) with respect to the original retrieval using 10 %Sa (CAref). These biases are calculated as 100×[
k
P
i=1
(CA−CAref)/((CA+CAref)/ 2)]/k, withk the number of
mea-sured spectra. Obviously, the mean relative biases on the total and partial column
20
values are smaller for the IOA retrievals than for the OEM and TR retrievals. Hence, the net effect of more stable column amounts in the case of IOA prevails, especially when allowing greater a priori uncertainties on the profiles. In agreement with this find-ing, the mean daily relative standard deviations on the IOA column amounts vary less
with a change ofSa than those on the OEM and TR column amounts. For the above
25
AMTD
4, 3739–3785, 2011Information operator approach for the inversion of FTIR
spectra
C. Senten et al.
Title Page
Abstract Introduction
Conclusions References
Tables Figures
◭ ◮
◭ ◮
Back Close
Full Screen / Esc
Printer-friendly Version
Interactive Discussion
Discussion
P
a
per
|
Dis
cussion
P
a
per
|
Discussion
P
a
per
|
Discussio
n
P
a
per
|
6.7, respectively, for the IOA results they are 3.9, 5.2 and 5.9, respectively, and for the TR retrievals they are 4.6, 6.0 and 6.5, respectively. Thus, for each method, the infor-mation content varies in the same way with respect to the applied a priori uncertainty, as expected.
As an illustration, Fig. 13 shows the OEM, IOA and TR O3 profile at St.-Denis on
5
12 June 2007, obtained when using Sa with on its diagonal 10 %, 40 % and 80 %,
respectively. Note that for the TR retrievals, changingSa, corresponds to changingα. In particular, in our test case of O3(SNR=150), the mentioned diagonal values 10 %, 40 % and 80 % correspond toα equal to 1, 0.05 and 0.02, respectively. It is clear that when we apply a too large variability on the volume mixing ratios, i.e., 40 % or more in
10
this example, the retrieved profile deviates strongly in the case of OEM and to a lesser extent in the case of TR, whereas it stays reasonably good for the IOA. This difference becomes larger as we increase the a priori uncertainty.
Figure 14 shows the OEM, IOA and TR O3profiles from all 2007 spectra at St.-Denis for 10 %, 40 % and 80 % Sa, confirming the statements above. Thus, IOA retrievals
15
are less sensitive to the choice of the a priori covariance matrix than OEM and TR retrievals. This can be understood by the fact that the IOA extracts the real information out of the measurements and is therefore less affected by unrealistic a priori choices.
Next, we looked at the same characteristics of the OEM, IOA and TR retrievals, but when changingxa instead ofSa. Table 7 shows the mean daily relative standard
20
deviations (in %) on the 2007 time series of O3total and partial column amounts, when usingxa, 2xa and 1/2xaas a priori profile, together with the mean relative biases (in %) with respect to the original retrieval using xa. The mean relative daily standard deviations appear to be most steady in the case of TR and, consistently, also the relative biases are smallest for the TR retrievals.
25
By means of example, Fig. 15 shows the OEM, IOA and TR O3 profile on
AMTD
4, 3739–3785, 2011Information operator approach for the inversion of FTIR
spectra
C. Senten et al.
Title Page
Abstract Introduction
Conclusions References
Tables Figures
◭ ◮
◭ ◮
Back Close
Full Screen / Esc
Printer-friendly Version
Interactive Discussion
Discussion
P
a
per
|
Dis
cussion
P
a
per
|
Discussion
P
a
per
|
Discussio
n
P
a
per
|
regularization matrix is by definition mainly influenced by the shape of the a priori profile, rather than by its magnitude. Note that this second test tells us something about the importance of the choice ofxa for the three methods, but nothing about the robustness of the retrieved profile.
Finally, we have also tested the sensitivity of the OEM, IOA and TR retrieval results
5
to the choice of the retrieval grid, and have found it to be similar for each method.
5 Conclusions
In this paper we have shown the application of the information operator approach (IOA) to the retrieval of the vertical distribution of atmospheric constituents from ground-based high spectral resolution FTIR solar absorption measurements. All our tests have
10
been performed on spectra taken at the southern hemisphere (sub)tropical site Ile de La R ´eunion in 2007. We have compared the IOA retrieval results for O3, N2O, CH4and CO with those obtained when using the optimal estimation method (OEM) and – for O3 and CH4– also with Tihkonov regularization (TR). Our findings prove that the IOA allows deriving more stable vertical profiles and total and partial column amounts for
15
the investigated atmospheric species, without significant loss of information and with generally lower error budgets. In addition, the IOA is less sensitive to the choice of the a priori covariance matrix.
Comparisons of the OEM and IOA retrieval results for O3 and CH4 with those ob-tained with TR have shown that the stability of the TR vertical profiles generally lies
20
between the OEM and IOA stability. The same is observed for the TR error budgets. The information content of the IOA retrievals is slightly smaller than the information content of the OEM and TR retrievals, a quantity being about the same for the last two methods. So, obviously, the IOA performs well and has some advantages with respect to the OEM and TR, especially regarding profile stability and error budget evaluations.
25
AMTD
4, 3739–3785, 2011Information operator approach for the inversion of FTIR
spectra
C. Senten et al.
Title Page
Abstract Introduction
Conclusions References
Tables Figures
◭ ◮
◭ ◮
Back Close
Full Screen / Esc
Printer-friendly Version
Interactive Discussion
Discussion
P
a
per
|
Dis
cussion
P
a
per
|
Discussion
P
a
per
|
Discussio
n
P
a
per
|
atmosphere from ground-based FTIR solar absorption measurements. It behaves bet-ter than OEM and TR from several points of view, but the significance of the improve-ments depends on the target species and on the chosen a priori information. The approach can easily be implemented in the existing retrieval codes that are used in the Infrared Working Group of the NDACC.
5
Acknowledgements. Thanks for financial support are due to the Belgian Federal Science Pol-icy (Ministerial Order MO/35/024, ESAC II and AGACC contracts) and to the PRODEX Office. We also acknowledge the support of the European Commission through the GEOmon (Global Earth Observation and Monitoring) Integrated Project (contract number FP6-2005-Global-4-036677) and through the HYMN (HYdrogen, Methane and Nitrous oxide: trend variability,
bud-10
gets and interactions with the biosphere) project (contract number GOCE-037048) under the 6th Framework Programme.
References
Doicu, A., Hilgers, S., von Bargen, A., Rozanov, A., Eichmann, K.-U., von Savigny, C., and Burrows, J. P.: Information operator approach and iterative regularization
15
methods for atmospheric remote sensing, J. Quant. Spectrosc. Ra., 103, 340–350, doi:10.1016/j.jqsrt.2006.05.002, 2007.
Duflot, V., Dils, B., Baray, J. L., De Mazi `ere, M., Atti ´e, J. L., Vanhaelewyn, G., Senten, C., Vigouroux, C., Clain, G., and Delmas, R.: Analysis of the origin of the distribution of CO in the subtropical southern Indian Ocean in 2007, J. Geophys. Res., 115, D22106,
20
doi:10.1029/2010JD013994, 2010.
Golub, G. H. and Van Loan, C. F.: Matrix computations, The Johns Hopkins University Press, USA, 1983.
Hase, F., Blumenstock, T., and Paton-Walsh, C.: Analysis of the instrumental line shape of high-resolution Fourier transform IR spectrometers with gas cell measurements and new retrieval
25
AMTD
4, 3739–3785, 2011Information operator approach for the inversion of FTIR
spectra
C. Senten et al.
Title Page
Abstract Introduction
Conclusions References
Tables Figures
◭ ◮
◭ ◮
Back Close
Full Screen / Esc
Printer-friendly Version
Interactive Discussion
Discussion
P
a
per
|
Dis
cussion
P
a
per
|
Discussion
P
a
per
|
Discussio
n
P
a
per
|
Hase, F., Hannigan, J. W., Coffey, M. T., Goldman, A., H ¨opfner, M., Jones, N. B., Rins-land, C. P., and Wood, S. W.: Intercomparison of retrieval codes used for the analysis of high-resolution ground-based FTIR measurements, J. Quant. Spectrosc. Ra., 87, 25–52, doi:10.1016/j.jqsrt.2003.12.008, 2004.
Hoogen, R., Rozanov, V. V., and Burrows, J. P.: Ozone profiles from GOME
satel-5
lite data: description and first validation, J. Geophys. Res., 104(D7), 8263–8280, doi:10.1029/1998JD100093, 1999.
Kozlov, V.: Design of Experiments Related to the Inverse Problem of Mathematical Physics (in Russian), in: Mathematical Theory of Experiment Design, edited by: Ermakov, C. M., Nauka, Moscow, 216–246, 1983.
10
Kurylo, M. J. and Solomon, S.: Network for the Detection of Stratospheric Change, NASA Rep, Code EEU, 1990.
Kurylo, M. J.: Network for the detection of stratospheric change (NDSC), SPIE Proceed-ings 1991, Remote Sens. Atmos. Chem., 1491, 168–174, 1991.
Rinsland, C. P., Nicholas, B. J., Connor, B. J., Logan, J. A., Pougatchev, N. S., Goldman,
15
A., Murcray, F. J., Stephen, T. M., Pine, A. S., Zander, R., Mahieu, E., and Demoulin, P.: Northern and southern hemisphere ground-based infrared spectroscopic measurements of tropospheric carbon monoxide and ethane, J. Geophys. Res., 103(D21), 28197–28218, doi:10.1029/98JD02515, 1998.
Rodgers, C. D.: Inverse Methods for Atmospheric Sounding: Theory and Practice, Series on
20
Atmospheric, Oceanic and Planetary Physics, Vol. 2, World Scientific, Singapore, 2000. Rothman, L. S., Gordon, I. E., Barbe, A., Benner, D. C., Bernath, P. F., Birk, M., Boudon, V.,
Brown, L. R., Campargue, A., Champion, J.-P., Chance, K., Coudert, L. H., Danaj, V., Devi, V. M., Fally, S., Flaud, J.-M., Gamache, R. R., Goldmanm, A., Jacquemart, D., Kleiner, I., Lacome, N., Lafferty, W. J., Mandin, J.-Y., Massie, S. T., Mikhailenko, S. N., Miller, C. E.,
25
Moazzen-Ahmadi, N., Naumenko, O. V., Nikitin, A. V., Orphal, J., Perevalov, V. I., Perrin, A., Predoi-Cross, A., Rinsland, C. P., Rotger, M., ˇSimeˇckov ´a, M., Smith, M. A. H., Sung, K., Tashkun, S. A., Tennyson, J., Toth, R. A., Vandaele, A. C., and Vander Auwera, J.: The Hitran 2008 molecular spectroscopic database, J. Quant. Spectrosc. Ra., 110, 533–572, doi:10.1016/j.jqsrt.2009.02.013, 2009.
30
AMTD
4, 3739–3785, 2011Information operator approach for the inversion of FTIR
spectra
C. Senten et al.
Title Page
Abstract Introduction
Conclusions References
Tables Figures
◭ ◮
◭ ◮
Back Close
Full Screen / Esc
Printer-friendly Version
Interactive Discussion
Discussion
P
a
per
|
Dis
cussion
P
a
per
|
Discussion
P
a
per
|
Discussio
n
P
a
per
|
Senten, C., De Mazi `ere, M., Dils, B., Hermans, C., Kruglanski, M., Neefs, E., Scolas, F., Van-daele, A. C., Vanhaelewyn, G., Vigouroux, C., Carleer, M., Coheur, P. F., Fally, S., Barret, B., Baray, J. L., Delmas, R., Leveau, J., Metzger, J. M., Mahieu, E., Boone, C., Walker, K. A., Bernath, P. F., and Strong, K.: Technical Note: New ground-based FTIR measurements at Ile de La R ´eunion: observations, error analysis, and comparisons with independent data,
5
Atmos. Chem. Phys., 8, 3483–3508, doi:10.5194/acp-8-3483-2008, 2008.
Shannon, C. E. and Weaver, W.: The Mathematical Theory of Communication, Univ. of Illinois Press, Urbana, 1949.
Tikhonov, A.: On the solution of incorrectly stated problems and a method of regularization, Dokl. Akad. Nauk SSSR, 151, 501–504, 1963.
10
Vigouroux, C., De Mazi `ere, M., Demoulin, P., Servais, C., Hase, F., Blumenstock, T., Kramer, I., Schneider, M., Mellqvist, J., Strandberg, A., Velazco, V., Notholt, J., Sussmann, R., Stremme, W., Rockmann, A., Gardiner, T., Coleman, M., and Woods, P.: Evaluation of tropospheric and stratospheric ozone trends over Western Europe from ground-based FTIR network observa-tions, Atmos. Chem. Phys., 8, 6865–6886, doi:10.5194/acp-8-6865-2008, 2008.
AMTD
4, 3739–3785, 2011Information operator approach for the inversion of FTIR
spectra
C. Senten et al.
Title Page
Abstract Introduction
Conclusions References
Tables Figures
◭ ◮
◭ ◮
Back Close
Full Screen / Esc
Printer-friendly Version
Interactive Discussion
Discussion
P
a
per
|
Dis
cussion
P
a
per
|
Discussion
P
a
per
|
Discussio
n
P
a
per
|
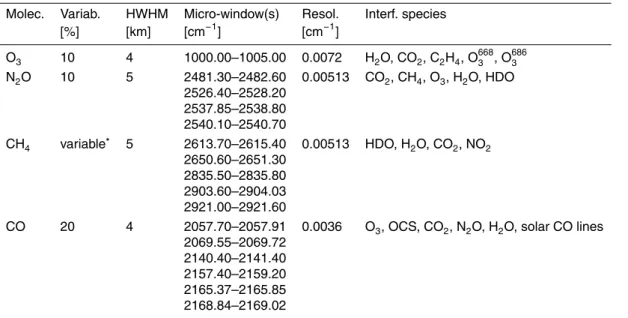
Table 1.Retrieval characteristics for each target species, for the 2007 FTIR campaign at Ile de
La R ´eunion. Variability represents the diagonal elements ofSaand HWHM the applied inter-layer correlation length of a Gaussian probability distribution. The last three columns list the spectral micro-windows that are fitted simultaneously, the associated spectral resolution, and the main interfering species, respectively.
Molec. Variab. HWHM Micro-window(s) Resol. Interf. species
[%] [km] [cm−1
] [cm−1
]
O3 10 4 1000.00–1005.00 0.0072 H2O, CO2, C2H4, O 668 3 , O
686 3 N2O 10 5 2481.30–2482.60 0.00513 CO2, CH4, O3, H2O, HDO
2526.40–2528.20 2537.85–2538.80 2540.10–2540.70 CH4 variable
∗
5 2613.70–2615.40 0.00513 HDO, H2O, CO2, NO2 2650.60–2651.30
2835.50–2835.80 2903.60–2904.03 2921.00–2921.60
CO 20 4 2057.70–2057.91 0.0036 O3, OCS, CO2, N2O, H2O, solar CO lines 2069.55–2069.72
2140.40–2141.40 2157.40–2159.20 2165.37–2165.85 2168.84–2169.02
∗
AMTD
4, 3739–3785, 2011Information operator approach for the inversion of FTIR
spectra
C. Senten et al.
Title Page
Abstract Introduction
Conclusions References
Tables Figures
◭ ◮
◭ ◮
Back Close
Full Screen / Esc
Printer-friendly Version
Interactive Discussion
Discussion
P
a
per
|
Dis
cussion
P
a
per
|
Discussion
P
a
per
|
Discussio
n
P
a
per
|
Table 2.Evolution of 1/2 ln (1+λr,n) andλr,n/(1+λr,n) for the largest 24 eigenvaluesλr,n of the
Kozlov information matrixPr, for O3, N2O, CH4and CO.
O3 N2O CH4 CO
n 1/2 ln (1+λr,n) λr,n/(1+λr,n) 1/2 ln (1+λr,n) λr,n/(1+λr,n) 1/2 ln (1+λr,n) λr,n/(1+λr,n) 1/2 ln (1+λr,n) λr,n/(1+λr,n)
AMTD
4, 3739–3785, 2011Information operator approach for the inversion of FTIR
spectra
C. Senten et al.
Title Page
Abstract Introduction
Conclusions References
Tables Figures
◭ ◮
◭ ◮
Back Close
Full Screen / Esc
Printer-friendly Version
Interactive Discussion
Discussion
P
a
per
|
Dis
cussion
P
a
per
|
Discussion
P
a
per
|
Discussio
n
P
a
per
|
Table 3.Date, OBP and SZA of the reference spectra for O3, N2O, CH4 and CO measured at
Ile de La R ´eunion in 2007, together with the RMS of the fit residual, DOFS and independent PC limits when using the OEM, IOA and – for O3and CH4– TR.
Molec. Date OBP [cm−1] SZA Meth. RMS DOFS PC limits [km]
O3 12/09 600–1400 51.83 OEM 1.01 4.68 0.05–7.0–19.0–26.2–100 IOA 1.02 3.92 0.05–9.4–21.4–29.8–100 TR 1.01 4.64 0.05–7.0–19.0–27.4–100 N2O 08/10 2400–3310 42.03 OEM 0.18 3.35 0.05–4.6–13.0–100
IOA 0.19 2.87 0.05–5.8–15.4–100 CH4 02/10 2400–3310 46.43 OEM 0.29 2.32 0.05–8.2–100
IOA 0.30 2.06 0.05–9.4–100 TR 0.30 2.29 0.05–9.4–100 CO 29/07 1850–2750 42.19 OEM 0.39 3.04 0.05–2.6–9.4–100
AMTD
4, 3739–3785, 2011Information operator approach for the inversion of FTIR
spectra
C. Senten et al.
Title Page
Abstract Introduction
Conclusions References
Tables Figures
◭ ◮
◭ ◮
Back Close
Full Screen / Esc
Printer-friendly Version
Interactive Discussion
Discussion
P
a
per
|
Dis
cussion
P
a
per
|
Discussion
P
a
per
|
Discussio
n
P
a
per
|
Table 4. Mean RMS of the fit residual, mean ITER, mean DOFS, total altitude range and
common independent PC ranges, mean CA, and mean daily relative STD on the CA for the retrievals of O3, N2O, CH4and CO, from the 2007 campaign data at Ile de La R ´eunion, when using the OEM, IOA and – for O3and CH4– TR.
Molec. RMS ITER DOFS Alt. range CA [1018molec cm−2
] STD [%] OEM/IOA/TR OEM/IOA/TR OEM/IOA/TR [km] OEM/IOA/TR OEM/IOA/TR
O3 0.86/0.87/0.86 7/7/7 4.6/3.9/4.6 0.05–100 7.90/7.90/7.90 0.32/0.35/0.31 0.05–9.4 0.74/0.72/0.74 0.90/0.99/0.89 9.4–21.4 1.33/1.32/1.34 0.98/1.38/0.99 21.4–29.8 3.84/3.87/3.83 0.57/0.61/0.54 29.8–100 1.99/1.98/1.99 0.88/1.02/0.74
N2O 0.15/0.15 9/5 3.1/2.9 0.05–100 6.67/6.66 0.060/0.058 0.05–5.8 3.48/3.43 0.29/0.16 5.8–15.4 2.54/2.59 0.37/0.19 15.4–100 0.64/0.64 0.53/0.24
CH4 0.29/0.28/0.28 9/6/6 2.2/2.1/2.3 0.05–100 36.5/37.1/36.9 0.48/0.29/0.22 0.05–9.4 25.1/25.8/25.5 0.41/0.72/0.30 9.4–100 11.4/11.3/11.4 1.01/0.73/0.28
AMTD
4, 3739–3785, 2011Information operator approach for the inversion of FTIR
spectra
C. Senten et al.
Title Page
Abstract Introduction
Conclusions References
Tables Figures
◭ ◮
◭ ◮
Back Close
Full Screen / Esc
Printer-friendly Version
Interactive Discussion
Discussion
P
a
per
|
Dis
cussion
P
a
per
|
Discussion
P
a
per
|
Discussio
n
P
a
per
|
Table 5. Smoothing error, total random error without the smoothing error contribution, total
random error, total systematic error and total error on the retrieved total and partial columns of O3, N2O, CH4and CO, at Ile de La R ´eunion in 2007, when using the OEM, IOA and – for O3 and CH4– TR.
Molec. Alt. range Smooth. [%] Total rand. without Total rand. [%] Total syst. [%] Total [%]
[km] smoothing error [%]
OEM/IOA/TR OEM/IOA/TR OEM/IOA/TR OEM/IOA/TR OEM/IOA/TR
O3 0.05–100 0.44/0.54/0.51 0.80/0.62/0.81 0.91/0.83/0.96 2.54/1.71/2.84 2.70/1.90/3.00
0.05–9.4 6.70/9.06/7.14 1.62/1.39/1.55 6.90/9.17/7.30 14.32/12.48/14.18 15.89/15.49/15.94 9.4–21.4 9.05/10.71/10.31 3.35/2.26/2.91 9.65/10.94/10.71 27.20/13.76/23.77 28.86/17.58/26.07 21.4–29.8 5.56/7.58/6.70 3.12/1.75/2.52 6.38/7.78/7.16 21.89/7.84/17.41 22.80/11.05/18.82 29.8–100 5.03/6.57/6.34 2.48/2.03/2.02 5.61/6.88/6.65 13.83/7.75/9.75 14.93/10.36/11.81
N2O 0.05–100 0.10/0.27 0.49/0.35 0.50/0.44 2.49/2.64 2.54/2.68
0.05–5.8 0.55/1.36 1.05/0.64 1.18/1.50 5.41/4.77 5.53/5.00
5.8–15.4 0.72/2.18 1.33/0.56 1.51/2.25 5.26/5.11 5.48/5.59
15.4–100 1.39/4.84 2.85/1.51 3.17/5.07 12.61/5.56 13.00/7.53
CH4 0.05–100 0.22/1.09/0.31 0.95/0.97/0.93 0.98/1.46/0.98 4.83/7.28/5.21 4.93/7.42/5.30
0.05–9.4 0.41/2.29/0.64 1.08/0.94/0.97 1.16/2.48/1.16 7.54/7.48/7.72 7.63/7.88/7.81 9.4–100 0.60/2.91/0.61 1.50/1.09/1.46 1.61/3.10/1.59 7.85/6.87/8.16 8.01/7.54/8.32
CO 0.05–100 0.15/0.15 1.29/1.22 1.30/1.23 3.52/2.88 3.75/3.13
0.05–2.6 1.92/2.45 4.37/3.76 4.78/4.49 30.16/24.14 30.54/24.56
2.6–9.4 2.22/2.67 2.20/2.15 3.13/3.43 35.92/27.31 36.05/27.53
AMTD
4, 3739–3785, 2011Information operator approach for the inversion of FTIR
spectra
C. Senten et al.
Title Page
Abstract Introduction
Conclusions References
Tables Figures
◭ ◮
◭ ◮
Back Close
Full Screen / Esc
Printer-friendly Version
Interactive Discussion
Discussion
P
a
per
|
Dis
cussion
P
a
per
|
Discussion
P
a
per
|
Discussio
n
P
a
per
|
Table 6.Impact of different choices ofSaon the O3total and partial columns retrieved with the
OEM, IOA and TR, for the 2007 campaign data at Ile de La R ´eunion: mean daily relative STD and mean relative biases with respect to the retrieval with 10 %Sa.
Alt. range STD [%] 10 %Sa STD [%] 40 %Sa Bias [%] 40 %Sa STD [%] 80 %Sa Bias [%] 80 %Sa
[km] OEM/IOA/TR OEM/IOA/TR OEM/IOA/TR OEM/IOA/TR OEM/IOA/TR