Perspective
Antarctica’s Protected Areas Are Inadequate,
Unrepresentative, and at Risk
Justine D. Shaw1,2*, Aleks Terauds2, Martin J. Riddle2, Hugh P. Possingham1, Steven L. Chown3
1School of Biological Sciences, The University of Queensland, St. Lucia, Queensland, Australia,2Terrestrial and Nearshore Ecosystems, Australian Antarctic Division, Department of the Environment, Kingston, Tasmania, Australia,3School of Biological Sciences, Monash University, Clayton, Victoria, Australia
Abstract: Antarctica is widely re-garded as one of the planet’s last true wildernesses, insulated from threat by its remoteness and dec-laration as a natural reserve dedi-cated to peace and science. How-ever, rapidly growing human activity is accelerating threats to biodiversity. We determined how well the existing protected-area system represents terrestrial biodi-versity and assessed the risk to protected areas from biological invasions, the region’s most signif-icant conservation threat. We found that Antarctica is one of the planet’s least protected regions, with only 1.5% of its ice-free area formally designated as specially protected areas. Five of the distinct ice-free ecoregions have no spe-cially designated areas for the protection of biodiversity. Every one of the 55 designated areas that protect Antarctica’s biodiversi-ty lies closer to sites of high human activity than expected by chance, and seven lie in high-risk areas for biological invasions. By any mea-sure, including Aichi Target 11 under the Convention on Biological Diversity, Antarctic biodiversity is poorly protected by reserves, and those reserves are threatened.
Introduction
With no permanent human settlements and science and tourism as the only land-based industries, Antarctica is under lower direct human pressure than any other continent. Its landscapes are recog-nized globally as the most pristine [1,2] and can rightly be regarded part of the ‘‘last of the wild’’ [3]. Under the Antarctic
Treaty System (ATS), through which the region is governed [4], the whole conti-nent has been designated a ‘‘natural reserve, devoted to peace and science’’ [5]. Annex V of the Protocol on Environmental Protection to the Antarctic Treaty (Madrid Protocol) also makes provision for special protection of areas. Currently, 73 such Antarctic Specially Protected Areas (ASPAs) have been designated under nine categories (Table S1) representing their cultural, physical, or ecological values. Conse-quently, it is widely believed that the terrestrial Antarctic is more than ade-quately protected [6,7]. In this perspec-tive, we provide evidence that shows this is not the case.
Why Protect Terrestrial Antarctica?
The majority of Antarctica’s biodiver-sity is concentrated in ice-free areas. While there is life outside of these areas [8,9], biodiversity and human activity are much higher within them. For these reasons, we focus on the protection of ice-free environments. Threats to the ecological integrity of Antarctica are accelerating because of a growing varie-ty, intensivarie-ty, and frequency of human activities and rapidly changing climates or forecasts for such change [10–12]. Biological invasions are most significant,
with several established populations al-ready having a variety of observed impacts [13–15]. Human activities in Antarctica typically take two forms: the activities of National Antarctic Programs (i.e., scientists and their support person-nel) and those that take place as part of fee-paying recreation (i.e., tourists and their support personnel). Activities asso-ciated with science include construction of buildings, roads, fuel depots, and runways. Growing instances of uninten-tional damage are also being recorded, such as the establishment of harmful nonindigenous species, sewage spills, point source pollution, and destruction of vegetation [13,16–19]. All human activities, be they tourism- or science-related, have increased considerably over the last 20 years and are predicted to continue to do so [20].
Protected areas are generally effective in reducing threats to biodiversity and regarded as the cornerstone of conser-vation [21]. Their efficacy is enhanced substantially when they are representa-tive of the biodiversity of a region [22]. This is recognised by the Strategic Plan for Biodiversity 2011–2020, which has set 17% of terrestrial land area protect-ed as the most recent target (Aichi Target 11) [23]. The Madrid Protocol likewise recognizes the significance of representative protected areas, calling
The Perspective section provides experts with a forum to comment on topical or controversial issues of broad interest.
Citation:Shaw JD, Terauds A, Riddle MJ, Possingham HP, Chown SL (2014) Antarctica’s Protected Areas Are Inadequate, Unrepresentative, and at Risk. PLoS Biol 12(6): e1001888. doi:10.1371/journal.pbio.1001888 PublishedJune 17, 2014
Copyright: ß2014 Shaw et al. This is an open-access article distributed under the terms of the Creative Commons Attribution License, which permits unrestricted use, distribution, and reproduction in any medium, provided the original author and source are credited.
Funding:This work was supported by the Environmental Decision Hub (National Environment Research Program Australia) and Australian Antarctic Science Project 4024. The funders had no role in study design, data collection and analysis, decision to publish, or preparation of the manuscript.
Competing Interests:The authors have declared that no competing interests exist.
Abbreviations:ACBR, Antarctic Conservation Biogeographic Region; ASPA, Antarctic Specially Protected Area; ATS, Antarctic Treaty System; CBD, Convention on Biological Diversity.
for ASPAs to be identified ‘‘within a systematic environmental-geographic frame-work’’ and include ‘‘representative examples of major…ecosystems’’ [24].
Given that conservation threats to terrestrial Antarctica are growing, that protected areas are a cornerstone of conservation, and that a network of specially protected areas is already con-sidered a key tool in the conservation management of Antarctica, we assess the effectiveness of this network in a contem-porary global context. How representative is this network and, compared with other areas of Antarctica, how high are the risks to the network of nonindigenous species invasion, which at present pose the greatest conservation threat to the region [2,25]?
Our assessment was conducted in three steps. We quantified the proportion of ice-free land that is protected, as this is where the majority of Antarctic biodiversity occurs; examined its representativeness using recently developed protected-area assessment metrics [26]; and quantified the level of threat these protected areas face from biological invasion using infor-mation from a recent, spatially explicit risk assessment (see Methods S1 for details of data sources and analytical methods) [25].
Antarctic Protection Relative to Other Continents
Antarctica’s ice-free area is 46,253 km2, of which only 1.5% is formally designated as a protected area for the purposes of
terrestrial biodiversity conservation (688 km2). Fifty-five ASPAs have been designated in ice-free areas for their biodiversity values (Figure 1; Tables S1, S2), while a further 18 ASPAs (not considered here) conserve other values, such as historic sites or geologically important features, that are of concern to the ATS [5]. The mean protected area of each Antarctic Conservation Biogeo-graphic Region (ACBR), the equivalent of ecoregions elsewhere (Figure 1) [27], is 1.1%, and no ACBR has 10% or more of its area designated as protected area (range: 0% to 6%; Table S3). In a global context, on a country-comparison basis, Antarctica lies in the lowest quartile for total percentage protection (Figure 2A), mean protected area of each ecoregion, and number of ecoregions with 10% of protection (Figure S1). By any measure, including recently agreed-upon Aichi Target 11, this level of protection is inadequate. While Antarctica ranks in the second-highest quartile for protection equality (Figure 2B) (i.e., the adapted Gini coefficient of Barr et al. [26]), detailed examination of ecoregional protection reveals a less optimistic situation. Five of the fifteen Antarctic ecoregions are not represented in the current portfolio of ASPAs designated for the protection of biodiversity (Figure 1) and two contain most of the protected areas (17 and 10, respectively), representing 74% (503 km2) of all ice-free ASPAs designated for the protection of biodiversity. Combining total percentage protection with a protec-tion equality metric, as previously recom-mended but not implemented globally [26], provides an integrated protection metric by which Antarctica is ranked in the lowest quartile of countries large enough to assess, placed 69th (out of 84), between Mali and Kazakhstan (Figure 2C).
Protected Areas at Risk of Invasion
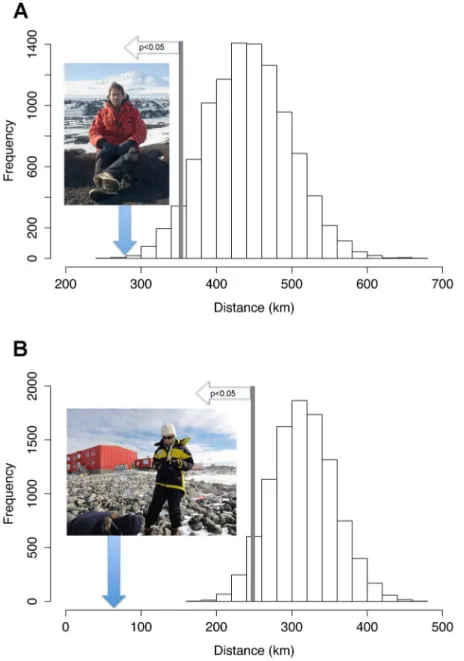
In terms of risk, the mean distances of ASPAs to tourist landing sites and scientific activity (i.e., established scientific facilities) are 289 km (range: 0 km to 2406 km) and 64 km (range: 0 km to 832 km), respectively, significantly closer than expected for the same number of randomly selected ice-free sites (Figure 3). Seven of the 55 ASPAs, all of which are on the Antarctic Peninsula, are at high risk of nonindigenous species establishment (Figure S2) (risk exceeds 50%, according to Chown et al. [25]), overlapping with high-risk areas for nonindigenous
Figure 1. Location of Antarctic Specially Protected Areas (ASPAs) and Antarctic Conservation Biogeographic Regions (ACBRs). Red circles indicate ice-free ASPAs that protect terrestrial biodiversity, and yellow circles are ASPAs that are not ice-free or do not support terrestrial biodiversity, and therefore were not used in the analyses. Coloured areas represent ice-free land; different colours denote the ACBRs (see [27]).
species establishment identified previously [25]. Overall, the mean risk index of establishment of nonindigenous species for ASPAs is 12% (standard error 65%), significantly higher (by 24 times) than the mean risk for a randomly selected set of ice-free locations (0.5%60.1%,x2= 86.1, p,0.0001).
A Natural Reserve, Devoted to Peace and Science?
In a global context, the designation of Antarctica as ‘‘a natural reserve, devoted to peace and science’’ under the ATS is unique; no other continent has a similar level of apparent protection [6]. This situation
may be at least partly responsible for Antarctica’s repeated exclusion from glob-al assessments of protected-area effective-ness [26,28,29]. However, its apparent protection status reflects management intent, not management outcome [30]. Although the Antarctic environment is less utilised and populated than others, activ-ities permitted on the continent (e.g., road and building construction, vehicle traffic, waste disposal) are having substantial impacts on biodiversity [12,18,19].
Aichi Target 11 of the Strategic Plan for Biodiversity 2011–2020 [23] aims for ‘‘at least 17% of terrestrial and inland water areas’’ to be protected to ensure conservation of biodiversity. Globally, 13% of terrestrial areas are protected [31]. By comparison, only 1.5% of ice-free terrestrial Antarctica (0.005% of the total continental area) is formally protected for the purposes of biodiversity conservation. Aichi Target 11 also calls for the global protected-area network to be ecologically representative. Again, Antarctica fails to meet this bench-mark.
In addition to representing the biodi-versity of a given region, protected areas should also safeguard biodiversity from threatening processes [32]. In Antarc-tica, however, protected areas are sig-nificantly closer to sites of human activity than would be expected by chance. This is partly a product of the history of protected-area designation. Such proximity elevates threat, given that human population density adjacent to protected areas is the most significant predictor of their invasive species rich-ness, both in the broader Antarctic region [33] and elsewhere [34]. More-over, two of the ASPAs at high risk of invasion already support nonindigneous species [14,35].
The Way Forward
Antarctic terrestrial biodiversity is con-centrated in the continent’s relatively small and fragmented ice-free areas. Increasing human activity and risk to biodiversity is also concentrated in these areas, and the total area accorded the additional protec-tion conferred by ASPA status is small. Of the 73 ASPAs, only 55 (688 km2) occur in ice-free areas and have recognised terres-trial biodiversity values. In consequence, while there is a widespread general per-ception that Antarctica is well conserved, in practice conservation of terrestrial bio-diversity from a continent-wide perspec-tive is poorly served by the protected-area system. Therefore, what is required now is a systematic network designed to best
Figure 2. Three measures of protected-area coverage of 83 countries and Antarctica.
(A) Total percentage of land protected, (B) protection equality (adapted Gini-coefficient), and (C) integrated protection (the product of A and B). Countries are classified into different coloured quartiles: green = highest quartile, yellow = second highest quartile, orange = second lowest quartile, and red = lowest quartile.
conserve the biodiversity of Antarctica as a whole. Once a protected area is designated and human activity restricted, manage-ment efforts are relatively minimal com-pared to protected-area management re-quirements globally [36]. Parties to the Convention on Biological Diversity (CBD)
have agreed to improve global protection of biodiversity by encouraging nations to meet the Aichi Targets by 2020. Although Antarctica is excluded from the provisions of the CBD, we believe that the Aichi Targets should be met for the region. For a continent that is so little impacted by
human activity compared with the rest of the planet, achieving an objective that has already been attained by several nations should be straightforward for those who manage the region under the Antarctic Treaty System.
Acknowledgments
We are grateful for constructive com-ments from P. Convey (British Antarctic Survey), R. Fuller (University of Queens-land), and M. A. McGeoch (Monash University). Data utilised in these analyses are contained in the Supporting Informa-tion, or the sources referenced therein.
Supporting Information
Figure S1 Two measures of pro-tected-area coverage of 83 countries and Antarctica. (A) Mean percentage protection of ecoregions and (B) per-centage of ecoregions with at least 10% protection. We divided the scores of all countries into quartiles for each measure and assigned colours to each quartile: green = highest quartile, yellow = second highest quartile, orange = second lowest quartile, and red = lowest quartile.
(PDF)
Figure S2 Continent-wide risk of establishment of nonindigenous species and high-risk ASPAs. (See Chown et al. [25] for details of risk index). Inset shows location of ASPAs overlaid on risk index cells with values .0 for the Antarctic Peninsula region.
(PDF)
Table S1 Designation of ASPAs and their invasion risk.Designations from Antarctic Protected Areas Database, Sec-retariat of the Antarctic Treaty, http:// www.ats.aq/devPH/apa/ep_protected_ detail.aspx?type = 2&id = 69&lang = e. (DOCX)
Table S2 Ice-free ASPAs that have designations related to the protec-tion of terrestrial biodiversity.
(DOCX)
Table S3 Overlap of ice-free, biodiversity-designated ASPAs and ACBRs.
(DOCX)
Methods S1 Supporting methods.
(DOCX)
Figure 3. Graphical comparisons of bootstrapped data (histogram) and actual mean distances (image with blue arrow).(A) Distance of ASPAs to tourist landings. Image credit: Aleks Terauds. (B) Distance of ASPAs to landings associated with national programs. Image credit: Dana Bergstrom. Histograms show frequency distribution of 10,000 by means of 55 locations sampled from 1,000 randomly generated, spatial, ice-free locations. Mean distances to ASPAs for both tourists and scientists are well outside the fifth percentile of the histogram (p,0.05), indicating that visitor landings are significantly closer to ASPAs than would be expected by chance.
References
1. Cressey D (2012) Antarctic seas in the balance. Nature 490: 324.
2. Chown SL, Lee JE, Hughes KA, Barnes J, Barrett PJ, et al. (2012) Challenges to the Future Conser-vation of the Antarctic. Science 337: 158–159. 3. Sanderson EW, Jaiteh M, Levy MA, Redford KH,
Wannebo AV, et al. (2002) The human footprint and the last of the wild. BioSci 52: 891–904. 4. Berkman PA, Lang MA, Walton DWH, Young
OR, editors (2011) Science Diplomacy. Antarc-tica, Science, and the Governance of Internation-al Spaces.. Washington D.C: Smithsonian Insti-tution Scholarly Press. 337 p.
5. Anon. (1991) Protocol on Environmental Protec-tion to the Antarctic Treaty. Antarctic Treaty Consultative Meeting XVI, 7 - 18 Oct 1991, Bonn, Germany. Available: http://www.ats.aq/ documents/recatt/Att006_e.pdf. Accessed 14 May 2014.
6. Chape S, Harrison J, Spalding M, Lysenko I (2005) Measuring the extent and effectiveness of protected areas as an indicator for meeting global biodiversity targets. Philos Trans R Soc Lond B Biol Sci 360: 443–455.
7. Haward M, Jabour J, Press AJ (2012) Antarctic Treaty System ready for a challenge. Science 338: 603.
8. Broady PA (1996) Diversity, distribution and dispersal of Antarctic terrestrial algae. Biodivers Conserv 5: 1307–1335.
9. Porazinska DL, Fountain AG, Nylen TH, Vir-ginia RA, Wall DH (2007) The biodiversity and biogeochemistry of cryoconite holes from McMurdo Dry Valley glaciers, Antarctica. Arct Antarct Alp Res 36: 84–91.
10. Hughes KA, Convey P (2010) The protection of Antarctic terrestrial ecosystems from inter- and intra-continental transfer of non-indigenous spe-cies by human activities: A review of current systems and practices. Glob Environ Change 20: 96–112.
11. Hughes KA, Pertierra LR, Walton DWH (2013) Area protection in Antarctica: How can conservation and scientific research goals be managed compatibly? Environ Sci Policy 31: 120–132.
12. Tin T, Liggett D, Maher PT, Lamers M, editors (2014) Antarctic futures. Human engagement with the Antarctic environment. Dordrecht: Springer. 380 p.
13. Frenot Y, Chown SL, Whinam J, Selkirk PM, Convey P, et al. (2005) Biological invasions in the Antarctic: extent, impacts and implications. Biol Rev 80: 45–72.
14. Molina-Montenegro MA, Carrasco-Urra F, Ro-drigo C, Convey P, Valladares F, et al. (2012) Occurrence of the non-native annual bluegrass on the Antarctic mainland and its negative effects on native plants. Conserv Biol 26: 1–7.
15. Hughes KA, Worland MR, Thorne MAS, Convey P (2013) The non-native chironomid Eretmoptera murphyi in Antarctica: erosion of the barriers to invasion. Biol Inv 15: 269– 281.
16. Campbell IB, Claridge GGC, Balks MR (1998) Short- and long-term impacts of human distur-bances on snow-free surfaces in Antarctica. Polar Rec 34: 15–24.
17. Kerry KR, Riddle MJ (2009) Health of Antarctic wildlife: a challenge for science and policy. London: Springer. 407 p.
18. Tin T, Fleming ZL, Hughes KA, Ainley DG, Convey P, et al. (2009) Impacts of local human activities on the Antarctic environment. Antarct Sci 21: 3–33.
19. Peter H-U, Braun C, Janowski S, Nordt A, Nordt A, et al. (2013) The current environmental situation and proposals for the management of the Fildes Peninsula Region. Federal Envir-onment Agency, Germany. Available: http:// www.umweltbundesamt.de/publikationen/ aktuelle-umweltsituation-vorschlaege-management. Accessed 14 May 2014.
20. Tin T, Lamers M, Liggett D, Maher PT, Hughes KA (2014) Setting the scene: human activities, environmental impacts and governance arrange-ments in Antarctica. In: Tin T, Liggett D, Maher PT, Lamers M, editors.Antarctic futures: human engagement with the Antarctic environment.Dor-Dordrecht: Springer. pp. 1–24.
21. Rodrigues ASL, Andelman SJ, Bakaar MI, Boitani L, Brooks TM, et al. (2004) Effectiveness of the global protected area network in repre-senting species diversity. Nature 428: 640–643. 22. Moilanen A, Wilson KA, Possingham HP, editors
(2009) Spatial Conservation Prioritization. Quan-titative Methods and Computational Tools. Oxford: Oxford University Press. 304 p. 23. UNEP (2010) Decision adopted by the
Confer-ence of the Parties to the Convention on Biological Diversity at its Tenth Meeting. X/2. The Strategic Plan for Biodiversity 2011–2020 and the Aichi Biodiversity Targets. United National Environment Programme Convention on Biological Diversity. UNEP/CBD/COP/ DEC/X/2, Nagoya. Available: http://www.cbd. int/sp/targets/. Accessed 14 May 2014. 24. Anon. (1991) Annex V to the Protocol on
Environmental Protection to the Antarctic
Trea-ty. Area Protection and Management. Antarctic Treaty Consultative Meeting XVI, 7 - 18 Oct 1991, Bonn, Germany. Available: http://www. ats.aq/documents/recatt/att004_e.pdf. Accessed 14 May 2014.
25. Chown SL, Huiskes AHL, Gremmen NJM, Lee JE, Terauds A, et al. (2012) Continent-wide risk assessment for the establishment of nonindige-nous species in Antarctica. Proc Natl Acad Sci U S A 109: 4938–4943.
26. Barr LM, Pressey RL, Fuller RA, Segan DB, McDonald-Madden E, et al. (2012) A new way to measure the world’s protected area coverage. PLoS ONE 6: e24707. doi:10.1371/journal.-pone.0024707
27. Terauds A, Chown SL, Morgan F, Peat HJ, Watts D, et al. (2012) Conservation biogeo-graphy of the Antarctic. Divers Distrib 18: 726– 741.
28. Jenkins CN, Joppa L (2009) Expansion of the global terrestrial protected area system. Biol Conserv 142: 2166–2174.
29. Hulme PE, Pysek P, Pergl J, Jarosil V, Schaffner U, et al. (2013) Greater focus needed on alien plant impacts in protected areas. Conserv Letters. E-pub ahead of print. doi:10.1111/conl.12061 30. Boitani L, Cowling RM, Dublin HT, Mace GM,
Parrish J, et al. (2008) Change the IUCN Protected Area categories to reflect biodiversity outcomes. PLoS Biol 6: e66. doi:10.1371/jour-nal.pbio.0060066
31. Bertzky B, Corrigan C, Kenney S, Ravilious C, Besancon C, et al. (2012) Protected Planet Report 2012: Tracking progress towards global targets for protected areas. Gland: IUCN, Cambridge: UNEP-WCMC. 68 p.
32. Gaston KJ, Jackson SF, Cantu-Salazar L, Cruz-Pinon G (2008) The ecological performance of protected areas. Annu Rev Ecol Evol Syst 39: 93– 113.
33. Chown SL, Gremmen NJM, Gaston KJ (1998) Ecological biogeography of Southern Ocean Islands: species area relationships, human impacts and conservation. Am Nat 152: 562–575. 34. Spear D, Foxcroft LC, Bezuidenhout H,
McGeoch MA (2013) Human population density explains alien species richness in protected areas. Biol Conserv 159: 137–147.
35. Pertierra LR, Lara F, Benayas J, Hughes KA (2013) Poa pratensis L., current status of the longest-established non-native vascular plant in the Antarctic. Polar Biol 36: 1473–1481. 36. Le Saout S, Hoffman M, Shi Y, Hughes A, Bernard