Annales
Geophysicae
Temporal evolution of thermal structures and winter heat content
change from VOS-XBT data in the central Mediterranean Sea
V. Kovaˇcevi´c1, M. Gaˇci´c1, G. Fusco2, and V. Cardin1
1OGS, Istituto Nazionale di Oceanografia e di Geofisica Sperimentale, Trieste, Italy 2ENEA, Marine Environmental Research Centre, La Spezia, Italy
Received: 6 September 2001 – Revised: 29 March 2002 – Accepted: 14 May 2002
Abstract. Seasonal and year-to-year time evolution of the
thermal structure, including the heat content change in the upper water column and its relationship with the surface net heat fluxes, have been studied at five locations in the cen-tral Mediterranean Sea. The study is based on temperature profiles collected during XBT surveys (eXpendable Bathy-Thermograph) carried out on ships of opportunity, in the framework of the MFSPP (Mediterranean Forecasting Sys-tem Pilot Project), between SepSys-tember 1999 and May 2001. The five investigated zones are located in the southern Adri-atic, NW Ionian, southern and northern Tyrrhenian, and Lig-urian Sea. Gradual erosion of the thermocline in autumn, formation of a mixed layer in winter, and the onset of the stratification in spring, are common properties of the tempo-ral evolution of thermal structures at all five locations. More-over, in the southern Adriatic, a deep convection took place down to about 600 m in winter 1999/2000. On the other hand, mild climatic conditions and small surface heat loss in autumn and winter 2000/2001 drastically reduced a mix-ing/convection depth which hardly reached 200 m. Simulta-neously, the NW Ionian remained slightly stratified through-out the winter period. The heat storage rate in the upper por-tion of the water column (down to 450 m) is compared with the air-sea net heat flux at a monthly scale. A heat content decrease is determined by the surface heat loss, and the pro-cesses such as lateral advection, or upwelling of the colder waters through the base of the water column (for example, in the southern Adriatic and Ionian Seas). Elsewhere (for example, in the northern Tyrrhenian and Ligurian Seas), the upwelling does not contribute significantly to the heat bal-ance within the water column, since the vertical temperature gradients in deeper layers are negligible.
Key words. Oceanography: general (climate and
interan-nual variability; descriptive and regional oceanography) –
Correspondence to:V. Kovaˇcevi´c ([email protected])
Oceanography: physical (air-sea interactions)
1 Introduction
A ship-of-opportunity programme developed in the frame-work of the MFSPP enabled us to collect XBT profiles in the Mediterranean Sea, on monthly and bi-weekly time scales, starting from September 1999 (Manzella et al., 2001). These temperature data gave us the opportunity to study both a long-term and a short-term thermal variability of the upper layer.
The phenomenology and the preliminary overview of the thermal evolution from all XBT data in the Mediterranean upper layer, discussed in relation with previous knowledge, are extensively reported in the paper by Fusco et al. (2003).
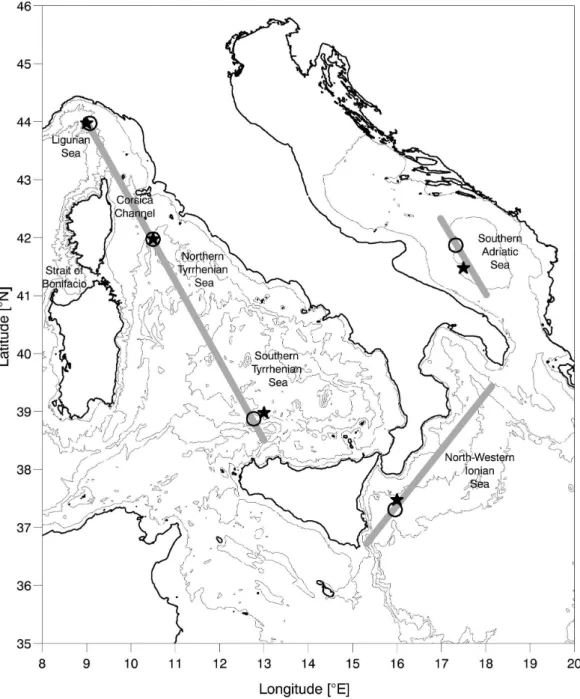
Fig. 1.The bathymetric map of the study area. Light grey strips denote the tracks of XBT deployments. Open circles denote single locations of the XBT temperature profiles representing the five study zones. Asterisks are the grid nodes with ECMWF meteorological data used for the calculation of the air-sea heat fluxes.
This paper aims to describe the evolution of the thermal structure in the seas surrounding the Appeninian peninsula, and to relate its variability to the most important forcing mechanism, i.e. surface heat fluxes. In addition, character-istics of such a relationship are discussed as a function of different geographical areas taken into consideration.
Since the data collection for the southern Adriatic and NW Ionian Seas continued until summer 2001, the ther-mal structures for the two successive winters (1999/2000 and 2000/2001) are compared and the differences are at-tributed to varying climatic conditions.
2 Data and methods
The XBT measurements used for the present analysis belong to a data set, which was gathered following common proto-cols for data collection, transmission and control (Manzella et al., 2001), adopted by all participants of the MFSPP pro-gramme. Quality checks, including an assessment of the overall consistency of the data, were performed by Fusco et al. (2003).
The temperatures were measured at approximately 0.7 m intervals along the vertical. The maximum depth is different, due to different XBT probes employed in the Adriatic and Ionian Seas (with a depth range down to 760 m), from those in the Tyrrhenian and Ligurian Seas (maximum depth range down to 460 m). The nominal accuracy of the XBT probes is 0.1◦C.
The data collected along the tracks in the Ligurian and Tyrrhenian Seas span the time interval between Septem-ber 1999 and DecemSeptem-ber 2000. The original raw data were sub-sampled at each meter. Those collected along the tracks in the NW Ionian and in the southern Adriatic Seas extend until May 2001. The latter profiles are treated by a mov-ing average over 9 successive data for smoothmov-ing, and sub-sequently sub-sampled at each meter. The XBT cruises were carried out once a month from September through Novem-ber 1999, and twice a month from DecemNovem-ber 1999 to mid-June 2000. The surveys were interrupted for three months during summer 2000. In September 2000 they continued with a monthly sampling rate.
The temperature profilesT (z)are used for estimating the relative heat storageH S(J/m2) in the layer between depths H1andH2, with respect to a reference temperatureT0using
the expression according to Hecht (1985):
H S=
−H1
Z
−H2
cpρ[T −T0]dz , (1)
whereH1is a common minimum depth conventionally set to
5 m, andH2is a common maximum depth. The heat
con-tent change between the two succeeding XBT surveys, i.e. the rate of the heat storage, is balanced essentially by the following terms: a gain or a loss of the heat to the atmo-sphere (Qnet), advective processes, processes of vertical
en-trainment, and both horizontal and vertical diffusion and tur-bulence. One of the ways of parameterizing this balance is, according to Artegiani et al. (1997):
∂H S
∂t =Qnet−ν· ∇(H S)−KH∇
2(H S)
+w H S
z=−H−KV cpρ ∂T /∂z
z=−H . (2)
A number of papers deal with the upper ocean heat balance and the processes which influence its variability at various time and spatial scales. One of the most detailed studies is dedicated to the western equatorial Pacific, where a complex experiment involving measurements of both atmospheric and ocean parameters enabled estimation of various components
of a heat balance, and quantification of their influence on a heat content change (for instance, Cronin and McPhaden, 1997; Richards and Inall, 2000) at time scales of the order of a week.
In our study, the heat content change(H S)2−(H S)1, i.e.
the heat storage rate is determined from the temperature pro-files at single locations from the surveys executed at timest2
andt1as follows:
(H S)2−(H S)1/ (t2−t1)
=
t2
Z
t1
Qnetdt
/ (t2−t1)+Qres. (3)
The total heat fluxR
Qnetdtin the time interval (t1, t2) is
de-termined from the meteorological data of the ECMWF opera-tional analysis (European Center for Medium-range Weather Forecast, Reading, UK). The data are available at time-steps of six hours, with a spatial resolution of 0.5◦in latitude and longitude. Surface fields of wind velocity components (at 10 m above the surface), skin temperature, relative humidity, cloudiness, air-pressure, air temperature and dew point tem-perature (the latter two referred to a 2 m height) at the grid-node nearest to the XBT location are used for calculating the terms of the heat balance: solar radiationQS, long-wave
ra-diationQB, sensible heat fluxQH, and latent heat fluxQE,
using bulk expressions from May (1986), Schiano (1996), Artegiani et al. (1997), Castellari et al. (1998), Bignami et al. (1995) and Gill (1982). Net heat fluxQnet(W/m2) is:
Qnet=QS−QB−QH−QE. (4)
Since we cannot quantify them in our study, we group other terms of Eq. (2) intoQres, a residual heat flux, as done by
Richards and Inall (2000). They were, however, able to dis-tinguish among various terms, and quantify meridional ad-vection at least. Thus, they associate the residual flux to zonal and vertical advection and to errors deriving from cal-culating various terms. Unlike them, we are going to ex-amine the relationship between the rate of the heat storage and time averaged heat flux, and indirectly estimate the im-portance of the other terms, mainly horizontal and vertical advection. While they try to close the heat balance over a wide region, with spatially averaged temperature profiles, we examine it locally. Therefore, our spatial scales are not com-parable to theirs. Our XBT-survey sampling step was vary-ing from bi-weekly to a monthly scale, so we have chosen a monthly step as the common heat flux integration time scale.
3 A phenomenology of the thermal structures: a
snap-shot taken at the beginning of December 1999
4 1 4 1 .5 4 2
la titu d e [° N ] -7 0 0
-6 0 0 -5 0 0 -4 0 0 -3 0 0 -2 0 0 -1 0 0 0
d
e
p
th
[
m
]
(a)
3 7 3 8 3 9
la titu d e [° N ] -7 0 0
-6 0 0 -5 0 0 -4 0 0 -3 0 0 -2 0 0 -1 0 0 0
d
e
p
th
[
m
]
(b)
° C
1 3 .0 1 3 .5 1 4 .0 1 4 .5 1 5 .0 1 5 .5 1 6 .5 1 7 .5 1 8 .5 2 0 .0 2 2 .0
3 8 .5 3 9 3 9 .5 4 0 4 0 .5 4 1 4 1 .5 4 2 4 2 .5 4 3 4 3 .5 4 4
la titu d e [° N ] -4 0 0
-3 0 0 -2 0 0 -1 0 0 0
d
e
p
th
[
m
]
(c) Fig. 2. Vertical sections at the
be-ginning of December 1999: across the
southern Adriatic (a), across the NW
Ionian Sea(b)and across the
Ligurian-Tyrrhenian section(c). Arrows denote
position of the five XBT locations for temporal evolution.
reaches 17◦C, as a consequence of advection of the Ionian waters, which tend to circulate cyclonically in the southern Adriatic gyre (Gaˇci´c et al., 1997; Kovaˇcevi´c et al., 1999, Poulain, 2001). In the intermediate layers, a curving of the isotherms indicates not only a basin-wide cyclonic cir-culation (Zore-Armanda, 1956), but also a series of smaller meso-scale features (either meanders or eddies; Manca et al., 2002). Between 300 and 600 m there is an almost isother-mal intermediate layer with temperatures between 13.5 and 13.7◦C. Below it, the water becomes slightly cooler (13.2◦C) as a consequence of an upwelling of colder, deep waters, which is due to the strengthening of the cyclonic circulation at depth.
Along the NW Ionian section (Fig. 2b), the surface layer is warmer (>17.5◦C) than in the Adriatic, and maximum temperatures reach about 18◦C inside the two pools: south of 38.5◦N, and north of 39◦N. The intermediate waters are characterized by two upwelling zones, one to the south, cen-tered around 37.3◦N, and the other to the north at about 39◦N. The former is quite evident, indicating a cyclonic cir-culation at the level of the seasonal thermocline, present in the southernmost portion of this section. The other one is much better indicated by a slope of the isolines at its north-ernmost end. The assertion of the presence of this northern cyclonic gyre is corroborated by a trajectory of a PALACE
float released in the Ionian Sea in March 2000 (available at URL page of the Naval Oceanographic Office, USA, http://flux.ocean.washington.edu), as well as by analysis of the same XBT data in Fusco et al. (2003).
Malanotte-Rizzoli et al. (1997) reported a presence of a “permanent cyclone” during the second half of the 1980’s, situated between 37 and 38◦N, near the coast. It is not pos-sible to establish whether that feature was advected north-eastward by the Atlantic-Ionian current, thus, corresponding to our northern cyclone, or if it maintained its position since then, coinciding, therefore, with our southern cyclone. The variable thickness and depth of the layer, with temperatures 14.5–15◦C found between 100 and 300 m, indicated a spa-tially uneven distribution of the intermediate waters, reflect-ing, most probably, intense dynamical activity at a sub-basin scale (Malanotte-Rizzoli et al., 1997). The minimum temper-atures were observed below 600 m, having 13.5–13.75◦C.
✁ ✂ ✄ ✂✁ ✄ ✄ ✄ ✁ ✂✁ ✂✁ ✄ ✄ ✄ ✁ ✂✁ ✁ ✂✁ ✄ ✄ ✄ ✁ ✂✁ ☎ ✂✁ ✄ ✄ ✄ ✁ ✂ ✁ ✂ ☎ ✁ ✂ ☎ ✂ ☎ ✁ ✂ ✆ ✂ ☎ ✁ ✂ ✝ ✂ ☎ ✁ ✂ ✞ ✂ ☎ ✁ ✂ ✟ ✂ ☎ ✁ ✂ ✠ ✂ ☎ ✁ ✂ ✡ ✂ ☎ ✁ ✂ ✄ ✂ ☎ ✁ ✂✁ ✂ ☎ ✁ ✂✁ ✁ ✂ ☎ ✁ ✂✁ ☎ ✂ ☎ ✁ ✂ ✁ ✂ ☎ ✁ ✁ ✂ ☎ ✂ ☎ ✁ ✁ ✂ ✆ ✂ ☎ ✁ ✁ ✂ ✝ ✂ ☎ ✁ ✁ ✂ ✞ ✂ ☎ ✁ ✁ ✂ ✟ ✂ ☎ ✁
24 4 29 4 34 4 39 4 44 4 49 4 54 4 59 4 64 4 69 4 74 4 79 4 84 4 -7 00 -6 00 -5 00 -4 00 -3 00 -2 00 -1 00 0 d e p th [ m ]
1 7 ° 2 0 ' E , 4 1 ° 5 2 ' N
(a)
24 4 29 4 34 4 39 4 44 4 49 4 54 4 59 4 64 4 69 4 74 4 79 4 84 4 -7 00 -6 00 -5 00 -4 00 -3 00 -2 00 -1 00 0 d e p th [ m ]
1 6 ° E , 3 7 ° 2 4 ' N
(b)
24 4 29 4 34 4 39 4 44 4 49 4 54 4 59 4 64 4 69 4 74 4 79 4 84 4 -4 00 -3 00 -2 00 -1 00 0 d e p th [ m ]
1 2 ° 5 5 ' E , 3 8 ° 5 4 ' N
(c)
24 4 29 4 34 4 39 4 44 4 49 4 54 4 59 4 64 4 69 4 74 4 79 4 84 4 -4 00 -3 00 -2 00 -1 00 0 d e p th [ m ]
1 0 ° 3 5 ' E , 4 2 ° N
(d)
2 4 4 2 9 4 3 4 4 3 9 4 4 4 4 4 9 4 5 4 4 5 9 4 6 4 4 6 9 4 7 4 4 7 9 4 8 4 4 -4 0 0
-3 0 0 -2 0 0 -1 0 0 0 d e p th ( m )
9 ° 5 ' E , 4 4 ° 1 0 'N
(e)
° C
1 3 .0 1 3 .5 1 4 .0 1 4 .5 1 5 .0 1 5 .5 1 6 .5 1 7 .5 1 8 .5 2 0 .0 2 2 .0
Julian days (1 Septem ber 1999 - 1 June 2001)
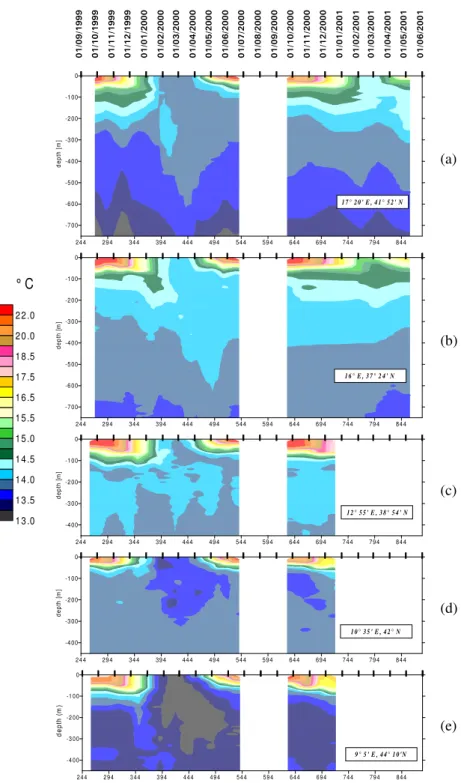
Fig. 3. Temporal evolution of
ther-mal structures: in the southern Adriatic
(a), NW Ionian (b), southern
Tyrrhe-nian Sea(c), northern Tyrrhenian (d),
and Ligurian Sea(e). Approximate
po-sition of the locations is indicated by geographical coordinates.
to cyclonic gyres, eddies or meanders. These are present pri-marily in the upper layer down to about 100–150 m. One of the most evident structures is the outcropping of the 15.5◦C isotherm east of the Strait of Bonifacio at around 41.5◦N,
close to the selected site for the northern Tyrrhenian. It in-dicates a cyclonic feature, identified as a Bonifacio gyre, as mentioned in the review paper by Millot (1999). This cy-clonic gyre is attributed to wind forcing (Artale et al., 1994). The doming of the isotherms at the head of the Ligurian Sea
ob-served during the 1969 MEDOC experiments. More recent measurements, however, have shown that the winter convec-tion was not as deep as before (Sparnocchia et al., 1995), and, as a consequence, only intermediate waters could be formed.
4 Temporal evolution of thermal structures
In this section, a few locations in different parts of the study domain were selected to present an evolution of the thermal structures from September 1999 onward, to the end of the measurements, which was December 2000 for the Tyrrhenian and Ligurian Seas, and May 2001 for the Adriatic and Ionian Seas.
4.1 The southern Adriatic Sea
The location at 17◦20′E, 41◦52′N is close to the center of the southern Adriatic gyre (Zore-Armanda, 1956; Poulain, 2001), where deep convection is expected to take place dur-ing winter. Therefore, it is selected as bedur-ing representative for the time evolution of the thermal structure in the open sea convection area. From stratified conditions at the end of the summer season, with a prominent seasonal thermocline, situated at about a 40 m depth, the thermal structure gradu-ally changes during 1999/2000. The thermocline is eroded, and vertical mixing and convection processes yield to an al-most completely homogenous layer down to about 600 m by the end of March 2000 (Fig. 3a), with temperatures between 13.75 and 14◦C. After that, a heating of the surface layer causes a regeneration of the seasonal thermocline. A cooling of the surface layer is evident again during autumn 2000, but the most significant feature is the absence of the deep con-vection during February and March 2001. Although the sea-sonal thermocline was eroded, the mixed layer only reached 200 m, with temperatures between 14.25 and 14.5◦C, indi-cating a higher heat content than during the previous winter. 4.2 The NW Ionian Sea
In the NW portion of the Ionian Sea, the time evolution of the thermal structure is given at the location close to 16◦E, 37◦24′N (Fig. 3b). The dominant features are a warmer sur-face layer than in the southern Adriatic, a longer persistence of the seasonal thermocline between 50 and 100 m below sur-face, and a presence of a tongue of a relatively warm interme-diate layer protruding from 100 m towards 200 m during the beginning of winter (January 2000). By mid-March 2000, a relatively homogenous layer (within 14–14.25◦C) reached down to 500 m. Its intrusion down to 600 m is evident during a successive period (May 2000), and might be induced by a downwelling, due to a presence of an anticyclonic gyre in in-termediate layers (300–600 m). The spatial extension of this feature is evident on vertical sections obtained during surveys in May 2000, and they can be visualized at the OGS web URL page (http://doga.ogs.trieste.it/mfspp ogs/index.html; OGS, Trieste, Italy).
During winter 2000/2001 the upper layer remained weakly stratified, enough to show that a seasonal thermocline had not been completely eroded and the heat content was greater than during winter 1999/2000.
4.3 The southern Tyrrhenian Sea
The time evolution of the thermal structure at a location representative for the southern Tyrrhenian Sea (12◦55′E, 38◦54′N) is given in Fig. 3c. The upper layer with a seasonal thermocline extends down to 120 m. The intermediate layer below has temperatures between 14 and 14.5◦C. A gradual erosion of the seasonal thermocline is evident up to the end of January 2000. Then, during February and March, an upper mixed layer about 120 m thick is formed. During April 2000, a thermal stratification gradually sets up. Unfortunately, due to the lack of surveys, we are not able to compare two con-secutive winter thermal structures in this area.
4.4 The northern Tyrrhenian Sea
The temporal evolution in the northern Tyrrhenian Sea near the Corsica Channel (10◦40′E, 42◦N) can be observed in Fig. 3d. The upper portion of the water column (above 100 m) is characterized by the presence of the seasonal ther-mocline, which gradually diminishes by the end of 1999. The layers beneath are occupied by intermediate waters with a relatively constant temperature (13.75–14◦C). At the begin-ning of January 2000, the intrusion of colder water at a 150 m depth is observed. Subsequently, during the period from Jan-uary through March, a surface mixed layer is formed, char-acterized by a presence of a cold pool with a temperature minimum of about 13.5◦C, which protrudes down to about 250–300 m. In April 2000, the seasonal thermocline begins re-establishing itself again. The surveys in autumn 2000 show a similar trend in the thermocline erosion to that of autumn 1999. However, in October and November, the in-termediate layers between 100 and 200 m are occupied by waters colder than those of the same period of the previous year.
4.5 The Ligurian Sea
only observe similar thermal properties and the thermocline erosion again in autumn 2000.
5 Discussion
In all examples of seasonal evolution of the thermal prop-erties, a common feature can be observed. A seasonal thermocline gradually vanishes, leaving a cold homogenous layer that extends from the sea surface down to different depths. From the observed structures the maximum mix-ing/convection depth of about 600 m is reached in the south-ern Adriatic Sea in winter 2000, while in the other zones it is between 300 and 400 m. Heat loss from the air-sea inter-face, and wind-induced mixing are among those significant processes which cause thermocline erosion, mixing, and ver-tical convection to take place during the cold season.
In addition to a seasonal signal, a significant year-to-year variability is observed in the southern Adriatic and in the NW Ionian Seas. It reflects different winter thermal conditions, with higher temperatures and lower mixing/convection depth during the winter of 2000/2001, with respect to the winter of 1999/2000. This induced us to search for the most probable reason for such a variability. By hypothesising that a surface heat loss is one of the most important mechanisms in gen-erating the vertical mixing, computation of the differences of the daily net heat flux between the winters of 1999/2000 and 2000/2001 was performed. A six-month interval, from October through March, was chosen. For each day within this time interval, the daily net heat flux in 1999/2000 was subtracted from that of 2000/2001. The obtained time se-ries of daily differences was smoothed by a moving average with a window of 11 days. In this way, high-frequency varia-tions were smoothed out, giving the possibility of noting the differences better between the 1999/2000 and the 2000/2001 six-month period. They are plotted in Fig. 4 for all five lo-cations in the study zone. The most prominent differences between the two periods are observed in the southern Adri-atic (Fig. 4a). Most of the time, and, in particular between January–March, the heat loss in 1999/2000 was greater, indi-cating more severe climatic conditions over the area, which could have contributed to more intense winter convection and mixing, thus, penetrating to a deeper layer than in 2000/2001. Likewise, the differences over the NW Ionian Sea (Fig. 4b) evidence the fact that climatic conditions in 1999/2000 were generally more severe than in 2000/2001. This fits well with the differences observed in the winter mixing depth. In par-ticular, November, December, and January 1999/2001 were colder than in 2000/2001.
Although the lack of XBT data in the Tyrrhenian and Lig-urian Seas in 2001 prevents us from making a comparison of the thermal conditions in the sea, we also report the heat flux differences for these areas, in order to assess whether year-to-year climatic conditions over different zones have similar characteristics. In the southern Tyrrhenian Sea (Fig. 4c), we found that during the six-month interval, the climatic differ-ences between the two years were similar to those in the NW
-2 00 0 2 0 0
Qn
e
t
d
if
fe
re
n
c
e
[
W
/m
2]
O cto be r N o ve m be r D e ce m be r Ja n u a ry F eb ru a ry M a rch
(a)
-2 00 0 2 0 0
Qn
e
t
d
if
fe
re
n
c
e
[
W
/m
2]
O cto be r N o ve m be r D e ce m be r Ja n u a ry F eb ru a ry M a rch
(b)
-2 00 0 2 0 0
Qn
e
t
d
if
fe
re
n
c
e
[
W
/m
2]
O cto be r N o ve m be r D e ce m be r Ja n u a ry F eb ru a ry M a rch
(c)
-2 00 0 2 0 0
Qn
e
t
d
if
fe
re
n
c
e
[
W
/m
2]
O cto be r N o ve m be r D e ce m be r Ja n u a ry F eb ru a ry M a rch
(d)
-2 00 0 2 0 0
Qn
e
t
d
if
fe
re
n
c
e
[
W
/m
2]
O cto be r N o ve m be r D e ce m be r Ja n u a ry F eb ru a ry M a rch
(e)
Fig. 4. Difference in the daily heat fluxes between 1999/2000 and
2000/2001 for the period October-March at five locations:
south-ern Adriatic at 41.5◦N, 17.5◦E(a); NW Ionian at 37.5◦N, 16◦E
(b); southern Tyrrhenian Sea at 39◦N, 13◦E(c); central Tyrrhenian
Sea at 42◦N, 10.5◦E(d)and northern Ligurian Sea at 44◦N, 9◦E
(e). Positive areas (in light grey) indicate greater heat loss during
1999/2000, while negative areas (in dark grey) indicate greater heat loss during 2000/2001.
Ionian. The period 1999/2000 is initially warmer, becom-ing almost continuosly cooler durbecom-ing November–December. Warmer and cooler conditions alternate later on.
0
1
/1
0
/1
9
9
9
0
1
/1
1
/1
9
9
9
0
1
/1
2
/1
9
9
9
0
1
/0
1
/2
0
0
0
0
1
/0
2
/2
0
0
0
0
1
/0
3
/2
0
0
0
0
1
/0
4
/2
0
0
0
0
1
/0
5
/2
0
0
0
2 7 4 3 0 5 3 3 5 3 6 6 3 9 7 4 2 6 4 5 7 4 8 7 -4 0 0
-3 0 0 -2 0 0 -1 0 0 0 1 0 0 2 0 0
[W
/m
2]
(a)
2 7 4 3 0 5 3 3 5 3 6 6 3 9 7 4 2 6 4 5 7 4 8 7 -4 0 0
-3 0 0 -2 0 0 -1 0 0 0 1 0 0 2 0 0
[W
/m
2] (b)
2 7 4 3 0 5 3 3 5 3 6 6 3 9 7 4 2 6 4 5 7 4 8 7 -4 0 0
-3 0 0 -2 0 0 -1 0 0 0 1 0 0 2 0 0
[W
/m
2]
(c)
2 7 4 3 0 5 3 3 5 3 6 6 3 9 7 4 2 6 4 5 7 4 8 7 -4 0 0
-3 0 0 -2 0 0 -1 0 0 0 1 0 0 2 0 0
[W
/m
2] (d)
2 7 4 3 0 5 3 3 5 3 6 6 3 9 7 4 2 6 4 5 7 4 8 7
J u lia n d a y s (O c t o b e r 0 1 - M a y 0 1 )
-4 0 0 -3 0 0 -2 0 0 -1 0 0 0 1 0 0 2 0 0
[W
/m
2]
(e)
n e t h e a t flu x h e a t sto ra g e ra te
Fig. 5. Time averaged net heat flux at the air-sea interface and
the heat storage rate in the upper layer for the period between 27 September 1999 and 15 April 2000 at a monthly time scale: in
the southern Adriatic(a), in the NW Ionian(b), in the southern
Tyrrhenian Sea(c), in the northern Tyrrhenian Sea(d), and in the
Ligurian Sea(e). The heat storage rate refers to the water column
either between 5 and 450 m (a and b), or between 5 and 330 m (c,
d, and e). The time scale refers to the upper integral limitt2from
Eq. (3) in the text.
northern Tyrrhenian Sea (Fig. 4d) exceeded that of 2000. In winter months, such a difference was less evident.
In the Ligurian Sea (Fig. 4e), two different periods can be clearly identified. Autumn 1999 was cooler than au-tumn 2000, but January-March 2000 were warmer than January–March 2001. This was contrary to the situation in the southern Adriatic Sea.
The comparison of the climatic conditions indicated that they varied significantly from one zone to another. In the southern Adriatic, autumn and winter were conspicuously cooler in 1999/2000 than in 2000/2001. In the Ligurian Sea, however, autumn 1999 was cooler than autumn 2000, while the winter months in 2000 were warmer than in 2001. In be-tween, there are three other areas where autumn 1999 was cooler than autumn 2000, but the winter months were almost equal, and characterized by alternating cooler and warmer periods. In the southern Adriatic the convection depth is de-pendent on the climatic conditions. Similar effects can be observed in the NW Ionian Sea, where the surface layer re-mained weakly stratified during the entire winter of 2001.
Climatic conditions are not the only influencing factor. Other phenomena, such as advection of cooler/warmer wa-ters may also affect the thermal structure of the water col-umn. We believe that the year-to-year variability of the climatic conditions is a primary controlling factor for gen-erating sufficient heat loss from the sea-surface in pre-conditioning phase (October–December), in order to trigger off the onset of vertical convection and mixing. Its intensity and maximum depth strongly depend on the heat lost during a successive period (January–March).
When considering the contribution of the various, often competitive factors, which influence the thermal content and its change in the water column, another question may arise; to what extent can the thermal content change be explained solely by the surface heat losses? With temperature profiles for once or twice a month in the same zone, we can com-pare the relationship between the heat storage rate from sur-vey to sursur-vey, with the heat flux determined from meteoro-logical conditions in the area. It is not simple to establish a correct, quantitative relationship between the two, mainly for the following reasons: uncertainty in calculating the sur-face heat flux components which, according to some authors (e.g. Richards and Inall, 2000), reaches orders of magnitude of 10 W/m2, or choice of the maximum depth to which the thermal content in the water column is calculated. Neverthe-less, we might say that if the competing processes, such as a lateral advection, a vertical entrainment, and turbulence, are weak or even negligible, the temporal evolution between the two quantities must at least be coherent: the decreasing heat content should reflect a heat loss, and vice versa.
peri-ods 1999/2000 and 2000/2001, while for the remaining three locations only the 1999/2000 period was taken into account. In the southern Adriatic (Fig. 5a), for the first period, the time-averaged net heat loss and a corresponding heat stor-age rate within a water column between 5 and 450 m are not coherent. Often, the heat loss does not provoke an ad-equate heat content change, which, on the contrary, some-times shows an opposite trend (JD around 350 and 405). Such a behaviour demonstrates that the water column is sub-ject to a considerable influence from processes which may contrast the effect of heat loss, presumably by lateral ad-vection of warmer, and, hence, saltier water in intermediate layers. Such a process certainly occurs in the southern Adri-atic gyre, where incoming intermediate water of Levantine or Aegean origin is advected along the eastern coast of the Adri-atic and partly re-circulates in the southern AdriAdri-atic (Gaˇci´c et al., 1997; Kovaˇcevi´c et al., 1999; Poulain, 1999; Manca et al., 2002). In some cases, however, the heat content change pro-voked by an upwelling or downwelling across the base of the water column (due to the intensification or migration of the cyclonic gyre) might also modify the effect of the heat loss from the surface. Signals associated to both horizontal ad-vection and upwelling or downwelling are evident in Fig. 3a. In the NW Ionian (Fig. 5b), the generally coherent rela-tionship between the heat flux and the heat storage rate was corrupted in January 2000, when the heat storage rate was significantly lower than the imposed surface heat loss. Also, lateral advection and entrainment across the base of the upper water column at about 450 m may influence the heat storage rate and compete with the effect due to a heat loss from the surface.
In the southern Tyrrhenian Sea (Fig. 5c), the relationship between the heat loss and the heat storage rate is irregular in autumn, when the heat content increases despite the heat loss. During winter more regular behaviour is observed, ex-cept around JD 375, when an additional decrease in the heat content is due to either lateral advection or a vertical entrain-ment of a slightly cooler water from below (see Fig. 3c, at the beginning of January 2000).
In the northern Tyrrhenian Sea (Fig. 5d), the heat stor-age rate should not be significantly influenced by the ver-tical entrainment from below, since the interior of this zone below 330 m is quite homogenous as far as temperature is concerned (as shown in Fig. 3d). The relationship between the two variables, however, is not very regular. This may indicate a possible effect of the laterally advected heat.
In the Ligurian Sea (Fig. 5e), the trend between the two quantities is almost regular, except for the period around JD 375. A plausible reason for this conspicuous difference may be advection of the cooler water in the intermediate layer at the beginning of January 2000, around JD 370, which be-comes mixed with the cooled surface waters at the end of January 2000, JD 390 (Fig. 3e).
The relationship between the heat storage rate and the heat loss a year later, in 2000/2001, is depicted in Fig. 6. The two processes are rather coherent both in the southern Adriatic (Fig. 6a), and in the NW Ionian (Fig. 6b).
0
1
/1
0
/2
0
0
0
0
1
/1
1
/2
0
0
0
0
1
/1
2
/2
0
0
0
0
1
/0
1
/2
0
0
1
0
1
/0
2
/2
0
0
1
0
1
/0
3
/2
0
0
1
0
1
/0
4
/2
0
0
1
0
1
/0
5
/2
0
0
1
2 7 5 3 0 6 3 3 6 3 6 7 3 9 8 4 2 6 4 5 7 4 8 7 -4 0 0
-3 0 0 -2 0 0 -1 0 0 0 1 0 0 2 0 0
[W
/m
2]
(a)
2 7 5 3 0 6 3 3 6 3 6 7 3 9 8 4 2 6 4 5 7 4 8 7
J u lia n d a y s (1 O c t o b e r - 1 M a y )
-4 0 0 -3 0 0 -2 0 0 -1 0 0 0 1 0 0 2 0 0
[W
/m
2]
(b)
n et heat flu x h ea t stora ge rate
Fig. 6. Time averaged net heat flux at the air-sea interface and
the heat storage rate in the upper layer for the period between 27 September 2000 and 15 April 2001 at a monthly time scale: in
the southern Adriatic(a)and in the NW Ionian(b). The heat
stor-age rate refers to the water column between 5 and 450 m. The time
scale refers to the upper integral limitt2from Eq. (3) in the text.
Another feature seems to strongly distinguish the south-ern Adriatic from all the other locations, namely the differ-ence between the net heat flux and the heat storage rate,Qres
(which corresponds to the area between the two curves in Figs. 5 and 6), which remains generally greater than in other zones. This indicates that a relative importance, or the ef-ficiency of the heat loss to provoke an adequate decrease in the heat content is lower than in other zones. It means that the terms involved inQres play a significant role in
col-umn was about 50%. The main source of heat during winter in the southern Adriatic comes from the intermediate warmer but saltier water entering from the Ionian Sea. Its presence is of crucial importance for the dense water formation (Manca, 2000), since its upwelling in the center of the cyclonic gyre creates pre-conditioning for the vertical convection, which may take place only if a surface heat loss and wind-induced mixing act strongly enough to penetrate through this inter-mediate layer. In the other studied zones, the terms from Qres are less important, with respect to a surface cooling, in
determining the heat content of the water column.
6 Conclusions
The temporal evolution of the thermal structure was studied for the five locations in the central Mediterranean, namely the southern Adriatic, the NW Ionian, the southern and north-ern Tyrrhenian Seas, and the Ligurian Sea. An almost con-tinuous series of data collected once or twice a month be-tween September 1999 and May 2001 enabled us to observe the seasonal variability of the thermal structures along the XBT tracks. The observations showed a gradual erosion of the thermocline from the end of the summer 1999, a forma-tion of a homogenous mixing layer in winter, and interme-diate or deep convection, before the re-stratification during the following spring. In the southern Adriatic and in the NW Ionian Seas, observations, which lasted throughout win-ter 2000/2001, showed significant differences in the winwin-ter thermal properties between 1999/2000 and 2000/2001. A deep convection down to 600 m occurred at the end of win-ter 2000 in the southern Adriatic. Simultaneously, a mixed depth of about 200 m was reached in the NW Ionian, which thermally homogenized the surface layer with the interme-diate layers. On the contrary, by the end of winter 2001, the maximum mixed depth in the southern Adriatic hardly reached 200 m, unable to penetrate through a thick interme-diate layer with a temperature of 13.75–14◦C. At the same time, in the NW Ionian, the water remained slightly stratified throughout the winter. At least one possible reason for this has been identified by a comparison of the daily heat loss rate in the two zones between October and March, for the two periods 1999/2000 and 2000/2001; namely the smoothed daily differences between the two periods have shown that both autumnal and winter climatic conditions in the southern Adriatic were more severe in 1999/2000 than in 2000/2001. Simultaneously, in the NW Ionian, the differences were not so prominent, however, the 1999/2000 heat loss was greater than the heat loss in 2000/2001. Although we do not claim that this is the only reason for such a different convection depth between the two winters, it must be one of the key fac-tors.
Due to the lack of measurements in 2001, there was no possibility of finding out whether such significant differences are observed in the remaining zones. However, the meteoro-logical data were available, and, therefore, the comparison of the differences in surface net heat flux was performed
be-tween the two periods. This demonstrated that the variability of the climatic conditions in terms of a net heat flux is not homogeneously distributed around the study zone. It has the same trend for the autumn: showing that autumn 1999 was colder than autumn 2000. But for instance, winter in the Lig-urian Sea showed up warmer in 2000 than in 2001.
Inspection of the qualitative relationship between the rate of the heat storage in the water column and the time averaged surface heat flux shows that in different zones, different com-peting phenomena may either enhance or reduce the effect of the heat being lost from the air-sea interface. The longer the integration time is, the smoother the relationship between the two quantities, since processes at both macro (for exam-ple, lateral advection and vertical intrusion across the base of the water column) and micro spatial scales (turbulent vertical and horizontal diffusion) are filtered out. The residual flux, i.e. the difference between the surface heat flux and the heat storage rate, is greater in the southern Adriatic than in other zones. It reflects a lower efficiency of the surface heat flux in inducing an adequate heat content decrease. We are restricted by a one-dimensionality of our measurements; nevertheless, by taking into account the previous knowledge about the cir-culation and hydrographic properties in the southern Adri-atic, we can deduce that this is indeed the zone most sensi-tive to lateral advection and entrainment through the base of the water column. These processes influence the heat content change significantly, and, as referred by Manca et al. (2002), might have a significant impact on the dense water formation in this area.
In other zones, as in the northern Tyrrhenian, the almost constant thermal conditions below a 300 m depth cannot pro-voke a considerable heat exchange across the base of the wa-ter column. Most likely at this location a competition pri-marily between horizontal advection and heat loss from the surface is responsible for a heat balance.
Acknowledgement. This study was funded by the
ERBMAS3-CT98-0171 grant of the European Commission in the framework of the Mediterranean Forecasting System Pilot Project. Continuation of the measurements upon expiry of the project was supported by funds of the Istituto Nazionale di Oceanografia e di Geofisica
Sper-imentale−OGS, Trieste, Italy, while Fusco G. was also supported
by the MURST project “Ambiente Mediterraneo”. Masters and crews of the voluntary observing ships “Lipa” -Loˇsinjska plovidba, Rijeka, Croatia, and “Excelsior” -Grimaldi, Italy, are acknowledged for their kind hospitality during XBT surveys. Germana Spaggiari was responsible for the XBT data collection in the Adriatic and Io-nian Seas, while Luciano Perini and Franco Arena conducted a part of the analyses. Corrado Fragiacomo contributed with the figure de-sign. Antonio Baldi, Carlo Galli e Massimo Morgigni conducted the XBT data collection in the Ligurian and Tyrrhenian Seas.The mete-orological data used in the present analysis are from the European Center for Medium-range Weather Forecast operational analysis.
References
Artale, V., Astraldi, M., Buffoni, G., and Gasparini, G. P.: Seasonal variability of gyre-scale circulation in the North Tyrrhenian Sea, J. Geophys. Res., 99 (C7), 14 127–14 137, 1994.
Artegiani, A., Bregant, D., Paschini, E., Pinardi, N., Raicich, F., and Russo, A.: The Adriatic Sea general circulation. Part I: Air-Sea interaction and water mass structure. Part II: baroclinic circula-tion structure, J. Phys. Oceanogr., 27, 1492–1532, 1997. Bignami, F., Marullo, S., Santoleri, R., and Schiano, M. E.:
Long-wave radiation budget in the Mediterranean Sea, J. Geophys. Res., 100 (C2), 2501–2514, 1995.
Cardin, V., Kovaˇcevi´c, V., and Gaˇci´c, M.: Interannual variability of the winter buoyancy loss and deep convection in the south-ern Adriatic Sea, In: EGS 24th General Assembly: Hydrology, Oceans and Atmosphere, Geophys. Res. Abstracts, 1, 400, 1999. Castellari, S., Pinardi, N., and Leaman, K.: A model study of air-sea interactions in the Mediterranean Sea, J. Mar. Syst., 18, 89–114, 1998.
Cronin, M. F. and McPhaden, M. J.: The upper ocean heat balance in the western equatorial Pacific warm pool during September-December 1992, J. Geophys. Res., 102 (C4), 8533–8553, 1997. Fusco, G., Manzella, G. M. R., Cruzado, A., Gaˇci´c, M., Gasparini,
G. P., Gervais, T., Kovaˇcevi´c, V., Millot, C., Tziavos, C., Ve-lasquez, Z. R., Walne, A., Zervakis, V., and Zodiatis, G.: Inter-annual variability of meso-scale features in the Mediterranean Sea, Ann. Geophysicae, this issue, 2003.
Gaˇci´c, M., Marullo, S., Santoleri, R., and Bergamasco, A.: Analy-sis of the seasonal and interannual variability of the sea surface temperature field in the Adriatic Sea from AVHRR data (1984– 1992), J. Geophys. Res., 102 (C10), 22 937–22 946, 1997. Gill, A. E.: Atmosphere-Ocean Dynamics, International
Geophysi-cal Series, Vol. 30, Academic Press, 662, 1982.
Hecht, A., Rosentroub, Z., and Bishop, J.: Temporal and spatial variations of heat storage in the Eastern Mediterranean, Isr. J. Earth Sci., 34, 51–64, 1985.
Kovaˇcevi´c, V., Gaˇci´c, M., and Poulain, P. M.: Eulerian current mea-surements in the Strait of Otranto and in the southern Adriatic, J. Mar. Syst., 20, 255–278, 1999.
Malanotte-Rizzoli, P., Manca, B. B., Ribera D’Alcal`a, M., Theocharis, A., Bergamasco, A., Bregant, D., Budillon, G., Civ-itarese, G., Georgopoulos, D., Michelato, A., Sansone, E.,
Scarazzato, P., and Souvermezoglou, E.: A synthesis of the Io-nian Sea hydrography, circulation and water mass pathways dur-ing POEM-Phase I, Prog. Oceanog., 39, 153–204, 1997. Manca, B. B.: Recent Changes in dynamics of the Eastern
Mediter-ranean affecting the water characteristics of adjacent basin. In: The Eastern Mediterranean climatic transient, its origin, evolu-tion and impact on the ecosystem, (Ed) Briand, F., CIESM Work-shop Series no. 10, 16 boulevard de Suisse, MC-98000, Monaco, 27–31, 2000.
Manca, B. B., Kovaˇcevi´c, V., Gaˇci´c, M., and Viezzoli, D.: Dense water formation in the southern Adriatic and spreading into the Ionian Sea, J. Mar. Syst., 33/34(C), 133–154, 2002.
Manzella, G. M. R., Cardin, V., Cruzado, A., Fusco, G., Gaˇci´c, M., Galli, C., Gasparini, G. P., Gervais, T., Kovaˇcevi´c, V., LePetit, L., Millot, C., Spaggiari, G., Tonani, M., Tziavos, C., Velasquez, Z., Walne, A., Zervakis, V., and Zodiatis, G.: EU-sponsored Effort Improves Monitoring of Circulation Variability in the Mediter-ranean, EOS, Vol. 82, No. 43, 2001.
May, P. W.: A brief explanation of Mediterranean heat and momen-tum flux calculations, NORDA Code 322, NSTL, MS 39529, 1p, 1986.
Millot, C.: Circulation in the Western Mediterranean Sea, J. Mar. Syst., 20, 423–442, 1999.
Poulain, P.-M.: Drifter observations of the surface circulation in the Adriatic Sea between December 1994 and March 1996, J. Mar. Syst., 20, 231–253, 1999.
Poulain, P.-M.: Adriatic Sea surface circulation as derived from drifter data between 1990 and 1999, J. Mar. Syst., 29, 3–32, 2001.
Richards, K. J. and Inall, M. E.: The upper ocean heat content of the western equatorial Pacific: processes controlling its change during the Tropical Global Atmosphere Coupled Ocean-Atmosphere Response Experiment, J. Geophys. Res., 105 (C8), 19 575–19 590, 2000.
Schiano, M. E.: Insolation over the western Mediterranean Sea: a comparison of direct measurements and Reed’s formula, J. Geo-phys. Res., 101 (C2), 3831–3838, 1996.
Sparnocchia, S., Picco, P., Manzella, G. M. R., Ribotti, A., Copello, S., and Brasey, P.: Intermediate water formation in the Ligurian Sea, Oceanologica Acta, 18, 151–162, 1995.