The Influence of Hydroxylation on
Maintaining CpG Methylation Patterns:
A Hidden Markov Model Approach
Pascal Giehr1☯, Charalampos Kyriakopoulos2☯, Gabriella Ficz3, Verena Wolf2
*, Jörn Walter1*
1Department of Biological Sciences, UdS, Saarbrücken, Saarland, Germany,2Computer Science Department, UdS, Saarbrücken, Saarland, Germany,3Barts Cancer Institute, Queen Mary University, London, United Kingdom
☯These authors contributed equally to this work.
*[email protected](VW);[email protected](JW)
Abstract
DNA methylation and demethylation are opposing processes that when in balance create stable patterns of epigenetic memory. The control of DNA methylation pattern formation by replication dependent and independent demethylation processes has been suggested to be influenced by Tet mediated oxidation of 5mC. Several alternative mechanisms have been proposed suggesting that 5hmC influences either replication dependent maintenance of DNA methylation or replication independent processes of active demethylation. Using high resolution hairpin oxidative bisulfite sequencing data, we precisely determine the amount of 5mC and 5hmC and model the contribution of 5hmC to processes of demethyla-tion in mouse ESCs. We develop an extended hidden Markov model capable of accurately describing the regional contribution of 5hmC to demethylation dynamics. Our analysis shows that 5hmC has a strong impact on replication dependent demethylation, mainly by impairing methylation maintenance.
Author Summary
Oxidation of 5mC by Ten-eleven translocation (Tet) enzymes leads to the formation of 5hmC and other higher oxidized forms in the DNA. Several findings indicate that oxida-tion induces demethylaoxida-tion processes, but the mechanistic contribuoxida-tion of 5hmC to this process remains unclear. Using an innovative combination of 5hmC detection chemistry and high resolution sequencing, we generate data that can be used for a novel hidden Mar-kov modeling approach. This new model for the first time incorporates 5hmC dynamics and allows to test certain scenarios of demethylation mechanisms. Our findings support the conclusion that 5mC oxidation compromises the copying of DNA methylation pat-terns across generations in ES-cells.
a11111
OPEN ACCESS
Citation:Giehr P, Kyriakopoulos C, Ficz G, Wolf V, Walter J (2016) The Influence of Hydroxylation on Maintaining CpG Methylation Patterns: A Hidden Markov Model Approach. PLoS Comput Biol 12(5): e1004905. doi:10.1371/journal.pcbi.1004905
Editor:Michael B. Stadler, Friedrich Miescher Institute for Biomedical Research, SWITZERLAND
Received:October 30, 2015
Accepted:April 7, 2016
Published:May 25, 2016
Copyright:© 2016 Giehr et al. This is an open access article distributed under the terms of the Creative Commons Attribution License, which permits unrestricted use, distribution, and reproduction in any medium, provided the original author and source are credited.
Data Availability Statement:Data are available from the supporting information file,S1 Dataset. Raw sequencing data are available on request from the corresponding author.
Introduction
DNA methylation is an epigenetic modification essential for the regulation of genome stability and genome function [1,2]. During development the distribution of DNA methylation is under strict control to maintain a temporal and cell type specific persistence of epigenetic information [3]. The methylation of DNA in mammals is restricted to the C-5 position of cyto-sine and is predominantly found in a CpG sequence context [4,5].
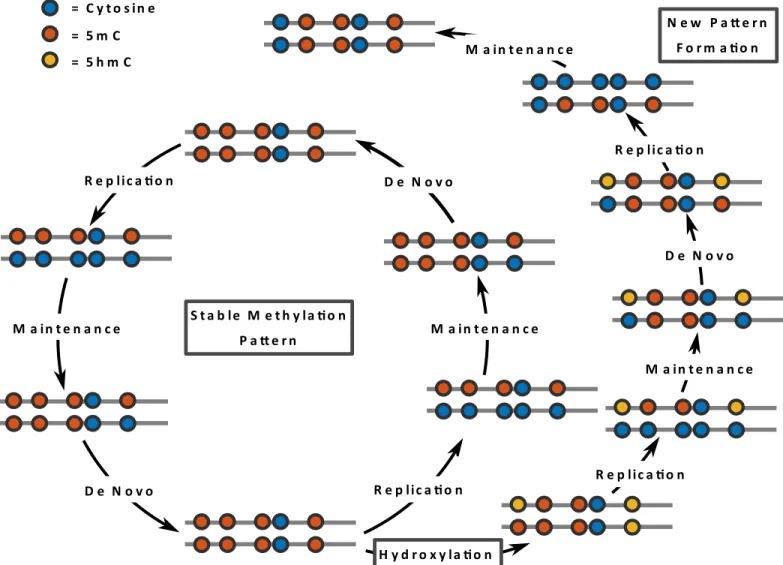
Our current knowledge suggests that DNA methylation patterns (5mC) are mainly estab-lished by DNA methyltransferases Dnmt3a and Dnmt3b [3,6]. The palindromic nature of a CpG sequence in which 5mC occurs allows a recognition of the 5mC hemimethylated state after semi-conservative replication and a copying of the parental methylation pattern to the newly synthesized DNA strand (seeFig 1). A series of experiments revealed that Dnmt1 in con-junction with Uhrf1 are responsible for this copying also referred to asmaintenance methyla-tion. Dnmt1 and Uhrf1 have a high preference for binding to hemimethylated CpG substrates [7–9]. Together they assure the maintenance symmetric CpG methylation patterns after each round of replication.
In contrast to Dnmt1, Dnmt3a and Dnmt3b act on hemi- as well as unmethylated CpGs and their activity is not coupled to DNA replication. Both enzymes are highly regulated and regarded as the main enzymes to establish new methylation patterns and are therefore classi-fied asde novoDNA methyltransferases. However, recent data shows that Dnmt1 may also de novo methylate unmethylated dyads and that Dnmt3a and Dnmt3b are also involved in rees-tablishing (thus“maintaining”) complete methylation patterns at certain loci [10]. In sum-mary, the persistence of methylation patterns is controlled by a coordinated action of de novo and maintenance functions of all three enzymes.
Besides the establishment and the persistence of methylation its removal is also of great bio-logical importance. Demethylation events can occur on a local scale in case of individual gene activation but also on a global genome wide level like in the early zygote and the germ line, where genomes are reprogrammed for new developmental functions [11,12]. In both cases demethylation can be achieved either by an active mechanism (direct removal), a passive repli-cation-dependent loss or a combination of both.
Recent findings suggest that the oxidation of 5mC modulates active and passive demethyla-tion processes. 5-hydroxymethyl cytosine (5hmC) is generated by oxidademethyla-tion of 5mC in an enzymatic reaction catalyzed by the oxoglutarate- and Fe(ii)-dependent ten-eleven trans-loca-tion dioxygenases (Tet1, Tet2, and Tet3) [13]. Tet enzymes also catalyze further oxidations to 5-formylcytosine (5fC) and to 5-carboxycytosine (5caC), which have been shown to promote processes of active demethylation [14–16]. Still 5hmC is the most prevalent oxidation type and widely discussed to having an influence on DNA methylation pattern stability in dividing cells. 5hmC not only alters the chemical properties but also the biological recognition of the base. Dnmt1 binds to 5hmC with a much lower efficiency than to 5mC. This may impair the replica-tion dependent copying of 5mC [17].
In mouse ES cells (mESCs), in the early mouse embryo and in the early germ cells DNA demethylation stability is influenced by the conversion of 5mC into 5hmC. Disturbances or depletion of Tet enzymes in these phases result in massive changes of 5hmC and lead to devel-opmental consequences [18–20]. These findings indicate that the controlled alteration of DNA methylation patterns across DNA replications is dependent on 5hmC. However, the underly-ing mechanisms are still under debate. Mouse ESCs are a well established system to study these effects as they rapidly lose DNA methylation on a genome wide scale when the cells are trans-ferred from conventional serum medium containing LIF (primed state) to a synthetic 2i medium [21,22]. This loss of 5mC is coupled to a temporary gain of 5hmC. In our study we Competing Interests:The authors have declared
follow the dynamic of DNA demethylation in mESCs over time and DNA replications using a novel combination of hairpin sequencing with bisulfite sequencing (BS) and oxidative bisulfite sequencing (oxBS). This method allows us to determine the methylation status of both comple-mentary DNA strands at individual chromosomes and the status of 5hmC levels at given time points [10,23,24].
We propose a stochastic model that describes the evolution of both methylation and hydroxylation patterns over time. Our model allows that methylation can be lost due to cell replication and methyl groups can be added due to either maintenance or de novo enzyme activity [10,25]. In addition, we assume that all methylated sites can be hydroxylated.
Based on these assumptions we define a hidden Markov model (HMM) for each data set and construct likelihood functions on the basis of the two sequencing methods. The combina-tion of the two likelihoods allows us to derive estimacombina-tions for the levels of (hydroxy-)methyla-tion based on observa(hydroxy-)methyla-tions at four different time points. Finally, we determine unknown parameters of the model, i.e., methylation and hydroxylation efficiencies as well as the initial Fig 1. Maintenance and de novo methylation are usually cooperating to maintain a stable methylation pattern (inner circle).The oxidation of 5mC to 5hmC may interfere with the maintenance machinery causing a (partial) loss of CpG methylation after DNA replication. DNA strands are indicated by lines whereas the CpG are shown as colored circles.
distribution of the hidden states. Despite its simplicity, the model accurately predicts the evolu-tion of the (hydroxy-)methylaevolu-tion patterns and allows us to test different assumpevolu-tions about the activities of the involved enzymes.
Methods
Hairpin oxidative bisulfite sequencing
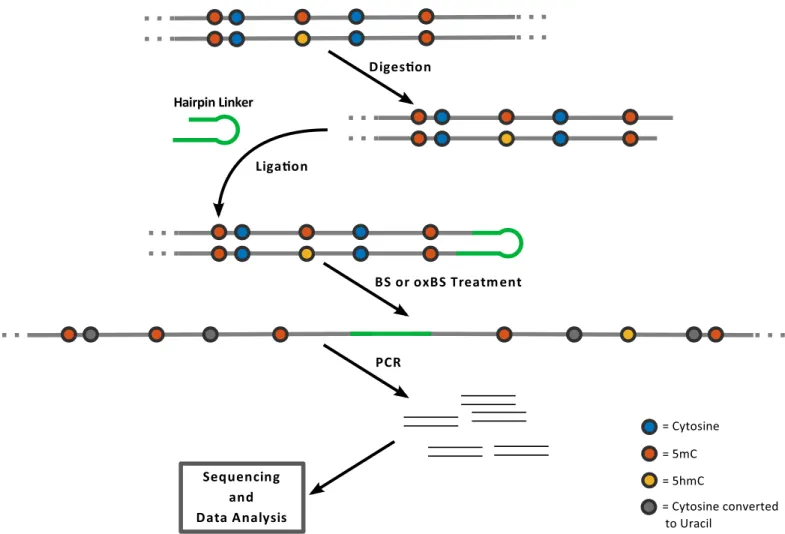
Currently no comprehensive data are available allowing to model the fate of 5hmC at a single base resolution level. Therefore, extending the method described in Fitz et al. 2014 and Arand et al. [10,21] we established a workflow enabling us to produce such data. To obtain base reso-lution information of the modification status we apply hairpin bisulfite sequencing on DNA samples split into oxidative (oxBS-Seq) and non oxidative standard bisulfite reaction (BS-Seq) data sets. The use of the hairpin linker strategy allows us then to determine the levels of 5hmC and 5mC on both DNA strands [23] and to determine the methylation status (hemimethylated, unmethylated or fully methylated) at each individual CpG dyad within the sequenced loci at single molecule resolution. To obtain a sufficient coverage (>1000x) per CpG we use very deep NGS based sequencing of selected loci. The deep sequencing enables us to determine accurate rates and error rates for each modification. To cover larger parts in the genome we included the analysis of mobile elements which occur in multiple identical copies across the genome and to which we refer as“repetitive elements”. In fact our analysis covers about 91% of all anno-tated IAP(IAPLTR1a_mM) (N = 1635), 20% of L1md_A (N = 3287), 12% for L1md_T (N = 2784) and 30% of MuERVL (N = 725). In this case the>1000x coverage has to be seen as the aggregate of about a 5x coverage of each individual copy of a given repetitive element.Fig 2 outlines the main experimental steps of the procedure.
In the first step genomic DNA is digested using restriction enzymes which generate cuts close to the gene/locus selected for methylation analysis. In a following reaction both DNA strands are ligated to a back-folding“hairpin”-oligonucleotide. Next the DNA is unfolded and subjected to a bisulfite or oxidative bisulfite treatment followed by a locus specific PCR amplifi-cation. PCR primers contain Mi-Seq (Illumina) compatible extensions to perform deep (paired end 2x300bp) sequencing (up to 10K/product). Sequencing data are processed using our in house software BiQ-HT and a python script. In the bisulfite only reaction 5mC and 5hmC remain as cytosines, while in the oxidative bisulfite reaction 5hmC is converted to uracil/thy-mine. Each individual sequence covers the hairpin linker which contains modified and unmod-ified cytosines at known positions. This allows us to monitor the efficacy of bisulfite and oxidative bisulfite reactions per molecule (note that all unmodified cytosines are converted to thymines) and calculate exact error rates by dividing the number of unconverted bases by the total number of analyzed cytosines. Additional information about the protocol is given inS1 Texttogether with reference-, primer- and linker-sequences.
Hidden Markov model
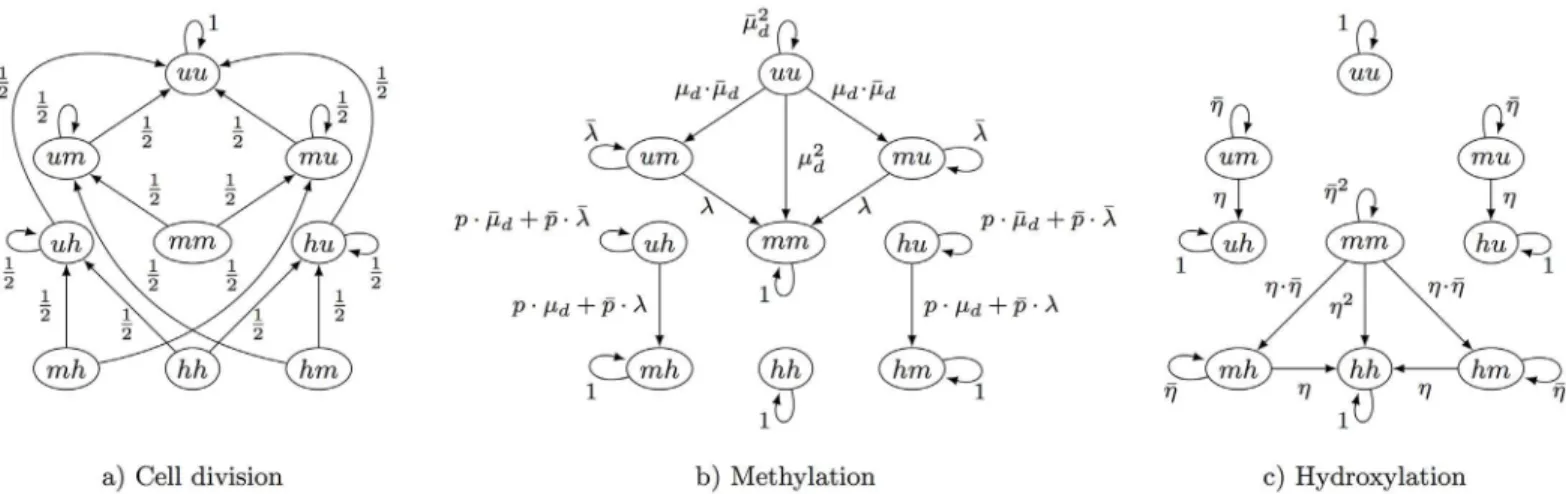
Our model considers a CpG site (alternatively dyad) over time and describes its state as a (dis-crete time) Markov chainfXðtÞ;t2Ngtaking values inS¼ fu;m;hg2
. Each state (s1,s2) (for
s1,s22{u,m,h}) encodes whether the upper strand (lower strand) isunmethylated(u),
methyl-ated(m) orhydroxylated(h). For instance, in state (s1,s2) = (u,h) the upper strand is
unmethy-lated and the lower strand is hydroxyunmethy-lated. We will often simply write (s1s2) instead of (s1,s2).
combined transition probability matrix ofXis defined as
PðtÞ ¼DðtÞ MðtÞ HðtÞ;
with entriesPij(t) that equal the probabilities that givenXðtÞ ¼i¼ ðs1s2Þ, the next state is
Xðtþ1Þ ¼j¼ ðs0
1s
0
2Þfor alli;j2S. Note here we assume that hydroxylation occurs after
methylation to ensure that between two cell divisions a transition fromutomand then tohis possible. Moreover, note that we allowP(t) to change over time, so that we capture the case that the (hydroxy-)methylation efficiencies do not remain constant over time. In the sequel we give a detailed description ofD(t),M(t), andH(t). For a formal definition of the matrices, we refer toS1 Text.
Demethylation through cell division. With each cell division and DNA replication one new DNA strand is synthesized resulting in a temporary situation where only unmodified cyto-sines are present in the new strand. Since the epigenetic pattern of the parental strand remains unchanged a previously methylated CpG site keeps half of the (hydroxy-)methylated state in the two daughter cells. By averaging over the daughter cells, if the current state is (mm) then after cell division the new state is (um) or (mu) each with probability 0.5 (depending on whether the newly synthesized strand is the upper or the lower strand). Similarly, with Fig 2. Schematic outline of hairpin bisulfite (BS) and oxidative bisulfite sequencing (oxBS) methods: The method is based on enzymatic digestion of genomic DNA and the covalent connection of upper and lower DNA strands by ligating a hairpin oligonucleotide.PCR enrichment of the BS/oxBS treated sample is used for amplicon generation followed by sequencing and data analysis.
probability 0.5 the process enters (uh) or (hu) from (hh). Thus, DNA replication/cell division may result in a direct loss of methyl or hydroxyl groups. The transition probabilities of the remaining states are defined in a similar way and we illustrate the corresponding matrixD(t) inFig 3a).
Methylation. The loss of methylation by DNA replication is counteracted by a restored methylation due to the combined activity of the three methyltransferases Dnmt1, Dnmt3a and Dnmt3b. We distinguish between maintenance methylation catalyzed by Dnmt1 and de novo methylation catalyzed by Dnmt3a and Dnmt3b. We assume that a cytosine of an unmethylated dyad can only be methylated by a de novo event, while both maintenance and de novo methyl-ation are possible on a hemimethylated dyad. Based on related in vitro experiments [3] and our recently published work [10], we assume that Dnmt3a/b act on hemimethylated sites with the same efficiency as on unmethylated sites.
We defineμm(t) andμd(t) as the probabilities of maintenance and de novo methylation of a cytosine, respectively, where the corresponding methylation event occurs within thet-th cell division cycle (t2{1, 2,. . .}). In addition, we defineλ(t) to be the total methylation efficiency on a hemimethylated site. It holds that
lðtÞ ¼mmðtÞ þmdðtÞ mmðtÞ mdðtÞ;
because maintenance is associated with the replication machinery and happens immediately after replication with efficiencyμm(t). In case maintenance methylation by Dnmt1 is not successful the site can still be methylated with de novo methylation efficiencyμd(t) which then givesλ(t) =μm(t) + (1−μm(t))μd(t). We writemmðtÞ ¼1 mmðtÞ;mdðtÞ ¼1 mdðtÞ andlðtÞ ¼1 lðtÞfor the complements of the above probabilities and we omit the time
parametertwhenever it is not relevant.
Note that if a CpG site has two unmethylated cytosines then two de novo methylation events are possible. Assuming independence between them, all transition probabilities of the corresponding state (uu) are the product of two event probabilities. We illustrate the corre-sponding methylation matrixM(t) inFig 3b). Herepis the probability that maintenance meth-ylation is not applied to the states (hu) and (uh), i.e., the hydroxyl group prevents the
maintenance process, i.e., the methylation of the unmodified cytosine on the opposite strand. As a result, from these states the states (hm) and (mh) can only be entered via de novo Fig 3. Possible transitions of the 9 different states of a CpG site.Methyl groups are a) removed after cell division, b) added due to maintenance (μm)
or de novo methylation (μd) and c) are hydroxylated (η) by Tet enzymes.
methylation. In the opposite case, with probabilityp¼1 p, states (hu) and (uh) are seen as
hemimethylated during maintenance and can enter states (hm) and (mh) with probabilityλfor both maintenance and de novo methylation (seeFig 3b). Besides, the states (mh), (hm), and (hh) have only self-loops since the Dnmts do not modify hydroxyl groups.
Hydroxylation. Letη(t) be the probability that before the (t+ 1)-th cell division a methyl-ated position becomes hydroxylmethyl-ated, i.e, the probability of a transition frommtoh. Similarly as above, we writeZðtÞfor 1−η(t) and omittwhenever convenient. Assuming again indepen-dence between two hydroxylation events, the corresponding matrixH(t) is illustrated inFig 3c). Note that without an active hydroxylation mechanism (η>0) the level of 5hmC would
half after each replication since newly synthesized strands do not inherit the hydroxyl groups of the mother strand.
Hydroxylation is the last modification that we consider before the next cell division. Thus, between two cell divisions an unmethylated position may transition fromutomand then toh.
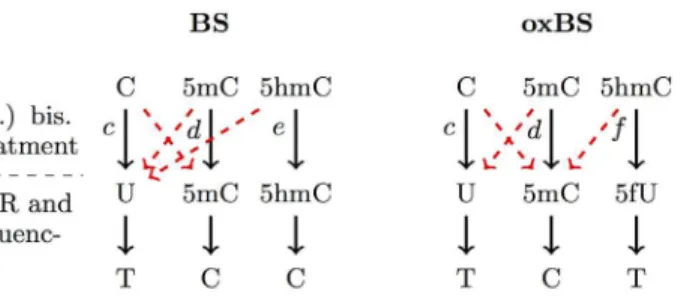
Observable states and conversion errors. In order to define the observable states and the corresponding emission probabilities, we first describe the details of hairpin sequencing and (oxidative) bisulfite sequencing. First the DNA is cut by a restriction enzyme. The DNA frag-ments are then linked covalent to a Hairpin linker resulting in the connection of upper and lower strand. The resulting hairpin fragments are divided into two halves, one is treated with a standard bisulfite reaction and the other is subjected to an oxidation followed by bisulfite treat-ment. Both 5mC and 5hmC are not affected by the (non-oxidative) bisulfite treatment and appear after sequencing as cytosines. In the oxidative case 5hmC is oxidized to 5fC which is converted during bisulfite treatment to 5fU and represents itself after sequencing as thymine (seeFig 4).
We incorporated unmodified cytosine as well as 5mC and 5hmC into the hairpin linker to precisely estimate the conversion errors (see alsoS1 Text) that influence the transition proba-bilities between the hidden and the observable states. These controls allow us to correct for technical errors in individual measurements.
InFig 4the transitions from a site’s possible hidden states to the observable ones are shown. Each base will eventually transform into a thymine (T) or a cytosine (C). Thus, the set of the observable states for a CpG site with two cytosines isS
obs¼ fT;Cg
2
:The red dashed arrows
cor-respond to conversion errors and assuming all errors are zero, i.e., the probabilitiesc=d=e=f of a correct conversion are all one, a C will eventually transform to T and a 5mC will transform to C in both bisulfite and oxidative bisulfite setups. However, a hydroxylated cytosine (5hmC) is ideally mapped to a C during BS and to a T during oxBS. The entries of the corresponding emis-sion matricesEbs(t) andEox(t) for the transitions from hidden to all observable states can be
Fig 4. Schematic outline of the conversion of Cytosine, 5mC and 5hmC during BS and oxBS treatment and after sequencing: In the bisulfite reaction a cytosine (C) is converted to uracil (U), whereas 5mC and 5hmC remain untouched.In the oxidative bisulfite sequencing only 5mC remains untouched and cytosine as well as 5hmC is converted to uracil (U). The conversion errors are illustrated as dashed red arrows andc,d,e,fare the conversion probabilities.
found in Table A inS1 Textand the values of the conversion errors from all analyzed loci for each of the experimental setups are listed inS1andS2Tables. Note that the values ofcanddcan differ between the two treatments and that the conversion probabilities can also differ over time.
Estimation of model parameters. Given the number of timesnbs(j,t) andnox(j,t) that statej2S
obs¼ fT;Cg
2
has been observed during independent BS and oxidative BS measure-ments at timetwe use a maximum likelihood approach to estimate the unknown parameters of the HMMs, that is, the initial distribution of the hidden states,S¼ fu;m;hg2, the unknown
functionsμd(t),μm(t) andη(t), as well as the probabilitypat which CpG sites with one hydroxyl group are not considered during maintenance.
Formally, letπ(t) be the row vector of the state probabilities of the hidden states aftertcell divisions, i.e.,π(0) is the initial distribution of the hidden states. Fori2Sletpði;tÞ ¼
PðXðtÞ ¼iÞdenote the entry ofπ(t) that corresponds to statei. The probability of observing
statej2S
obsat timetis given by
PðOðtÞ ¼jÞ ¼X
i2S
PðOðtÞ ¼jjXðtÞ ¼iÞ pði;tÞ;
whereOðtÞis the random variable for the state observed at timetandPðOðtÞ ¼jjXðtÞ ¼iÞ
is the emission probability. In matrix-vector form this yields
pbsðtÞ ¼pðtÞ E
bsðtÞ and poxðtÞ ¼pðtÞ EoxðtÞ
for the two sequencing experiments (BS and oxBS, respectively). Here,πbs(t) andπox(t) are the vectors with the distribution over the observable states at timet. Note that both HMMs have the same distributionπ(t) for the hidden states (as for both experiments the same cell population is used) but different emission probabilities and thatπ(t) is given by
pðtÞ ¼pð0Þ Qt
k¼1PðkÞ:
First, we estimate the initial distributionπ(0) based on the initial independent BS and oxida-tive BS measurements under conventional serum conditions by considering the combined like-lihood
L1ðpð0ÞÞ ¼ Y
j2Sobs
pbsðj;0Þnbsðj;0Þ
poxðj;0Þnoxðj;0Þ
: ð1Þ
The above likelihood depends only on the unknown vectorπ(0) and the emission matrices and allows us to determine the initial distribution of the hidden states. We maximize the likelihood subject to the constraint∑iπ(i, 0) = 1, i.e.,pð0Þ ¼arg max
pð0ÞL1ðpð0ÞÞ;whereπ(0) ranges
over all vectors that sum to one. Then, given an estimate forπ(0), we compute fort2{1, 2,. . .} the state probabilitiesπ(t) of the hidden states and consider the common likelihood
L2ðvÞ ¼ Y
t2Tobsnf0g Y
j
pbsðj;tÞnbsðj;tÞ
poxðj;tÞnoxðj;tÞ
ð2Þ
for the observations at all remaining observation time pointst2Tobs. Note that here we assume that the cells divide every 24 hours, hencetranges over all days at which measurements were made (see alsoS1 Text). In addition, we can assume independence between the observations because during the measurement only a small fraction of cells is taken out of a large pool and thus it is unlikely that we pick two cells with a common descendant.
The likelihoodL
2ðvÞdepends on the matricesP(t) and thus on the unknown functions
μd(t),μm(t),η(t) and the probabilityp. We assume that the enzymes’efficiencies are linear int, i.e., each function is of the formβ0+β1t, which yields a vectorvof seven unknown
v¼arg max
vL2ðvÞ;under the appropriate constraints (seeS1 Text). The maximization of
the likelihoods in Eqs (1) and (2) is a (global) optimization problem for which it is convenient to minimize the negative logarithm of the likelihood. Deriving expressions for thefirst and sec-ond derivatives of the log-likelihood is straightforward and yields fast convergence of the gradi-ent descgradi-ent optimization routine with multiple starting values. Due to the large number of samples we expect our maximum likelihood estimators (MLEs) to be approximately unbiased and normally distributed. Moreover, we can compute the observed Fisher information matrix (FIM) and thus derive confidence intervals for all parameters (for details seeS1 Text).
Results
Previous genome wide analyses showed a high or moderate decrease of DNA methylation in ESCs transferred from serum into 2i medium [21,22]. Furthermore, it was shown that the oxi-dation of 5mC to 5hmC is likely to contribute to this DNA demethylation [21]. The goal of our work was to develop a model which describes the 5hmC dependent molecular mechanisms that cause this loss of DNA methylation upon consecutive rounds of replication. For the modeling we generated an ultra deep DNA methylation data set of selected loci in mouse ES cells (ESCs) collected at defined time points after cultivation in 2i.
For our analysis we chose five multicopy, repetitive elements, IAPs (intracisternal A parti-cle), L1mdA and L1mdT (both Long interspersed nuclear elements), MuERVL (Murine endog-enous retrovirus) and mSat (major satellite), as well as four single copy loci in the genes Afp, Snrpn, Ttc25 and Zim3. It was already known that some of these repetitive elements are subject to demethylation. Ttc25 and Zim3 where previously shown to exhibit a less pronounced loss of methylation in the absence of Tet1/Tet2 in 2i medium. [21]. Imprinted genes such as Snrpn were shown to be“resistant”to demethylation in 2i.
Deep locus specific DNA methylation profiles were generated from mESCs grown in con-ventional serum/LIF medium (day0) and after their transfer and cultivation into 2i medium for 24h (day1), 72h (day3) and 144h (day6), respectively. During this period the ESCs undergo a maximum of six cell divisions (as inferred from cell densities). For each time point and locus we performed consecutive bisulfite and oxidative hairpin bisulfite reactions using high cover-age Mi-Seq sequencing (seeMethodssection). Following sequence processing (alignment, trimming, QC filtering) we obtained two data sets for each locus: one describing the combined 5mC+5hmC status (BS-Seq) and one describing the 5mC status alone (oxBs-Seq). The hairpin refolding of sequences then let us determine the accurate double stranded CpG methylation status at a given locus (hemi-, fully- or unmethylated).
With this data we used our HMMs (described in theMethodssection) to estimate the amount of 5mC and 5hmC in these loci and to predict the efficiencies of maintenance methyla-tion, de novo methylation and hydroxylation over time. In our modeling we analyzed both aggregated and single CpG behavior for each locus. Both average and single CpG modeling gave similar results. The single CpG data, summarized in the supplementary information (see S3andS4Figs), gave slightly increased confidence intervals compared to averaged data. In our further analysis we use averaged data for model interpretation.
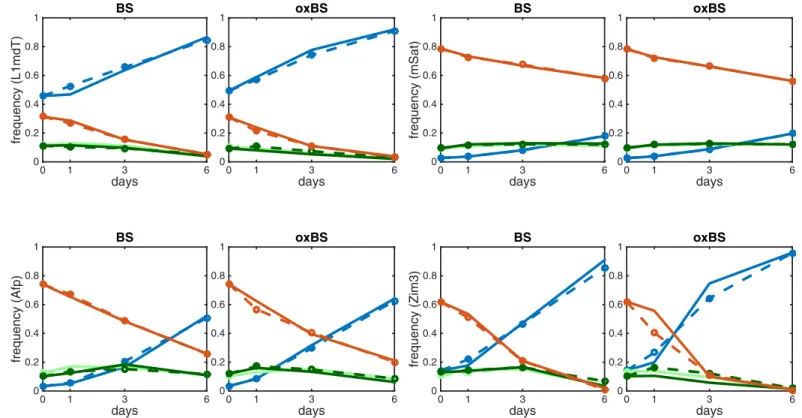
Using the estimated values of the model’s unknown parameters we could predict the proba-bilities of the observable states and compare them to the measured data at various time points. The model accurately describes the dynamics for all loci except for some underestimations of two states CC and TT for oxBs in Ttc25 and Zim3, respectively. (Fig 5andS1 Fig).
Fig 5. Comparison of predicted modification levels and the obtained sequencing data for BS and oxBS for the loci L1mdT left), mSat (top-right), Afp (bottom-left), Zim3 (bottom-right); TT (blue), TC (light green), CT (dark green), CC (red).The solid lines show the experimentally measured frequencies states and the dashed lines correspond to the values predicted by the two HMMs.
doi:10.1371/journal.pcbi.1004905.g005
Fig 6. Probabilities of the hidden states for L1mdT (top-left), mSat (top-right), Afp (bottom-left) and Zim3 (bottom-right): The left diagram depicts the amount of fully methylated (mm) sites in red color, hemimethylated (umandmu) sites in green color, and unmethylated (uu) sites in blue color.The orange block gives the total amount of CpG sites with at least one 5hmC(hidden states), while the detailed distribution of the hydroxylated states is given by the diagram on the right.
and unmethylated (uu) sites, as well as the total amount of the hydroxylated CpG dyads, i.e., those containing at least one 5hmC. The detailed level of all hydroxylated sites is depicted in the right diagram.
From previous experiments it was known that 5hmC levels initially increase during cultiva-tion in 2i [21,22]. However, precise levels had not been determined per locus. Our analysis provides the first accurate locus specific determination of 5hmC changes. Our estimation of 5hmC confirms an initial increase of hydroxylated cytosines over time for most loci besides L1mdA and Snrpn. L1mdA shows a low level of 5mC and 5hmC, which only slightly decreases in 2i. Snrpn also shows a relatively low level of 5mC and a non significant amount of 5hmC, which do not change in 2i over time (S2 Fig). The highest hydroxylation levels are found in the single copy genes Zim3 and Afp with a maximum level of 0.30 and 0.20. For Afp, mSat, IAP and MuERVL (seeFig 6andS2 Fig), the maximum hydroxylation level is seen at day6, while for L1mdT, Ttc25 and Zim3 at day3. The latter can be explained by the particularly low 5mC levels between day3 and day6 in these loci which naturally reduces the potential substrates for the Tet enzymes. However, the level of 5hmC (orange bar inFig 6andS2 Fig, left) relative to the total modification level (5hmC + 5mC) (red, orange and green bars), becomes maximal on the sixth day for all loci that show a loss of 5mC. This points towards an increasingly important role of 5hmC in the loss of methylation over time.
Indeed, the probabilityp(see HMM subsection) that a 5hmC site is not recognized by Dnmt1 (or the Dnmt1/Uhrf1 complex), which corresponds to states (hu) and (uh) in the model, is estimated to be 1 with very small standard deviations for all the loci that show signifi-cant 5hmC levels. We estimated smaller values forponly for those loci where hydroxylation is nearly absent (mSat, MuERVL, Snrpn).
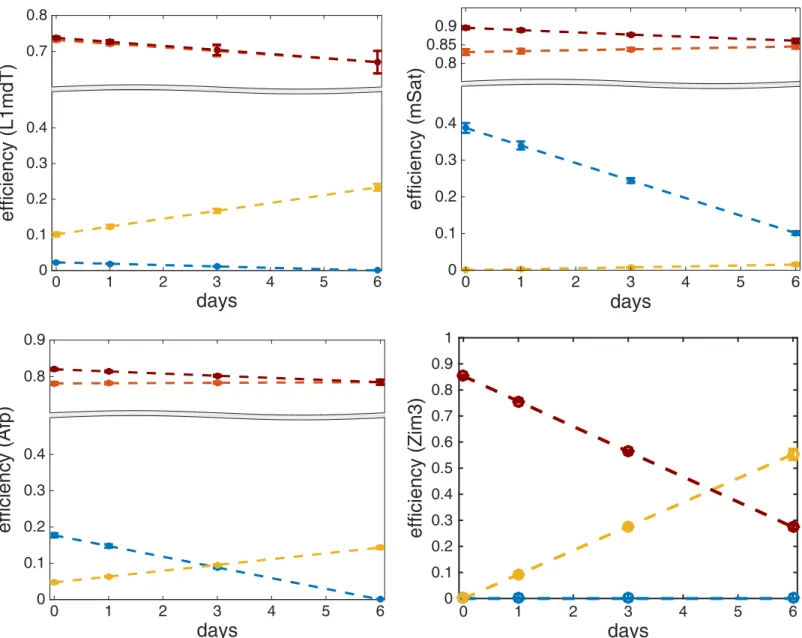
InFig 7we plot the functionsμm(t),μd(t),η(t) andλ(t) over time together with their esti-mated standard deviations. Note that the estiesti-mated standard deviations of all the efficiencies are very small (maximum half width of all confidence intervals is 0.031). For the exact estimates and their standard deviations seeS3andS4Tables. From the above efficiencies we can deduce the impact of de novo methylation activity on the hemimethylated dyads as the difference between the total methylation efficiency and maintenance methylation, i.e.,lðtÞ mmðtÞ ¼
mmðtÞ mdðtÞ(seeFig 7). Our data indicates that persistence of DNA methylation at Afp, mSat, IAP and MuERVL elements clearly depends also on de novo enzymes acting on hemimethylated CpGs.
For each efficiency, we performed a statistical test with a confidence level of 1% for the null hypothesis that the slope of the corresponding linear function is zero, i.e., that the efficiencies are constant over time (see in additionS1 Text). Furthermore, to eliminate the possibility of overfitting due to the linear assumption, we performed leave-one-out cross-validation (LOOCV) to estimate the test error of our model with constant efficiencies against a linear model. Results inS5 Tableshow that the linear assumption improves the prediction up to 38.3%. Further tests concerning the sensitivity of the model w.r.t. the parameters showed that the model is also sufficiently robust (seeS1 Text).
decrease ofμd(t) in the same loci, while in Afp both de novo methylation and hydroxylation show a moderate decrease and increase, respectively. At last, maintenance methylation seems to differ among loci. For all repetitive multicopy loci and Afp maintenance activity remains nearly constant while for Ttc25 and Zim3 it shows a significant decrease. For the imprinted Snrpn locus, where the methylation level remains constant, our model accurately predicts the apparently constantly high maintenance efficiency of 1.0. Altogether, these findings point towards a major impairment of maintenance methylation by 5hmC. Additionally, for each locus this impairment is modulated by a distinct combination of decreasing (e.g. Dnmt3a,b) or increasing (e.g. Tet) activities in a locus specific manner. Some of the locus specific differences may also have their origin in the particular methylation and (hydroxy-)methylation status present in serum/LIF before the shift into 2i.
Fig 7. The diagrams show the enzymatic efficiencies and their standard deviations for maintenance (red), de novo (blue), hydroxylation (yellow) and total efficiency on a hemimethylated CpG (dark red).Results are given for L1mdT (top-left), mSat (top-right), Afp left) and Zim3 (bottom-right) over time.
Discussion
The goal of our study was to investigate the role of 5hmC in the process of progressive DNA demethylation at single copy and mulitcopy loci across the genome. As a model system we used the DNA of ES cells grown under conditions where the cells experience a genome wide reduction of DNA methylation [21,22].
Using time dependent comparative bisulfite and oxidative bisulfite hairpin sequencing data we generated two HMMs: one that represents the dynamics of total modifications (5mC and 5hmC in BS) and the other only representing the 5mC levels (in oxBS). The comparison allowed us to accurately determine the amount and changes of 5hmC at certain genomic loci, to estimate the transient distribution of both 5mC and 5hmC in the DNA and to compute sta-tistically reliable estimates for the efficiencies of maintenance and de novo methylation, as well as for hydroxylation over time.
Our first finding is that 5hmC changes over time and can be modeled along with the overall changes in symmetric DNA methylation at CpGs. Our estimates give us an exact knowledge of 5hmC dynamics, which is congruent with the finding that several Tet enzymes are up-regu-lated in 2i medium [21,22]. The calculation of the hidden state probabilities and the efficien-cies of the different enzyme-driven processes show that the 5hmC dependent demethylation rates differ considerably from locus to locus. However, the dynamics of the (hydroxy-)methyla-tion levels for the CpGs of the same locus show a certain homogeneity (seeS3andS4Figs).
The second major finding is that loci with an enrichment of 5hmC such as Afp, L1mdT and IAP show higher demethylation rates compared to mSat or Snrpn. Hence, 5hmC containing DNA strands are indeed more likely to lose DNA methylation over time. Our modeling strongly supports the hypothesis that 5hmC is less well recognized by the maintenance methyl-ation machinery (Dnmt1/Uhrf1 complex) as indicated by the estimmethyl-ation of the corresponding non-recognition probabilityp. The accumulation of 5hmC then causes a passive dilution mechanism of CpG methylation with each DNA replication/cell cycle, despite of the fact that the model predicts a constant behavior of maintenance activity in most of the analyzed loci. In ES cells maintained in 2i medium this mechanism appears to be the main driving force for a rapid and linear DNA demethylation.
Interestingly, in contrast to the previously shown unchanged mRNA expression of Dnmt1 and Uhrf1 in 2i [21,22] we observe a strong decrease of maintenance function for the single copy genes Ttc25 and Zim3 (seeFig 7andS2 Fig, red line). Since the influence of 5hmC on the mainte-nance mechanism is reflected by the recognition probabilityp, the observed decrease is indepen-dent of the high 5hmC levels at these loci. This indicates an additional impairment or absence of the maintenance machinery at these loci. However, we cannot exclude the possibility that with the strong decrease in maintenance efficiency our model, at least to some extent, compensates for active demethylation which we cannot capture with our current experimental/model design.
Being able to estimate the de novo methylation impact of Dnmt3a/b on hemimethylated sites, the third observation of our model is that all analyzed elements show a compromised de novo methylation activity as an additional factor contributing to an enhanced local DNA demethylation. The predicted behavior for the involved enzymes’activities appears to follow their relative expression in 2i medium, in which both Dnmt3a and Dnmt3b are clearly down regulated [21,22]. Our observations, thus, suggest that the down regulation of Dnmt3a and Dnmt3b activities appears to enhance the 5hmC dependent CpG demethylation. This may be either directly due to a decreased methylation efficiency on hemimethylated sites or due to a lower abundance of the enzymes.
the mammalian genome. The modeling allows us to decipher complex DNA methylation pat-terns and enables us to accurately infer enzymatic activities. In its current form the model already captures a fraction of possible demethylation dynamics and scenarios most likely reflecting many loci in the genome. A genome wide application of our modeling is possible. It comes, though, at the expense of locus specific accuracy since with the existing whole genome hairpin sequencing methods data is difficult to generate and will not reach a sufficient sequencing depth. However, our approach can also be used to accurately model 5hmC depen-dent methylation dynamics in diseases, e.g. certain cancers and in aging processes of long lived cells. By integrating novel precise sequencing methods, which detect other oxidized modifications the model can be enhanced to additionally capture active demethylation and describe the involved processes.
Supporting Information
S1 Text. Details on the theoretical model, the parameter estimation, the statistical analysis of the results and the experimental procedure.
(PDF)
S1 Fig. Comparison of model prediction and data for IAP, L1mdA, MuERVL, Ttc25 and Snrpn.Plotted according toFig 5.
(PDF)
S2 Fig. Results for loci IAP, L1mdA, MuERVL, Ttc25 and Snrpn.Left: Probabilities of the hidden states. Plotted according toFig 6. Right: Estimated efficiencies and standard deviations over time. Plotted according toFig 7
(PDF)
S3 Fig. Estimated efficiencies and standard deviations for each single CpG dyad of repeti-tive elements IAP, L1mdA, L1mdT, mSat, MuERVL and single copy genes Afp, Ttc25, Zim3 and Snrpn over time.In the case of IAP we cover six CpG positions. However, during evolution CpG one and five underwent a transition resulting in a loss of the CpG positions in this particular IAP class. Furthermore, due to the lack of space we only show the first 6 CpGs out of 13, (8) CpGs, analyzed in L1mdA, (Zim3). The colormap is the same as inFig 7. (PDF)
S4 Fig. (Hydroxy-)methylation levels for each single CpG dyad of repetitive elements IAP, L1mdA, L1mdT, mSat, MuERVL and single copy genes Afp, Ttc25, Zim3 and Snrpn over time.The colormap is the same as inFig 6.
(PDF)
S1 Table. BS and oxBS data, Conversion Errors (repetitive elements). (PDF)
S2 Table. BS and oxBS data, Conversion Errors (single copy genes). (PDF)
S3 Table. Estimated coefficients of the functionsμd(t),μm(t) andη(t) and their approximate
standard deviations.The p-values have been taken conducting a hypothesis testH0:β1= 0
using the Wald statistic. (PDF)
S4 Table. Estimated coefficients of the functionλ(t) and their approximate standard devia-tions.The p-values have been taken conducting a hypothesis testH0 :bl
1 ¼0^b
l
the Wald statistic. (PDF)
S5 Table. Test error: Linear vs Constant Assumption.Computed Kullback-Leibler diver-gence and Bhattacharya distance values given by LOOCV data to compare the test error for assuming linear vs constant efficiencies.
(PDF)
S1 Dataset. Bs and oxBS data for single CpGs.The dataset contains the BS and oxBS data of each single CpG and loci after processing of the sequencing data; error rates are included as separate files. Raw sequencing data are available on request.
(ZIP)
Acknowledgments
We thank Jasmin Kirch and Katharina Faber for the technical assistance concerning sequenc-ing preparations.
Author Contributions
Conceived and designed the experiments: VW JW. Performed the experiments: PG GF. Ana-lyzed the data: PG CK. Contributed reagents/materials/analysis tools: GF. Wrote the paper: PG CK VW JW. Designed/implemented the software used in analysis: CK.
References
1. Bourc’his D, Bestor TH. Meiotic catastrophe and retrotransposon reactivation in male germ cells lacking Dnmt3L. Nature. 2004; 431(7004):96–99. doi:10.1038/nature02886PMID:15318244
2. Li E, Bestor TH, Jaenisch R. Targeted mutation of the DNA methyltransferase gene results in embry-onic lethality. Cell. 1992; 69(6):915–926. doi:10.1016/0092-8674(92)90611-FPMID:1606615
3. Okano M, Bell DW, Haber DA, Li E. DNA methyltransferases Dnmt3a and Dnmt3b are essential for de novo methylation and mammalian development. Cell. 1999; 99(3):247–257. doi:10.1016/S0092-8674 (00)81656-6PMID:10555141
4. Bird A, Taggart M, Frommer M, Miller OJ, Macleod D. A fraction of the mouse genome that is derived from islands of nonmethylated, CpG-rich DNA. Cell. 1985; 40(1):91–99. doi:10.1016/0092-8674(85) 90312-5PMID:2981636
5. Ehrlich M, Gama-Sosa MA, Huang LH, Midgett RM, Kuo KC, McCune RA, et al. Amount and distribu-tion of 5-methylcytosine in human DNA from different types of tissues or cells. Nucleic acids research. 1982; 10(8):2709–2721. doi:10.1093/nar/10.8.2709PMID:7079182
6. Okano M, Xie S, Li E. Cloning and characterization of a family of novel mammalian DNA (cytosine-5) methyltransferases. Nature genetics. 1998; 19(3):219–220. doi:10.1038/890PMID:9662389
7. Hermann A, Goyal R, Jeltsch A. The Dnmt DNA-(cytosine-C5)-methyltransferase methylates DNA pro-cessively with high preference for hemimethylated target sites. Journal of Biological Chemistry. 2004; 279(46):48350–48359. doi:10.1074/jbc.M403427200PMID:15339928
8. Bostick M, Kim JK, Estève PO, Clark A, Pradhan S, Jacobsen SE. UHRF1 plays a role in maintaining
DNA methylation in mammalian cells. Science. 2007; 317(5845):1760–1764. doi:10.1126/science. 1147939PMID:17673620
9. Sharif J, Muto M, Takebayashi Si, Suetake I, Iwamatsu A, Endo TA, et al. The SRA protein Np95 medi-ates epigenetic inheritance by recruiting Dnmt1 to methylated DNA. Nature. 2007; 450 (7168). PMID: 17994007
10. Arand J, Spieler D, Karius T, Branco MR, Meilinger D, Meissner A, et al. In vivo control of CpG and non-CpG DNA methylation by DNA methyltransferases. PLoS genetics. 2012; 8(6):e1002750. doi:10.1371/ journal.pgen.1002750PMID:22761581
12. Lepikhov K, Wossidlo M, Arand J, Walter J. DNA methylation reprograming and DNA repair in the mouse zygote. International Journal of Developmental Biology. 2010; 54(11):1565. doi:10.1387/ijdb. 103206klPMID:21404179
13. Tahiliani M, Koh KP, Shen Y, Pastor WA, Bandukwala H, Brudno Y, et al. Conversion of 5-methylcyto-sine to 5-hydroxymethylcyto5-methylcyto-sine in mammalian DNA by MLL partner Tet1. Science. 2009; 324 (5929):930–935. doi:10.1126/science.1170116PMID:19372391
14. Ito S, Shen L, Dai Q, Wu SC, Collins LB, Swenberg JA, et al. Tet proteins can convert 5-methylcytosine to 5-formylcytosine and 5-carboxylcytosine. Science. 2011; 333(6047):1300–1303. doi:10.1126/ science.1210597PMID:21778364
15. Zhang L, Lu X, Lu J, Liang H, Dai Q, Xu GL, et al. Thymine DNA glycosylase specifically recognizes 5-carboxylcytosine-modified DNA. Nature chemical biology. 2012; 8(4):328–330. doi:10.1038/nchembio. 914PMID:22327402
16. He YF, Li BZ, Li Z, Liu P, Wang Y, Tang Q, et al. Tet-mediated formation of 5-carboxylcytosine and its excision by TDG in mammalian DNA. Science. 2011; 333(6047):1303–1307. doi:10.1126/science. 1210944PMID:21817016
17. Hashimoto H, Liu Y, Upadhyay AK, Chang Y, Howerton SB, Vertino PM, et al. Recognition and poten-tial mechanisms for replication and erasure of cytosine hydroxymethylation. Nucleic acids research. 2012;p. gks155.
18. Wossidlo M, Nakamura T, Lepikhov K, Marques CJ, Zakhartchenko V, Boiani M, et al. 5-Hydroxy-methylcytosine in the mammalian zygote is linked with epigenetic reprogramming. Nature communica-tions. 2011; 2:241. doi:10.1038/ncomms1240PMID:21407207
19. Gu TP, Guo F, Yang H, Wu HP, Xu GF, Liu W, et al. The role of Tet3 DNA dioxygenase in epigenetic reprogramming by oocytes. Nature. 2011; 477(7366):606–610. doi:10.1038/nature10443PMID: 21892189
20. Dawlaty MM, Breiling A, Le T, Raddatz G, Barrasa MI, Cheng AW, et al. Combined deficiency of Tet1 and Tet2 causes epigenetic abnormalities but is compatible with postnatal development. Developmen-tal cell. 2013; 24(3):310–323. doi:10.1016/j.devcel.2012.12.015PMID:23352810
21. Ficz G, Hore TA, Santos F, Lee HJ, Dean W, Arand J, et al. FGF signaling inhibition in ESCs drives rapid genome-wide demethylation to the epigenetic ground state of pluripotency. Cell Stem Cell. 2013; 13(3):351–359. doi:10.1016/j.stem.2013.06.004PMID:23850245
22. Habibi E, Brinkman AB, Arand J, Kroeze LI, Kerstens HH, Matarese F, et al. Whole-genome bisulfite sequencing of two distinct interconvertible DNA methylomes of mouse embryonic stem cells. Cell stem cell. 2013; 13(3):360–369. doi:10.1016/j.stem.2013.06.002PMID:23850244
23. Laird CD, Pleasant ND, Clark AD, Sneeden JL, Hassan KA, Manley NC, et al. Hairpin-bisulfite PCR: assessing epigenetic methylation patterns on complementary strands of individual DNA molecules. Proceedings of the National Academy of Sciences. 2004; 101(1):204–209. doi:10.1073/pnas. 2536758100
24. Booth MJ, Branco MR, Ficz G, Oxley D, Krueger F, Reik W, et al. Quantitative sequencing of 5-methyl-cytosine and 5-hydroxymethyl5-methyl-cytosine at single-base resolution. Science. 2012; 336(6083):934–937. doi:10.1126/science.1220671PMID:22539555