Neuropsychological Outcome and Diffusion
Tensor Imaging in Complicated versus
Uncomplicated Mild Traumatic Brain Injury
William J. Panenka1*, Rael T. Lange1,2, Sylvain Bouix3, Jason R. Shewchuk4, Manraj K. S. Heran4, Jeffrey R. Brubacher5, Ryan Eckbo3, Martha E. Shenton3,6, Grant L. Iverson1,7 1Department of Psychiatry, University of British Columbia, Vancouver, Canada,2Defense and Veterans Brain Injury Center, Walter Reed National Military Medical Center, Bethesda, Maryland, United States of America,3Psychiatry Neuroimaging Laboratory, Brigham Women’s Hospital, Harvard Medical School, Boston, Massachusetts, United States of America,4Department of Radiology, University of British Columbia, Vancouver, Canada,5Department of Emergency Medicine, University of British Columbia, Vancouver, Canada,6VA Boston Healthcare System, Brockton, Massachusetts, United States of America,
7Department of Physical Medicine and Rehabilitation, Harvard Medical School, Spaulding Rehabilitation Hospital, & Red Sox Foundation and Massachusetts General Hospital Home Base Program, Boston, Massachusetts, United States of America
*wpanenka@mail.ubc.ca
Abstract
This study examined whether intracranial neuroimaging abnormalities in those with mild traumatic brain injury (MTBI) (i.e.,“complicated”MTBIs) are associated with worse sub-acute outcomes as measured by cognitive testing, symptom ratings, and/or diffusion tensor imaging (DTI). We hypothesized that (i) as a group, participants with complicated MTBIs would report greater symptoms and have worse neurocognitive outcomes than those with uncomplicated MTBI, and (ii) as a group, participants with complicated MTBIs would show more Diffusion Tensor Imaging (DTI) abnormalities. Participants were 62 adults with MTBIs (31 complicated and 31 uncomplicated) who completed neurocognitive testing, symptom ratings, and DTI on a 3T MRI scanner approximately 6-8 weeks post injury. There were no statistically significant differences between groups on symptom ratings or on a broad range of neuropsychological tests. When comparing the groups using tract-based spatial statistics for DTI, no significant difference was found for axial diffusivity or mean diffusivity. However, several brain regions demonstrated increased radial diffusivity (purported to measure mye-lin integrity), and decreased fractional anisotropy in the complicated group compared with the uncomplicated group. Finally, when we extended the DTI analysis, using a multivariate atlas based approach, to 32 orthopedic trauma controls (TC), the findings did not reveal sig-nificantly more areas of abnormal DTI signal in the complicated vs. uncomplicated groups, although both MTBI groups had a greater number of areas with increased radial diffusivity compared with the trauma controls. This study illustrates that macrostructural neuroimaging changes following MTBI are associated with measurable changes in DTI signal. Of note, however, the division of MTBI into complicated and uncomplicated subtypes did not predict worse clinical outcome at 6-8 weeks post injury.
a11111
OPEN ACCESS
Citation:Panenka WJ, Lange RT, Bouix S, Shewchuk JR, Heran MKS, Brubacher JR, et al. (2015) Neuropsychological Outcome and Diffusion Tensor Imaging in Complicated versus
Uncomplicated Mild Traumatic Brain Injury. PLoS ONE 10(4): e0122746. doi:10.1371/journal. pone.0122746
Academic Editor:Jan Kassubek, University of Ulm, GERMANY
Received:October 20, 2014
Accepted:February 12, 2015
Published:April 27, 2015
Copyright:This is an open access article, free of all copyright, and may be freely reproduced, distributed, transmitted, modified, built upon, or otherwise used by anyone for any lawful purpose. The work is made available under theCreative Commons CC0public domain dedication.
Data Availability Statement:All relevant data are within the paper.
Introduction
A substantial minority of patients who sustain a mild traumatic brain injury (MTBI) show trauma-related intracranial abnormality detected on day-of-injury computed tomography,
with prevalence rates varying from 5%[1] to nearly 40%[2] across studies[3]. When examining
these studies in more detail the wide range is partially attributable to differential enrollment of patients with lower Glasgow Coma Scale (GCS) scores of 13, and different referral patterns for
neuroimaging[3]. In addition to lower GCS scores, other clinical predictors of intracranial
Computed tomography [4] abnormalities following adult MTBI include the presence of skull
fractures, focal neurological signs, seizures, persistent vomiting, retrograde amnesia, age>60,
presence of coagulopathy, high likelihood mechanism (fall from height, pedestrian motor
vehi-cle accident), chronic alcohol use and previous neurosurgical procedure[5]. Magnetic
reso-nance imaging (MRI), if conducted routinely, would yield higher rates of structural
abnormalities following MTBI[6,7,8,9]. Those patients whose TBI severity falls in the mild
range (e.g., duration of loss of consciousness<30 min, Glasgow Coma Scale = 13–15, and
du-ration post-traumatic amnesia<24 hours), and who show neuroradiological evidence of a
trauma-related intracranial abnormality, have been conceptualized as having a complicated
MTBI[10]. Intuitively, we would expect that patients with complicated MTBI would have
worse outcome than those with normal imaging following MTBI (i.e., uncomplicated MTBI). However, the literature examining the relation between neuroimaging abnormalities and out-come following MTBI is inconsistent.
A review of studies comparing symptom reporting and functional and cognitive outcomes following MTBI in patients with and without intracranial imaging abnormalities is presented inTable 1. Not included in this list are a number of other studies where complicated or
uncom-plicated patients are compared solely with control patients,[11,12,13,14] or where imaging
ab-normalities are examined in the context of broader TBI severity[14,15,16,17].
A careful review of the literature lends some support to a negative relationship between the presence of intracranial abnormality and neurocognitive test performance in MTBI subjects (Table 1, 11 of 19 studies—58%); but in several of these studies the relationship is modest. In most studies that do show a relationship the effect sizes are smaller than expected, and
signifi-cance is obtained in only a subset of the cognitive battery employed[32].
Some studies suggest that complicated MTBI patients have different functional outcomes
than uncomplicated patients. In 4 of 13 studies that reported on outcome (seeTable 1),
compli-cated MTBI patients had greater problems as measured by the Glasgow Outcome Scale, the Functional Independence Measure, the Global Adaptive Functioning Scale, or return to work. Most studies, however, have not found a significant difference in functional outcomes (seeTable 1).
This is also the case for symptoms. Paradoxically there are more studies in the literature
sug-gesting that complicated MTBI patientsreport fewer symptomsas there are studies suggesting
that complicated MTBI patientsreport more symptoms. The most consistent symptomatic
find-ing in the complicated/uncomplicated literature is that these two groups are indistfind-inguishable in terms of symptom reporting, with 9 of the 13 studies not showing a significant difference (seeTable 1).
Diffusion tensor imaging (DTI) is now commonly used in MTBI research,[6,40] but it has
not been used explicitly to compare those with complicated versus uncomplicated MTBI. In DTI, the white matter tracts are analyzed in-vivo by inference from the local diffusion of water molecules. Commonly measured DTI parameters include fractional anisotropy (FA), mean
dif-fusivity (MD), radial difdif-fusivity (RD), and axial difdif-fusivity (AD)[40].FA is a representation of
the directional coherence (anisotropy) of water diffusion in the tissue, and is thought to be Outcome from Complicated vs Uncomplicated MTBI
PLOS ONE | DOI:10.1371/journal.pone.0122746 April 27, 2015 2 / 27
funders had no role in study design, data collection and analysis, decision to publish, or preparation of the manuscript.
Competing Interests:WJP–No competing financial
interests exists. RTL - No competing financial interests exists. SB - No competing financial interests exists. JRS - No competing financial interests exists. MKSH - No competing financial interests exists. JRB - No competing financial interests exists. RE - No competing financial interests exists. MES - No competing financial interests exists. GLI- Has been reimbursed and/or received honorariums from the government, professional scientific bodies, and commercial organizations for lectures relating to mild TBI and sport-related concussion at meetings, scientific conferences, and symposiums. He has a private consulting practice in forensic
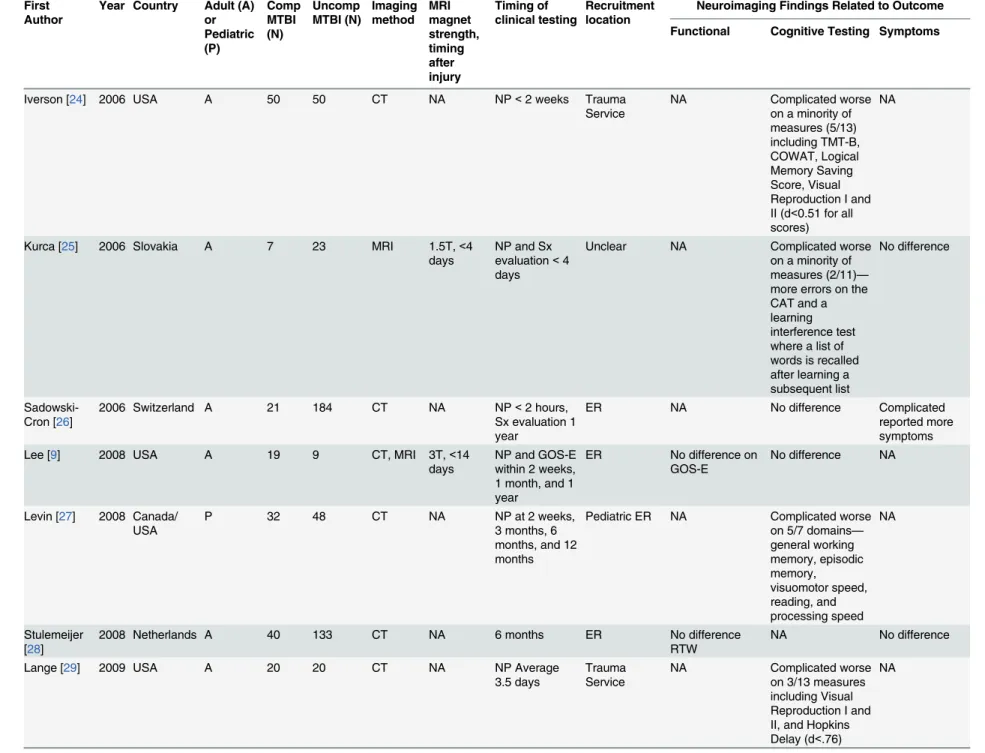
First Author
Year Country Adult (A) or Pediatric (P) Comp MTBI (N) Uncomp MTBI (N) Imaging method MRI magnet strength, timing after injury Timing of clinical testing Recruitment location
Neuroimaging Findings Related to Outcome
Functional Cognitive Testing Symptoms
Williams [10] 1990 USA A 77 78 CT NA NP after
clearing of PTA, GOS at 6 months
Neurosurgical service
Complicated less likely to show good recovery on GOS
Complicated worse on tests of processing speed and recognition memory, no difference on verbalfluency or verbal memory
NA
Hanlon [18] 1999 USA A 22 78 CT, MRI Not
reported
NP mean 177 days post injury, vocational at 1 year.
Outpatient No difference in vocational outcome
No difference NA
Iverson [19] 1999 USA A 112 369 CT NA NP—most
within 1 week of injury
Trauma Service
NA Complicated worse
on COWAT. No other tests were reported.
NA
Hofman [20] 2001 Netherlands A 12 9 MRI 1.5T, 2–5
days
NP and Sx evaluation<1 week, 2 months, and 6 months.
ER NA Complicated worse
on 1/6 measures—
Reaction time at 6 months
No difference
Borgaro [21] 2003 USA A 14 14 CT, MRI Magnet
strength not reported,< 40 days
NP<40 days Inpatient Rehabilitation
NA Complicated worse
on 1/7 subsets of the BNIS—speech/ language testing
NA
Hughes [22] 2004 UK A 26 54 MRI 1.0T, 1–3
days
NP<3 days, vocational status and Sx evaluation at 6 months
ER No difference on
return to work status
Complicated worse on a composite measure of attention, no difference on memory or executive functioning No difference
Lange [23] 2005 USA A 117 328 CT NA NP<23 days,
most<7 days
Trauma Service
NA Complicated worse
on TMT-A and TMT-B. Other tests were not reported.
Table 1. (Continued)
First Author
Year Country Adult (A) or Pediatric (P) Comp MTBI (N) Uncomp MTBI (N) Imaging method MRI magnet strength, timing after injury Timing of clinical testing Recruitment location
Neuroimaging Findings Related to Outcome
Functional Cognitive Testing Symptoms
Iverson [24] 2006 USA A 50 50 CT NA NP<2 weeks Trauma
Service
NA Complicated worse
on a minority of measures (5/13) including TMT-B, COWAT, Logical Memory Saving Score, Visual Reproduction I and II (d<0.51 for all scores)
NA
Kurca [25] 2006 Slovakia A 7 23 MRI 1.5T,<4
days
NP and Sx evaluation<4 days
Unclear NA Complicated worse
on a minority of measures (2/11)—
more errors on the CAT and a learning interference test where a list of words is recalled after learning a subsequent list
No difference
Sadowski-Cron [26]
2006 Switzerland A 21 184 CT NA NP<2 hours,
Sx evaluation 1 year
ER NA No difference Complicated
reported more symptoms
Lee [9] 2008 USA A 19 9 CT, MRI 3T,<14
days
NP and GOS-E within 2 weeks, 1 month, and 1 year
ER No difference on
GOS-E
No difference NA
Levin [27] 2008 Canada/
USA
P 32 48 CT NA NP at 2 weeks,
3 months, 6 months, and 12 months
Pediatric ER NA Complicated worse
on 5/7 domains—
general working memory, episodic memory, visuomotor speed, reading, and processing speed NA Stulemeijer [28]
2008 Netherlands A 40 133 CT NA 6 months ER No difference
RTW
NA No difference
Lange [29] 2009 USA A 20 20 CT NA NP Average
3.5 days
Trauma Service
NA Complicated worse
on 3/13 measures including Visual Reproduction I and II, and Hopkins Delay (d<.76)
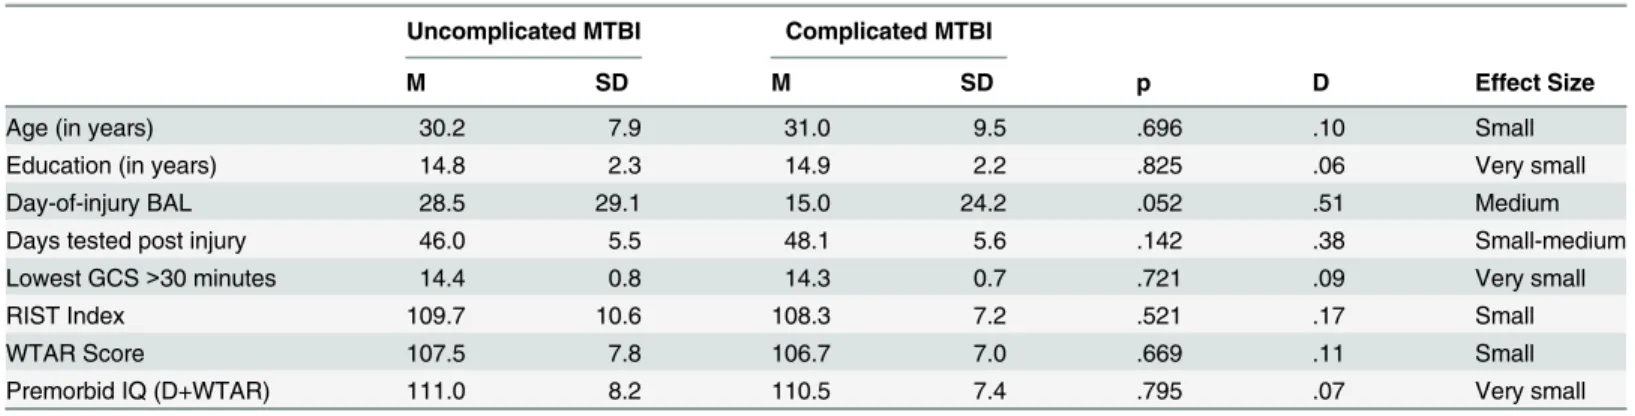
Author or Pediatric (P)
MTBI (N)
MTBI (N) method magnet strength, timing after injury
clinical testing location
Functional Cognitive Testing Symptoms
Muller [30] 2009 Norway A 15 45 CT, MRI <2 days NP before
discharge and at 6 months
Neurosurgery service
NA Complicated worse
at both time points on“mean impairment index”—a composite measure derived from a comprehensive NP battery NA de Guise [31]
2010 Canada A 45 131 CT NA NP at 3 weeks,
Sx evaluation at 2 weeks
Outpatient No difference GOS-E, no difference return to work or discharge referrals pattern
No difference Uncomplicated
reported more symptoms
Iverson [3] 2012 Finland A 13 34 CT, MRI 3T MRI,
3–4 weeks
NP at 3–4 weeks
ER Complicated
more time to return to work
No difference No difference
Lange [32] 2012 USA A 17 24 CT, MRI Magnet
strength not reported, timing in first few weeks
NP within 6 months of injury
Combat evacuated
NA Uncomplicated
group worse on 1/ 11 measures tested—CVLT-II long delayed recall (d = 0.86)
Uncomplicated worse on a minority of PAI subscales—
anxiety (d = .74) and aggression (d<0.72).
Babcock[33] 2013 USA P 14 206 CT NA Symptoms at 3
months
ER NA NA No difference
Beauchamp [34]
2013 Australia P 13 58 CT, MRI 3T MRI,
2–8 weeks
NP, outcome measures at 6 months
ER Global adaptive
functioning—no difference
No difference NA
Dagher [35] 2013 Canada A 1,483 644 CT NA Outcome
measures at discharge
Inpatient Complicated
longer length of stay, worse on GOS-E and FIM
NA NA
McMahon [36]
2013 USA A 165 210 CT, MRI NA Sx and
outcome evaluation at 3,6, and 12 months
ER Complicated
worse on GOS-E at 3 months, no difference at 6 or 12 months
NA Uncomplicated
reported more symptoms
Lannsjo[37] 2013 Sweden A 52 1210 CT NA 3 months ER No difference on
GOSE
NA No difference
Table 1. (Continued)
First Author
Year Country Adult (A) or Pediatric (P)
Comp MTBI (N)
Uncomp MTBI (N)
Imaging method
MRI magnet strength, timing after injury
Timing of clinical testing
Recruitment location
Neuroimaging Findings Related to Outcome
Functional Cognitive Testing Symptoms
Yuh [8] 2013 USA A 64 71 CT, MRI 3T,
average 12 days
GOS-E at 3 months
ER Group with any
CT abnormality showed no difference on GOS-E. Note: Subgroup of patients with Diffuse axonal injury, contusions, or subarachnoid hemorrhage worse on GOS-E at 3 months)
NA NA
Yuh[39] 2014 USA A 32 44 CT, MRI 3T 3 and 6 months ED No difference
GOS-E Note: Subgroup with MRI contusions associated with worse outcome at 3 months only (see text).
No difference on CVLT-II, WAIS-IV-PSI, TMT-A, TMT-B
No difference
Abbreviations: Comp = Complicated; Uncomp = Uncomplicated; NP = Neuropsychological testing; PTA = Post-Traumatic Amnesia; Sx = symptoms, ER = emergency room, GOS = Glasgow Outcome Scale; GOS-E = Glasgow Outcome Scale Extended, FIM = Functional Independence Measure; RT = Reaction Time; COWAT = Controlled Oral Word Association Test; TMT = Trail Making Test; BNIS = Neuropsychological Instrument BNI Screen for Higher Cerebral Functions; CVLT-II = California Verbal Learning test II; CAT = Concentration and Attention Test; SF-36 = Short-Form health survey; HI-FI = Head Injury Family Interview Checklist; WAIS IV-PSI = Weschler Adult Intelligence Scale IV edition processing speed index, RPQ = Rivermead Post-Concussion Symptom Questionnaire
doi:10.1371/journal.pone.0122746.t001
Outcome
from
Complicated
vs
Uncomplic
ated
MTBI
PLOS
ONE
|DOI:10.137
1/journal.p
one.0122746
April
27,
2015
6/2
proportional to the anatomical integrity of white matter tracts[40]. MD represents the average total diffusion of water within a particular voxel, irrespective of direction, and in general MD
values are found to be increased in response to white matter injury.[40] RD represents the
dif-fusion of water perpendicular to the axon, and thus is thought to be sensitive to processes such
as demyelination.[41] AD represents the diffusivity parallel to the axon and hence changes in
AD are thought to indicate axonal compromise[41].
The anatomical areas showing DTI abnormalities in those patients who have sustained MTBI vary considerably among studies. The inherently heterogeneous nature of brain trauma, methodological differences such as time of scanning after injury, magnet strength, and differ-ences in post-processing techniques all account for part of this variance. Some anatomical areas, however, appear to be consistently reported as more vulnerable to the effects of MTBI. According to a meta-analysis of DTI findings in MTBI, the corpus callosum (CC) is the
struc-ture[42] most consistently reported as abnormal. A recent systematic review of DTI findings in
sport concussion concluded that the CC, internal capsule, and the longitudinal fasciculi were
the most frequently reported areas with abnormalities[43]. The frontal association pathways,
including the uncinate fasciculus, superior longitudinal fasciculus, and anterior corona radiata
may also be vulnerable[44]. The predominant subacute-chronic DTI finding is a decrease in
FA, an increase in MD, and radial and axial values that following a more complicated temporal
course[41]. Several DTI studies show a correlation between DTI metrics and neurocognitive
testing[40]. The data on post-concussive symptoms and DTI measurements, however, is
mixed, with some studies showing a correlation,[45,46,47,48,49] and other studies not showing
a significant association[50,51]. For a comprehensive review of DTI findings in MTBI, and
their relation to neurocognition and symptoms, the reader is referred to three recent works [6,12,40].
The purpose of this study is to examine the influence of trauma-related intracranial abnor-malities, as evidenced by CT and MRI, on subacute neurocognitive outcome, post-concussion symptom reporting, mental health, and the microstructural architecture of white matter. We hypothesized that (i) the complicated MTBI group would report more symptoms and have worse neurocognitive outcomes than the uncomplicated MTBI group, and (ii) the complicated MTBI group would show a greater degree of white matter compromise, most notably in the re-gion of the CC, compared to the uncomplicated MTBI group.
Materials and Methods
Research Ethics
This study was approved by the Clinical Research Ethics Board at the University of British Co-lumbia, Vancouver, Canada. All participants gave written informed consent prior
to participation.
Participants
Participants were 62 patients with MTBI (31 uncomplicated and 31 complicated) who were re-cruited (between 2007 and 2012) from the Emergency Department of Vancouver General Hos-pital (VGH), British Columbia, Canada. Participants were included in the MTBI group if they (a) presented to the Emergency Department following head trauma, and (b) had evidence of a closed TBI as indicated by at least one of the following: (a) witnessed loss of consciousness (LOC) of at least one minute duration, (b) post-traumatic amnesia (PTA) of more than 15
min-utes, or (c) Glasgow Coma Scale (GCS) score = 13–14. Classification of brain injury severity
was based on the duration of loss of consciousness (LOC), duration of post-traumatic amnesia
follows: (a) uncomplicated mild TBI: LOC<30 minutes, GCS = 13–15, PTA<24 hours, and
no trauma-related intracranial abnormality on day-of-injury CT or 6–8 week structural MRI
scan; (b) complicated mild TBI: LOC<30 minutes, GCS = 13–15, PTA<24 hours, and
trau-ma-related intracranial abnormality on day-of-injury CT scan and/or 6–8 weeks later on
struc-tural MRI scan. Of the 31 patients classified as complicated injuries, 16 had abnormalities on
day-of-injury CT and 15 did not (the 15 were identified on MRI at 6–8 weeks following injury).
MTBI criteria as set forth by the World Health Organization working group[52] and the
Amer-ican Congress of Rehabilitation Medicine Special Interest Group[53] were met for all subjects,
but the criteria for MTBI in this study were more rigorous (see above) than both of those diag-nostic systems to avoid enrolling false positives or those with equivocal mild injuries.
A control sample of 32 patients was recruited from the Emergency Department of VGH and they were initially included if (1) they sustained a soft-tissue or orthopedic injury below the neck; (2) there was no evidence of an altered state of consciousness as indicated by a reduc-tion in GCS score, or presence of a LOC, PTA, or post-traumatic confusion; and (3) there was no evidence of physical head trauma, whiplash, or cervical strain based on medical chart review (e.g., absence of lacerations/contusions to the head, absence of complaints of head, neck, or back pain).
These patients represent a subset from a larger longitudinal cohort MTBI study that began recruiting in June of 2007. VGH emergency department records were screened for trauma ad-missions between the ages of 19 and 55, who also had a blood alcohol level (BAL) measured on the day of injury. Exclusion criteria included the inability to communicate effectively in En-glish; educated in a language other than English after age 10; history of serious neurological dis-order, TBI, learning disability, or psychiatric illness resulting in hospitalization; presence of MRI contraindications; significant drug abuse other than alcohol; restricted use of hands/arms for neuropsychological testing; or serious difficulties with eyesight.
Following medical chart review, patients without obvious exclusion criteria were contacted and assessed for their willingness to participate and to undergo a comprehensive review of in-clusion/exclusion criteria. English language difficulties, mental or neurological disorder, illicit drug use, equivocal TBI (for TBI group only), contraindication for MRI, and presence of learn-ing disability or attention-deficit hyperactivity disorder were frequent reasons for exclusion. Participants in the TBI group that agreed to participate did not differ from those who declined in age, day of injury BAL, GCS scores (at site of injury or on admission to hospital), gender, or presence of intracranial abnormality. Complicated and uncomplicated MTBI groups were cre-ated by querying the full database for subjects with MTBI.
Participant Selection. Participants were selected from a sample of 170 patients enrolled in a larger study (105 MTBI and 65 TC) in a three-step manner. First, participants were initially included in the sample if they met the following criteria: (1) completed the entire neuropsycho-logical test battery; (2) neurocognitive test performance was not considered influenced by re-duced English language proficiency; (3) scored above the recommended cutoff for good effort on the Test of Memory Malingering; (4) behavioral observations during the neuropsychologi-cal evaluation did not provide suspicion of questionable motivation or inattention that may have negatively influenced test performance; (5) successfully completed MRI scanning; (6) there was no evidence of obvious incidental neurological abnormalities on MRI such as menin-gioma, cistern mass, venous anomaly; and (7) structural MRI scans were considered complete and readable by a neuroradiologist. In addition, in the MTBI group, participants were only in-cluded if (8) there was no evidence of intracranial abnormality that was considered to pre-date the current injury. Similarly, in the TC group, participants were only included if (9) they had maximum of one white matter hyperintensity visible on MRI (WMHI) because it has been re-ported that having two or more white matter hyperintensities is associated with DTI
Outcome from Complicated vs Uncomplicated MTBI
abnormalities in brain regions distal from these abnormalities[54,55]. The application of these criteria resulted in retaining 127 participants [40 TC and 87 MTBI (i.e., 41 uncomplicated MTBI, 46 complicated MTBI)].
Second, in order to control for the influence of age and pre-injury alcohol consumption, participants were further excluded if they were 50 years or older or if their pre-injury alcohol consumption was considered to be unusually high. Unusually high pre-injury alcohol con-sumption was defined as drinking more than 30 drinks per week and/or binge drinking more than four or more days per week (binge drinking = 5 or more drinks on any one occasion). This level of alcohol consumption, which is liberal, was chosen in part because the dementia
lit-erature occasionally defines up to four drinks/day as moderate, and“very heavy drinking”as at
least five drinks/day (for a recent meta-analytic review see Anstey et al, 2009[56]). The
applica-tion of these criteria resulted in retaining 110 participants [36 TC and 74 MTBI (i.e., 38 uncom-plicated MTBI, 36 comuncom-plicated MTBI)].
Third, prior to DTI post-processing, the MRI scans were inspected for image quality. Scans were dropped if they exhibited significant motion artifact or brain coverage was inadequate. The application of these criteria resulted in retaining a final sample of 94 participants [32 TC subjects and 62 MTBI subjects (i.e., 31 uncomplicated MTBI, 31 complicated MTBI)].
Measures
Participants completed a 5-hour neuropsychological assessment battery that included mea-sures of neurocognitive functioning, post-concussion symptoms, mental health, and substance
use history approximately 6–8 weeks post injury (M = 47.1 days, SD = 5.6). All participants
gave written informed consent in accordance with the Clinical Research Ethics Board at the University of British Columbia, Vancouver, Canada.
Symptom Measures. Participants completed the Beck Depression Inventory-Second
Edition (BDI-II), Beck Anxiety Inventory [57], and the British Columbia Post-concussion
Symptom Inventory (BC-PSI). The BDI-II[58] and BAI[59] are both 21-item self-report
ques-tionnaires designed to assess depressive and anxiety symptoms respectively. Participants are asked to rate each item on a four-point scale ranging from 0 to 3. A total score is calculated by summing all 21 items on each measure separately, giving a total score on each measure with a range from 0 to 63.
The British Columbia Post-Concussion Symptom Inventory (BC-PSI)[60,61] is based on
ICD-10 criteria[62] for Postconcussional Syndrome and requires the test taker to rate the
fre-quency and intensity of 13 symptoms (i.e., headaches, dizziness/light-headedness, nausea or feeling sick, fatigue, sensitivity to noises, irritability, sadness, nervousness/tension, temper problems, poor concentration, memory problems, reading difficulty, and sleep disturbance) as well as the effect of three co-occurring life problems on daily living (i.e., greater present versus past effects of alcohol consumption, worrying and dwelling on symptoms, and self-perception
of brain damage). The three life problems are rated on a scale from one to five, where 1 =“not
at all”and 5 =“very much”. The 13 symptoms are rated on a six-point Likert-type rating scale
that measures the frequency (i.e.,“how often”) and intensity (“how bad”) of each symptom in
the past two weeks. Frequency ratings range from 0 =“not at all”to 5 =“constantly”. Intensity
ratings range from 0 =“not at all”to 5 =“very severe problem”. For each of the 13 symptoms,
Neurocognitive Measures. The neurocognitive measures consisted of 16 tests from the
Neuropsychological Assessment Battery (NAB;[63]). The NAB is a comprehensive, co-normed
(across all tests) neuropsychological test battery that consists of 24 individual tests designed to assess cognitive functioning across five domains: Attention, Language, Memory, Spatial, and Executive Functioning. The normative sample is large and the coverage of neuropsychological abilities assessed is broad. The NAB can be used in a fixed or flexible manner. Only 16 of the 24 tests were selected for use in order to reduce administration time. The administration of the 16 selected tests results in the acquisition of 23 scores of interest. In order to reduce the number of cognitive variables for the analyses, the 23 scores of interest were used to generate index scores for each of the five cognitive domains. The Attention and Memory indexes were gener-ated as per the instructions in the manual. For the Language, Spatial, and Executive Function-ing Indexes, however, not all subtests included in these indexes were administered. As such, these indexes were prorated. These three indexes were calculated by generating a prorated
‘Sum of T-scores’and then converting the prorated‘Sum of T-scores’to a standard score
using the look-up table (i.e., Table 7.1) in the NAB normative manual[64]. The prorated Sum
of T-scores for the three indexes was calculated by averaging the demographically adjusted T-scores across all available subtests that are included in each index. The mean T-score was then multiplied by the number of subtests that are used to generate the full version of the index. For the Language Index, two of five possible subtests were used (i.e., Oral Production and Naming). For the Spatial Index, two of four possible subtests were used (i.e., Visual Dis-crimination and Design Construction). For the Executive Functioning Index, three of four pos-sible subtests were used (Categories, Mazes, and Word Generation). A NAB Total Index was also generated using the standard scores derived for the five indexes above as per the instruc-tions in the manual.
Participants were also administered the Test of Memory Malingering[65] to evaluate the
possibility of the patient providing poor effort during testing. No subject was excluded due to poor effort.
Neuroimaging
MRI data were acquired on a Philips Achieva 3T scanner with Dual Nova Gradients (maxi-mum gradient strength 80 mT/m, maxi(maxi-mum slew rate 200 mT/m/s) and an 8-channel phased array head coil in parallel imaging mode. Diffusion tensor imaging data were acquired using an eddy current compensated, single-shot, spin-echo, echo planar imaging sequence with unipolar diffusion weighting along 16 noncollinear directions and a maximum b value of 1000 s/mm2.
Further DTI parameters were as follows: acquisition matrix 9696, 50 contiguous slices,
2.5
2.5
2.5mm isotropic acquisition resolution, time to echo 75 ms, time to repetition 5600 ms, parallel imaging SENSE-factor = 2.4.
The structural T1 and FLAIR images were reviewed by a board certified radiologist (JRS or MKSH) who determined whether any visible trauma related intracranial pathology was pres-ent. Pertinent MRI findings that were coded for all patients included the number and location of susceptibility foci, T2 hyperintensities, encephalomalacia, and extra-axial collections
Tract-based Spatial Statistics. (TBSS[66] and Randomise[67] part of the FMRIB Software
Library (FSL, Analysis Group, FMRIB, Oxford, UK)[68] was used for comparisons of FA, MD,
AD and RD. DTI sequences with poor field-of-view resulting in significant deficits in whole brain coverage or artifacts were not considered in the analysis. Motion and artifacts in the dif-fusion data were corrected using affine registration of all gradient volumes with the b = 0 volume (FLIRT; FMRIB Software Library, Oxford, UK), and gradient directions were
compen-sated for rotations[69]. This was followed by creation of a manual brain mask based on the
Outcome from Complicated vs Uncomplicated MTBI
b = 0 image using 3D Slicer version 2.7[70]. Individual FA maps were then non-linearly regis-tered via FSL-FNIRT to the JHU-ICBM FA template provided by FSL, followed by creation of a mean FA skeleton. Individual FA values were then projected onto this mean skeleton. MD, AD, and RD values were projected onto the skeleton using the previously created FA transfor-mation. FA threshold was set to 0.25 and voxel-based comparisons of FA, MD, AD, and RD
were performed on the TBSS skeleton using Randomise [67]from FSL Version 4.1.9[66]. with
the number of permutations was set at 5000 and threshold-free cluster enhancement (TFCE)
with correction for family wise error rate employed. The p<.05 T-contrast maps were projected
on the mean FA images. To identify which specific anatomical areas were implicated, the mean FA skeleton and contrast map were overlaid with the John Hopkins University (JHU)
Interna-tional Consortium Brain Mapping (JHU-ICBM-DTI-81) white matter label atlas[71,72,73].
FSL statistics were then used to compute the mean FA values for each individual for each of the regions of interest (ROIs) on the mean FA skeleton. Mean values for MD, AD, and RD were done similarly. Forty-eight individual ROIs were identified according to the International
Consortium of Brain Mapping (ICBM) DTI-81 white-matter labels atlas[71,72,73].
The ROIs from the ICBM-DTI-81 atlas included the (a) genu, body, and splenium of corpus callosum; (b) pontine crossing tract, fornix, and middle cerebellar peduncle; and (c) symmetri-cal ROIs (left/right) each for the corticospinal tract, medial lemniscus, inferior cerebellar pe-duncle, superior cerebellar pepe-duncle, cerebral pepe-duncle, anterior limb of internal capsule, posterior limb of internal capsule, retrolenticular part of internal capsule, anterior corona radi-ata, superior corona radiradi-ata, posterior corona radiradi-ata, posterior thalamic radiation, sagittal stratum, external capsule, cingulum (cingulate gyrus), cingulum (hippocampus), fornix/stria terminalis, superior longitudinal fasciculus, superior fronto-occipital fasciculus, uncinate fas-ciculus, and tapetum.
Due to the large number of ROIs, four summary scores were calculated for each participant and used in all statistical analyses. The four summary scores represent the number of ROIs with FA, MD, AD, and RD values that fell below/above a specified cutoff score for each partici-pant. Cutoff scores were identified by calculating the means and standard deviations (SD) for FA, MD, AD, and RD values in each of the 48 ROIs based on DTI of 36 participants who were recruited for this study, that had sustained an orthopedic injury, but not a TBI. FA values that
were>2 SDs below the mean, and MD, AD, and RD values that were>2 SDs above the mean,
were classified as reflecting an ROI with“compromised white matter”(i.e., abnormal score).
Results
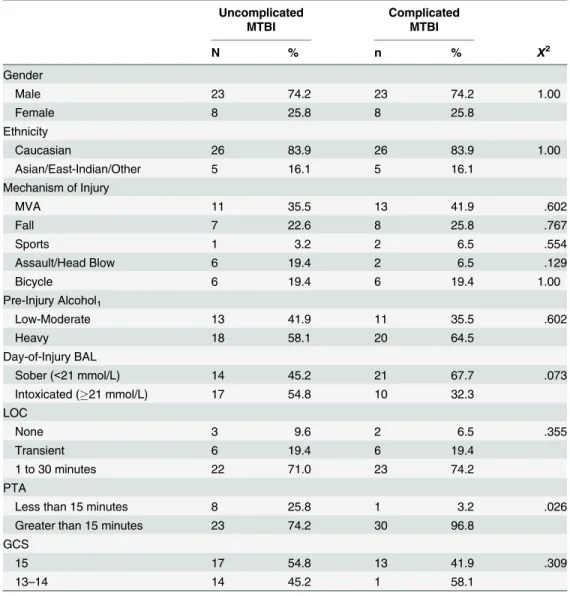
Comparisons between Uncomplicated and Complicated MTBI Groups
Descriptive statistics and group comparisons (using ANOVA and Chi square analyses) of
de-mographics and injury characteristics are presented in Tables2and3. The groups did not
dif-fer significantly in age, education, gender, ethnicity, mechanism of injury, days tested post injury, lowest GCS score, duration of LOC, pre-injury alcohol intake, current intellectual abili-ty, or estimated pre-morbid intellectual ability. There was, however, a significant difference for duration of PTA (p = .026). Participants in the complicated MTBI group were more likely to have a longer duration of PTA (96.8%) compared to the uncomplicated MTBI group (74.2%). Although not significantly different (p = .052), there was a medium effect size for day-of-injury BAL (d = .51, medium effect size), with the uncomplicated group having a slightly higher BAL on presentation to the Emergency Department.
other sixteen participants in the complicated group had trauma-related abnormalities on fol-low-up MRI, but not on their day-of-injury CT scan. The traumatic abnormalities identified on MRI were as follows: greater than five susceptibility foci in sixteen subjects, two to five sus-ceptibility foci in severn subjects, and one sussus-ceptibility focus in four subjects. Traumatic ab-normalities identified on CT included parenchymal contusions in six subjects, subarachnoid hemorrhage in nine subjects, subdural hemorrhage in four subjects, and diffuse axonal injury in two subjects.
By group definition, no patient in the uncomplicated group had abnormalities that could be attributed to the trauma on either day-of-injury CT scan (ordered for 30 of the 31 uncompli-cated MTBIs), or subsequent MRI. Subgroup analyses between those with CT and MRI abnor-malities, versus those with only MRI abnorabnor-malities, were not undertaken, however, due to the small sample sizes.
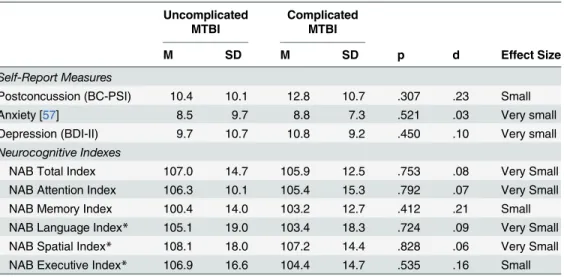
Neurocognition and Symptom Reporting
Descriptive statistics, group comparisons, and effect sizes for three self-report measures and
the six NAB indexes are presented inTable 4. There were no significant differences (using
Mann-Whitney U-tests due to a non-normal distribution) between groups on any of the self-report measures including post-concussion symptom self-reporting (p = .307), anxiety symptoms as measured by the Beck Anxiety Inventory (p = .521), or depressive symptoms as measured by the Beck Depression Inventory-Second Edition (p = .450).
Similarly, there were no significant differences (using ANOVA) between groups on the NAB Total Index (p = .753, d = .08, very small effect size) or any of the five NAB Index or pro-rated Index scores (range: p = .535 to p = .828; d = .06 to d = .21; very small to small effect
sizes).Table 5presents the results of exploratory analyses comparing groups on all of the
primary individual test scores from the NAB revealed no statistically significant differences
between groups on any of the 23 measures (all p>.05). Very small (e.g., d<0.15) to small
(e.-g., 0.15<d<0.35) effect sizes were found on the majority of measures, with the exception of
three measures that had medium effect sizes (e.g., d>0.35). The complicated MTBI group had
non-significantly better scores on Digits Forwards (d = .45) and Daily Living Memory (d = .43) compared to the uncomplicated MTBI group. In contrast, the uncomplicated MTBI group had
Table 2. Descriptive statistics, group comparisons, and effect sizes of demographic and injury severity characteristics (continuous variables) by group.
Uncomplicated MTBI Complicated MTBI
M SD M SD p D Effect Size
Age (in years) 30.2 7.9 31.0 9.5 .696 .10 Small
Education (in years) 14.8 2.3 14.9 2.2 .825 .06 Very small
Day-of-injury BAL 28.5 29.1 15.0 24.2 .052 .51 Medium
Days tested post injury 46.0 5.5 48.1 5.6 .142 .38 Small-medium
Lowest GCS>30 minutes 14.4 0.8 14.3 0.7 .721 .09 Very small
RIST Index 109.7 10.6 108.3 7.2 .521 .17 Small
WTAR Score 107.5 7.8 106.7 7.0 .669 .11 Small
Premorbid IQ (D+WTAR) 111.0 8.2 110.5 7.4 .795 .07 Very small
Note: N = 62 (Uncomplicated MTBI, n = 31; Complicated MTBI, n = 31); Abbreviations: BAL = blood alcohol level; GCS = Glasgow Coma Scale; RIST = Reynolds Intellectual Screening Test; IQ = Intelligence Quotient; WTAR = Wechsler Test of Adult Reading, D+WTAR is demographic information combined with the reading score to estimate Full Scale IQ.
doi:10.1371/journal.pone.0122746.t002
Outcome from Complicated vs Uncomplicated MTBI
non-significantly better scores on Word Generation (d = .35) compared to the complicated MTBI group (p = .083 to p = .181).
The neurocognitive measures were further examined by calculating the number of low scores across the entire battery of tests. Low scores were defined as demographically-adjusted
T-scores less than 40 (below the 16thpercentile) or less than 37 (below the 10thpercentile). The
frequency distributions of individuals, based on number of low scores are presented inTable 6.
For example, using the 16thpercentile cutoff, 9.7% of subjects (3 individuals) in the
Table 3. Descriptive statistics and group comparisons of demographic and injury severity character-istics (categorical variables) by group.
Uncomplicated MTBI
Complicated MTBI
N % n % X2
Gender
Male 23 74.2 23 74.2 1.00
Female 8 25.8 8 25.8
Ethnicity
Caucasian 26 83.9 26 83.9 1.00
Asian/East-Indian/Other 5 16.1 5 16.1
Mechanism of Injury
MVA 11 35.5 13 41.9 .602
Fall 7 22.6 8 25.8 .767
Sports 1 3.2 2 6.5 .554
Assault/Head Blow 6 19.4 2 6.5 .129
Bicycle 6 19.4 6 19.4 1.00
Pre-Injury Alcohol1
Low-Moderate 13 41.9 11 35.5 .602
Heavy 18 58.1 20 64.5
Day-of-Injury BAL
Sober (<21 mmol/L) 14 45.2 21 67.7 .073
Intoxicated (21 mmol/L) 17 54.8 10 32.3
LOC
None 3 9.6 2 6.5 .355
Transient 6 19.4 6 19.4
1 to 30 minutes 22 71.0 23 74.2
PTA
Less than 15 minutes 8 25.8 1 3.2 .026
Greater than 15 minutes 23 74.2 30 96.8
GCS
15 17 54.8 13 41.9 .309
13–14 14 45.2 1 58.1
Note: N = 62 (Uncomplicated MTBI, n = 31; Complicated MTBI); Abbreviations: CT = computed
tomography; GCS = Glasgow Coma Scale; PTA = post-traumatic amnesia; LOC = loss of consciousness; MTBI = mild traumatic brain injury; MVA = motor vehicle accident; BAL = blood alcohol level. Footnotes:1
Defined based on criteria for heavy drinking established by the National Institute on Alcohol Abuse and Alcoholism: (a) Females: 8 or more drinks per week or 4 or more drinks on a single occasion more than 52 times per year; (b) Males: 15 or more drinks per week or 5 or more drinks on a single occasion more than 52 times per year.
complicated group had low scores on six or more of the neurocognitive variables listed in
Table 5, while this was true of 3.2% (one individual) of the subjects in the uncomplicated
group. As another example, using<10thpercentile as the cutoff, 25.8% of subjects in the
com-plicated MTBI group, compared to 12.9% of those in the uncomcom-plicated MTBI group, had low scores on three or more of the neurocognitive variables. This trend toward a greater number of low scores in the complicated MTBI group was not statistically significant using chi-square analysis. No difference in any of these values, at either percentile cutoff or at any number of
base rate of low scores, was significant at the p<.05 level.
Diffusion Tensor Imaging
When comparing the complicated and uncomplicated groups, no significant difference was found for the TBSS measures of MD or AD (data not shown). TBSS analysis did, however,
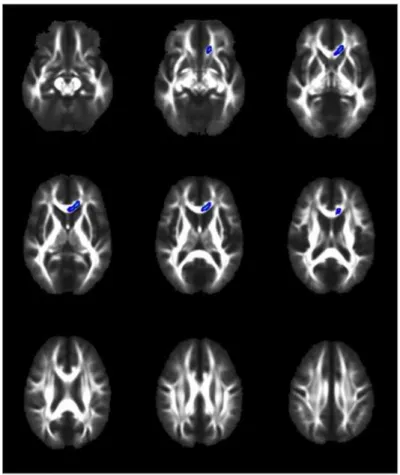
highlight several brain regions that were different on the measures of FA and RD (Figs1
and2). FA was significantly decreased in the genu and body of corpus callosum and left frontal
corona radiata in the complicated group as compared to the uncomplicated group at the
conven-tional p<0.05 level (Fig 1). In addition, the complicated group showed a significantly increased
RD signal in the genu of the corpus callosum and a small area of the left frontal corona radiata at
the p<0.05 level (Fig 2). If a more conservative p value (.01) is used given the four analyses, than
no significant differences were identified between groups for the TBSS parameters. Based on ROI analyses, the FA scores for the two groups were compared for the genu (p = .007, d = .71) and body (p = .339, d = .25) of the corpus callosum, and the left anterior (p = .018, d = .62), superior (p = .289, d = .27), and posterior (p = .273, d = .28) corona radiata. In addition, RD scores for the two groups were compared for the genu (p = .009, d = .70) and the left anterior (p = .038, d = .54), superior (p = .225, d = .31) and posterior (p = .489, d = .18) corona radiata. For all ROIs, lower FA values and higher RD values were found in the
compli-cated MTBI group compared to the uncomplicompli-cated MTBI group—although some of the ROI
findings were not significantly different.
Table 4. Descriptive statistics, group comparisons, and effect sizes for self-report measures and NAB indexes.
Uncomplicated MTBI
Complicated MTBI
M SD M SD p d Effect Size
Self-Report Measures
Postconcussion (BC-PSI) 10.4 10.1 12.8 10.7 .307 .23 Small
Anxiety [57] 8.5 9.7 8.8 7.3 .521 .03 Very small
Depression (BDI-II) 9.7 10.7 10.8 9.2 .450 .10 Very small
Neurocognitive Indexes
NAB Total Index 107.0 14.7 105.9 12.5 .753 .08 Very Small
NAB Attention Index 106.3 10.1 105.4 15.3 .792 .07 Very Small
NAB Memory Index 100.4 14.0 103.2 12.7 .412 .21 Small
NAB Language Index* 105.1 19.0 103.4 18.3 .724 .09 Very Small NAB Spatial Index* 108.1 18.0 107.2 14.4 .828 .06 Very Small NAB Executive Index* 106.9 16.6 104.4 14.7 .535 .16 Small Note: N = 62 (Uncomplicated MTBI, n = 31; Complicated MTBI, n = 31);
*Cohen’s [74] effect size (d): small (.20), medium (.50), large (.80).
*Prorated Index scores.
doi:10.1371/journal.pone.0122746.t004
Outcome from Complicated vs Uncomplicated MTBI
Table 6. Base rate of low scores by group: Individual NAB tests.
<16thpercentile <10thpercentile
# Abnormal DTI scores
Uncomplicated MTBI
Complicated MTBI
% Diff
Uncomplicated MTBI
Complicated MTBI
% Diff
8 or more — 3.2 3.2 — — —
7 or more 3.2 6.5 3.3 3.2 — 3.2
6 or more 3.2 9.7 6.5 3.2 — 3.2
5 or more 9.7 12.9 3.2 6.5 — 6.5
4 or more 22.6 22.6 0 9.7 6.5 3.2
3 or more 25.8 35.5 9.7 12.9 25.8 12.9
2 or more 45.2 54.8 9.6 32.3 41.9 9.6
1 or more 80.6 77.4 3.2 67.7 61.3 6.4
0 scores 100.0 100.0 — 100.0 100.0 —
doi:10.1371/journal.pone.0122746.t006
Table 5. Descriptive statistics, group comparisons, and effect sizes for individual NAB tests (demographically-adjusted T scores).
Uncomplicated MTBI
Complicated MTBI
M SD M SD p d Effect Size
Oral Production 50.6 8.5 50.5 8.6 .953 .02 Very Small
Naming 52.5 8.4 51.0 9.8 .532 .16 Small
Visual Discrimination 52.0 8.6 51.7 7.5 .888 .04 Very Small
Design Construction 54.5 9.6 54.6 9.1 .935 .02 Very Small
Digits Forwards 50.0 7.2 53.7 9.0 .083 .45 Medium
Digits Backwards 53.0 6.0 54.2 9.6 .538 .16 Small
Dots 57.6 7.1 56.3 7.7 .494 .18 Small
Driving Scenes 51.3 10.7 49.9 8.9 .589 .14 Very Small
N&L Efficiency Part D 51.4 10.1 50.4 13.3 .740 .09 Very Small
N&L Efficiency Part A 54.1 9.3 52.9 10.5 .647 .12 Very Small
N&L Efficiency Part B 54.4 7.1 53.0 9.4 .524 .16 Small
N&L Efficiency Part C 50.1 8.2 48.2 9.2 .410 .21 Small
List Learning Immediate 49.9 8.6 50.8 8.6 .691 .10 Very Small
Shape Learning Immediate 53.1 9.6 54.5 7.4 .534 .16 Small
Daily Living Immediate 47.8 9.4 51.9 9.6 .095 .43 Medium
Story Learning Immediate 49.7 9.1 50.9 9.9 .622 .13 Very Small
List Learning Delay 52.2 12.0 53.5 10.9 .652 .12 Very Small
Shape Learning Delay 52.4 8.8 53.0 9.4 .792 .07 Very Small
Daily Living Delay 46.1 13.0 48.3 9.5 .452 .19 Small
Story Learning Delay 50.5 6.3 50.6 7.4 .956 .01 Very Small
Mazes 53.0 7.3 52.0 7.4 .594 .14 Small
Categories 52.9 10.2 54.0 9.0 .673 .11 Very Small
Word Generation 53.5 11.2 50.0 8.7 .181 .35 Medium
Note: N = 62 (Uncomplicated MTBI, n = 31; Complicated MTBI, n = 31)
*Cohen’s [74] effect size (d): small (.20), medium (.50), large (.80).
A multivariate region of interest analysis, based on 48 regions, was conducted by determin-ing the number of abnormal areas of white matter as defined by scores that were greater than two standard deviations from the means of the trauma control group. Descriptive statistics,
group comparisons, and effect sizes[74] for the number of abnormal areas of FA, MD, AD, and
RD by group, are presented inTable 7. There were no significant main effects (using Mann
Whitney U tests) for the number of abnormal FA, MD, AD, and RD scores across the two groups. Very small effect sizes were found for all comparisons, with the exception of a small ef-fect size noted for MD.
The cumulative percentages of the number of abnormal FA, MD, AD, RD scores in both
MTBI groups (and the TC group), are presented inTable 8. Using chi square analyses, there
were no significant differences in the percentage of participants with complicated versus un-complicated MTBIs that had multiple abnormal FA, MD, AD, and RD scores. The largest dif-ferences were found for the number of abnormal MD scores when using three, four, and five or more abnormal scores as a criterion. However, these differences were not statistically signifi-cant (Fishers Exact Test, range: p = .147 to p = .211
Comparison of MTBI Groups to Trauma Controls
The uncomplicated MTBI group was compared to the trauma control group on the number of abnormal areas of FA, MD, AD, and RD scores. There were significant main effects (using
Fig 1. TBSS demonstrates that Fractional Anisotropy is decreased in complicated vs. uncomplicated MTBI.Voxels highlighted in yellow/orange indicate areas of decreased fractional anisotropy (p<0.05) in the complicated MTBI compared to the uncomplicated MTBI group. Neuroanatomical areas where significant differences were found include the body and genu of the Corpus Callosum and left frontal Corona Radiata.
doi:10.1371/journal.pone.0122746.g001
Outcome from Complicated vs Uncomplicated MTBI
Mann Whitney U tests) for RD (p = .034, d = .30), but not for FA (p = .147), AD (p = .508), or MD (p = .061). However, although not significantly different (likely due to small sample sizes), medium effect sizes were present for FA (d = .40) and MD (d = .39).
The cumulative percentages of the number of abnormal FA, MD, AD, RD scores for the un-complicated MTBI group were also compared to the trauma control group. Using Chi Square analyses, there were some significant group differences in the percentage of patients that had
Fig 2. TBSS demonstrates that radial diffusivity is increased in complicated vs. Uncomplicated MTBI.
Voxels highlighted in blue/light blue indicate areas of increased radial diffusivity (p<0.05) in the complicated MTBI compared to the uncomplicated MTBI group. Neuroanatomical areas where significant differences were found include the genu of the Corpus Callosum and a small area of the left frontal Corona Radiata.
doi:10.1371/journal.pone.0122746.g002
Table 7. Descriptive statistics, group comparisons, and effect sizes for the 48 ROI DTI scores.
Uncomplicated MTBI Complicated MTBI
M SD Median IQR M SD Median IQR p d Effect Size
Fractional Anisotropy 1.9 3.3 1 0–2 1.7 2.9 1 0–2 .881 .06 Very Small Axial Diffusivity 1.3 2.1 0 0–2 1.3 1.6 1 0–2 .668 .02 Very Small Radial Diffusivity 2.4 4.8 1 1–2 2.5 4.7 1 0–3 .912 .03 Very Small Mean Diffusivity 1.5 3.0 1 1–2 2.3 4.3 0 0–4 .951 .22 Small
Note: N = 62 (Uncomplicated MTBI, n = 31; Complicated MTBI, n = 31);
*Cohen’s [74] effect size (d): small (.20), medium (.50), large (.80). IQR = Interquartile Range. M = Mean number of ROIs per subject (out of 48 ROIs) with abnormal score
Table 8. Base Rates of the Number of Abnormal DTI-ROI Scores by group.
Fractional Anisotropy Axial Diffusivity Radial Diffusivity Mean Diffusivity
# Abnormal Scores
Trauma Control
Uncomp MTBI
Comp MTBI
Trauma Control
Uncomp MTBI
Comp MTBI
Trauma Control
Uncomp MTBI
Comp MTBI
Trauma Control
Uncomp MTBI
Comp MTBI
15 or more1 - 3.2 - - - - 3.0 3.2 3.2 - 3.2 3.2
14 or more - 3.2 3.2 - - - 3.0 3.2 3.2 - 3.2 3.2
13 or more - 3.2 3.2 - - - 3.0 3.2 3.2 - 3.2 3.2
12 or more - 3.2 3.2 - - - 3.0 3.2 6.5 - 3.2 3.2
11 or more - 3.2 3.2 - - - 3.0 3.2 6.5 - 3.2 6.5
10 or more - 3.2 3.2 - 3.2 - 3.0 6.5 6.5 - 3.2 6.5
9 or more 3.0 9.7 3.2 - 3.2 - 3.0 6.5 9.7 - 3.2 6.5
8 or more 3.0 9.7 3.2 - 3.2 - 3.0 9.7 9.7 - 3.2 9.7
7 or more 3.0 9.7 3.2 - 3.2 - 6.1 9.7 9.7 - 3.2 9.7
6 or more 3.0 9.7 6.5 - 3.2 - 6.1 9.7 9.7 3.0 6.5 12.9
5 or more 3.0 9.7 12.9 6.1 6.5 6.5 6.1 9.7 16.1 3.0 6.5 22.6
4 or more 6.1 12.9 16.1 9.1 12.9 12.9 6.1 16.1 16.1 6.1 9.7 25.8
3 or more 9.1 12.9 22.6 15.2 16.1 19.4 9.1 19.4 29.0 12.1 12.9 29.0
2 or more 18.2 41.9 35.5 24.2 29.0 32.3 15.2 45.2 45.2 15.2 32.3 32.3
1 or more 42.4 54.8 51.6 39.4 48.4 54.8 36.4 58.1 54.8 27.3 51.6 41.9
0 scores 100.0 100.0 100.0 100.0 100.0 100.0 100.0 100.0 100.0 100.0 100.0 100.0
Note: N = 62. TC = Trauma Controls; Uncomp = Uncomplicated; Comp = Complicated 1
Table has been limited to 15 or more scores.
doi:10.1371/journal.pone.0122746.t008
Outcome
from
Complicated
vs
Uncomplic
ated
MTBI
PLOS
ONE
|DOI:10.137
1/journal.p
one.0122746
April
27,
2015
18
multiple abnormal scores for FA, RD, and MD, but not AD. For example, 41.9% of the uncom-plicated MTBI group had two or more abnormal FA scores compared to 18.2% of the trauma control group (p = .038). Similarly, (1) 45.2% of the uncomplicated MTBI group had two or more abnormal RD scores compared to 15.2% of the trauma control group (p = .009), and (2) 51.6% of the uncomplicated MTBI group had one or more abnormal MD scores compared to 27.3% of the trauma control group (p = .046).
The complicated MTBI group was also compared to the trauma control group on the num-ber of abnormal areas of FA, MD, AD, and RD scores. There were significant main effects (using Mann Whitney U tests) noted again for RD (p = .047, d = .34), but not for FA (p = .232), AD (p = .272), or MD (p = .112). However, medium effect sizes were again noted for FA (d = .35) and MD (d = .59). In addition, the cumulative percentages of the number of abnormal scores for the complicated MTBI group were compared to the trauma control group. Using Chi Square analyses, there were some significant group differences in the percentage of patients that had multiple abnormal scores for RD and MD, but not FA or AD. For example, 45.2% of the complicated MTBI group had two or more abnormal RD scores compared to 15.2% of the trauma control group (p = .009). Similarly, (1) 25.8% of the complicated MTBI group had four or more abnormal MD scores compared to 6.1% of the trauma control group (p = .041; Fishers exact test), and (2) 22.6% of the complicated MTBI group had five or more abnormal MD scores compared to 3.0% of the trauma control group (p = .025; Fishers exact tests).
Discussion
It is abundantly clear that objective evidence of intracranial trauma helps to guide immediate
treatment decisions and is a powerful predictor of morbidity and mortality inmoderate and
se-vereTBI[75]. Based on this, the intuitive assumption is that the presence of intracranial
abnor-malities following a MTBI, as evidenced by day-of-injury CT scan or follow up MRI, would also portend worse outcomes. We hypothesized that the presence of intracranial abnormality on CT or MRI would be associated with worse neurocognitive performance, a greater burden of symptoms, and differences in the microarchitecture of white matter. This hypothesis was based on the reasonable assumption that, on average, the complicated group had greater trau-matic force passing through their brains, as evidenced by macroscopic intracranial abnormali-ties and the longer duration of post-traumatic amnesia. Although the complicated group showed microstructural differences on DTI, they did not report more post-concussion
symp-toms, greater mental health problems, or perform more poorly on cognitive testing at 6–8
weeks following injury.
This is the first study to compare complicated versus uncomplicated MTBI groups directly using DTI, and to our knowledge the only study to use DTI to compare these groups with
trau-ma controls. Recently the TRACK-TBI group published a DTI study[39] comparingeither
complicated or uncomplicated MTBI patients withnormalcontrols, and found that only the
complicated group showed a measurable DTI change (a direct complicated-uncomplicated comparison was not done).
Using TBSS, both FA and RD showed significant changes between the complicated and un-complicated groups, most prominently in the CC, but also in the left frontal corona radiata. The results regarding the CC were expected, because it has been shown to be the anatomical
structure most sensitive to DTI changes after injury[40]. The reason for this vulnerability
may be both anatomical and technical. Anatomically, the long inter-hemispheric course of the CC makes it susceptible to shearing forces and significant distortion, especially in response to rotational forces. Autopsy studies of traumatic axonal injury confirm that the corpus
generally constant morphology, and highly organized structure also impart a technical accessi-bility lacking in other areas. This results in a relatively high signal-to-noise ratio that likely ren-ders the TBSS technique more sensitive to changes within the CC than in other, less
uniform areas.
Using TBSS, the frontal white matter tracts also showed significant differences between groups, which is also consistent with the literature. After the corpus callosum, the frontal lobe is the most commonly reported area showing DTI changes after MTBI, irrespective of the DTI
method of analysis[40,77]. The vulnerability of the frontal lobes to traumatic injury is
multifac-torial in nature, and theories advanced include proximity to the skull’s bony protuberances,
ir-regularities in the dura near the falx, and the tendency for deceleration injuries, which are a common mechanism of injury in TBI, to cause frontal lobe injury.
A cursory look at the anatomical distribution of group differences in FA (Fig 1) and RD
(Fig 2) reveals obvious similarities. This is expected when one considers what these two pa-rameters are measuring, and that they are interdependent rather than independent measures of diffusion. The mathematical derivation for FA incorporates both perpendicular and
parallel eigenvectors resulting in a value representing thefractionof diffusion that is in the
di-rection of the white matter tract. Lower FA can therefore be the result of (a) less diffusion in
the parallel, oraxialdirection, or (b) greater diffusion in the perpendicular, orradial
direc-tion. We therefore interpret the decrease in FA in the complicated group to be related to the increase in RD, because these two changes anatomically co-localize, and an increase in RD, in isolation, leads to a decrease in FA. The other possibility to consider is that the decrease in FA was related to a decrease in AD. We, however, found no differences in AD between groups, and thus we cannot conclude that alterations in AD were responsible for the FA findings.
This pattern of subacute DTI changes after MTBI is consistent with most other studies
[40,41]. A parsimonious physiological interpretation of these findings is that white matter
in-tegrity was compromised (decreased FA) mostly as a result of a change in membrane perme-ability/demyelination (increased RD) without evidence of axonal compromise (no change in AD; however, for an alternate explanation for normal AD in the subacute period, see
MacDon-ald et al, 2011)[78]. That said, it is worth noting that the magnitude of the difference in DTI
findings between those with complicated versus uncomplicated injuries was smaller than we anticipated. We thought that the discrete ROI analyses (i.e., those areas identified as different on TBSS) and multivariate ROI analyses would reveal greater differences between the two MTBI groups because we assumed that greater traumatic force would be exerted on the brains of those with visible intracranial abnormalities. Additional research that examines specific sub-types of injuries (and their associated biomechanics) in relation to specific intracranial abnor-malities (e.g., type and location) might help better identify those with complicated injuries who are at risk for sustaining more widespread damage to their brains.
Clinical Outcome: Cognition, Post-Concussion Symptoms, and Mental
Health
This study adds to the complexity of the findings in the literature (seeTable 1). More than
20 years ago, William’s et al. observed that complicated MTBI subjects closely resemble their
moderateTBI counterparts in their recovery trajectory[10]. Similarly, Kashluba et al., in a study of 102 patients with complicated MTBI found that, acutely and at one year, the compli-cated MTBI group was as impaired cognitively and functionally as a group of moderate TBI
subjects[79]. Both study samples, however, are much different than ours—the Kashluba
sub-jects were all admitted to an inpatient rehabilitation facility and the William’s sample was all
Outcome from Complicated vs Uncomplicated MTBI
referred to neurosurgery. Therefore, the subjects in those studies represent a minority of MTBI cases that clearly have more serious brain injuries and functional impairment than those in the current study.
As mentioned in the introduction, several studies report worse neurocognitive outcomes
in patients with complicated MTBI, while others do not (Table 1). Omnibus grouping of
neurocognitive test results may be less informative than partitioning the studies by known moderators, such as timing of testing post injury and patient recruitment location. If we re-strict our comparison to studies that tested mainly civilian outpatients after the acute recovery period, then, with rare exception, traditional cognitive testing is insensitive to
macrostructural intracranial abnormalities in MTBI (seeTable 1), presumably due to
spontaneous biological recovery.
A number of studies, such as ours, challenge the assumption that visible intracranial
abnor-malities in MTBI,in toto, are predictive of symptoms. De Guise et al., in a study of 176 MTBI
patients, found that those with positive CT scan findings also reportedfewerpost-concussive
symptoms, and they showed no difference on neuropsychological evaluations compared to
those with negative scans[31]. The authors speculated that perhaps a heightened metacognition
and awareness of symptoms, due to theabsenceof an objective lesion, might have led to an
in-creasein symptom reporting in the uncomplicated group[31]. Other possiblities include a greater degree of reassurance given to complicated MTBI patients by medical staff in the face
of an evident CT abnormality[31]. Iverson et al. studied 47 patients with MTBI and found that
although patients in the complicated group took significantly longer to return to work (36 days
vs 6 days), they showed a trend towardlower scoreson scales measuring post-concussion and
depression symptoms, and they were not more likely to meet ICD-10 criteria for
post-concus-sion disorder[3].
There is a large literature suggesting that many biopsychosocial factors
[60,80,81,82,83,84,85] other than macroscopic or microscopic trauma-related anatomical
changes, influence the person’s experience with, and reporting of, concusssion and
post-concussion-like symptoms. The manifestation of post-concussion symptoms likely represents the cumulative effect of multiple variables, such as genetics, mental health history, current life stress, general medical problems, chronic pain, depression, substance abuse, and iatrogenic in-fluences. How people report their symptoms can also be influenced by personality factors and by the presence of possible future financial gain (e.g., personal injury litigation or disability de-terminations). In the largest prospective study to date McMahon and colleagues found that pa-tients without abnormalities on day-of-injury CT scan were just as likely to report symptoms
three months post injury, and significantlymorelikely to report symptoms at 6 and 12 months
post injury[36]. The authors do not speculate as to reasons for the increased symptom
report-ing in uncomplicated patients, but do note that the differences at six and twelve months disap-peared when patients with past histories of psychiatric or neurological problems, drug use, or
previous TBI were excluded[36].
One possible contributing factor for the general lack of support for a difference in symptoms in those with complicated versus uncomplicated MTBI is that the taxonomy is simply too broad to be useful. For example, a patient with a small occipital subdural hemorrhage may re-cover very differently than one with generalized diffuse axonal injury, yet these two are both simply categorized as complicated injuries. Recent studies addressing this issue have dissected the complicated group into various component pathologies, and some have found a correlation
with outcome. Examples include worse outcome in the context of diffuse axonal injury[8,34]
Limitations
There are several important limitations to this study. For example, we made no attempt to balance our groups on pinjury psychiatric dimensions, which may have modified our re-sults, and there are other pertinent factors that we did not consider. A non-exhaustive list in-cludes presence of legal issues, premorbid personality, previous history of brain injury, and
psychological coping styles[82]. In addition, there are gender differences in outcome from
brain injury; we did not have a large enough sample to examine this. It is also possible that the
time of 6–8 weeks for MRI and DTI assessment may not be as informative as in the acute or
chronic stages. We await a maturation of the literature to answer this important question. Finally, the different sensitivities of MRI and CT are well known, yet our complicated
group was comprised of participants with abnormalities visible witheither or bothmethods.
Use of both modalities to define what constitutes a traumatic neuroimaging abnormality
(ie. a“complicated”MTBI) is fairly common as reflected by the number of studies using
both modalities (seeTable 1). This does, however, create a more heterogeneous group with
regard to severity than only relying on positive CT findings, with the latter expected to be a more severe group given the lesser sensitivity of this imaging modality. Directly comparing our results to studies relying only on CT must, therefore, be done with the caveat that our complicated group as a whole is likely to include a milder injury subset, and thus bias our findings in the direction of a lesser effect than had we used day-of-injury CT only. Further di-viding the complicated group into CT- and CT+ subgroups would yield too small a sample size for meaninful comparisons on DTI metrics or neurocognitive and symptom evaluations, and thus was not pursued in the present study (although this could be pursued in future studies). Finally, the symptomatic participants in this study may be different than those who might be symptomatic in the chronic period. In addition, diffusion imaging parameters change at vari-ous stages of recovery. The pattern of DTI changes over time may therefore be more likely to relate to clinical outcomes than a static cross-sectional evaluation. A longitudinal analysis in-corporating multiple imaging time points would be especially helpful in answering
this question.
Conclusions
In conclusion, this study examined outcome from complicated versus uncomplicated MTBI using symptom ratings (post-concussion and mental health), comprehensive cognitive testing,
and DTI at approximately 6–8 weeks following injury. The groups did not differ in their ratings
of post-concussion symptoms, depression, or anxiety. Moreover, they did not differ in their performance on a battery of neuropsychological tests. There was a non-significant trend for those in the complicated MTBI group (25.8%) to have more low scores on cognitive testing
(i.e., three or more scores below the 10thpercentile;Table 6) than the uncomplicated MTBI
group (12.9%). If this finding replicates or remains with a stable finding with a larger sample, it could reflect a small embedded subgroup within the complicated MTBI sample that has worse cognitive outcome. Following this group over a longer period of time may also help to address this issue. The two groups also differed in the microstructural integrity of their white matter skeletons, as measured by TBSS, in the corpus callosum and in frontal areas. In the present study, however, the macrostructural and microstructural imaging abnormalities were not
asso-ciated with worse clinical outcomes at 6–8 weeks following injury. Follow up of these subjects
at a later time point will be important for a future study to determine whether or not the un-complicated and un-complicated groups show different recovery trajectories beyond the subacute period, on imaging or other clinical outcome measures.
Outcome from Complicated vs Uncomplicated MTBI
Acknowledgments
The authors wish to thank Jan Buchanen, Liz Holland, Lisa Casagrande Hoshino, and Angela Aquino for assistance with patient recruitment and testing; Dr. Bill Honer, Wayne Su and the staff at the University of British Columbia MRI centre for the provision of neuroimaging ser-vices. Preliminary findings from this study were presented at the Tenth World Congress on
Brain Injury, March 19–22, 2014, in San Francisco, CA, USA.
Author Contributions
Conceived and designed the experiments: WJP RTL SB JRS MKSH JRB RE MES GLI. Per-formed the experiments: WJP RTL SB JRS MKSH JRB RE MES GLI. Analyzed the data: WJP RTL SB JRS MKSH JRB RE MES GLI. Contributed reagents/materials/analysis tools: WJP RTL SB JRS MKSH JRB RE MES GLI. Wrote the paper: WJP RTL SB JRS MKSH JRB RE MES GLI.
References
1. Ono K, Wada K, Takahara T, Shirotani T.Indications for computed tomography in patients with mild head injury. Neurol Med Chir (Tokyo). 2007; 47: 291–297; discussion 297–298. PMID:17652914
2. Thiruppathy SP, Muthukumar N.Mild head injury: revisited. Acta Neurochir (Wien). 2004; 146: 1075–1082; discussion 1082–1073. PMID:15744844
3. Iverson GL, Lange RT, Waljas M, Liimatainen S, Dastidar P, Hartikainen KM, et al.Outcome from com-plicated versus uncomcom-plicated mild traumatic brain injury. Rehabil Res Pract. 2012; 2012: 415740. doi: 10.1155/2012/415740PMID:22577556
4. Shin SY, Fauman EB, Petersen AK, Krumsiek J, Santos R, Huang J, et al.An atlas of genetic influences on human blood metabolites. Nat Genet. 2014; 46: 543–550. doi:10.1038/ng.2982PMID:24816252
5. Pandor A, Harnan S, Goodacre S, Pickering A, Fitzgerald P, Rees A.Diagnostic accuracy of clinical characteristics for identifying CT abnormality after minor brain injury: a systematic review and meta-analysis. J Neurotrauma. 2012; 29: 707–718. doi:10.1089/neu.2011.1967PMID:21806474
6. Shenton ME, Hamoda HM, Schneiderman JS, Bouix S, Pasternak O, Rathi Y, et al.A review of magnet-ic resonance imaging and diffusion tensor imaging findings in mild traumatmagnet-ic brain injury. Brain Imaging Behav. 2012; 6: 137–192. doi:10.1007/s11682-012-9156-5PMID:22438191
7. Levin HS, Amparo E, Eisenberg HM, Williams DH, High WM Jr., McArdle CB, et al.Magnetic resonance imaging and computerized tomography in relation to the neurobehavioral sequelae of mild and moder-ate head injuries. J Neurosurg. 1987; 66: 706–713. PMID:3572497
8. Yuh EL, Mukherjee P, Lingsma HF, Yue JK, Ferguson AR, Gordon WA, et al.Magnetic resonance im-aging improves 3-month outcome prediction in mild traumatic brain injury. Ann Neurol. 2012; 73: 224–235. doi:10.1002/ana.23783PMID:23224915
9. Lee H, Wintermark M, Gean AD, Ghajar J, Manley GT, Mukherjee P.Focal lesions in acute mild trau-matic brain injury and neurocognitive outcome: CT versus 3T MRI. J Neurotrauma. 2008; 25: 1049–1056. doi:10.1089/neu.2008.0566PMID:18707244
10. Williams DH, Levin HS, Eisenberg HM.Mild head injury classification. Neurosurgery. 1990; 27: 422–428. PMID:2234336
11. Fay TB, Yeates KO, Taylor HG, Bangert B, Dietrich A, Nuss KE, et al.Cognitive reserve as a moderator of postconcussive symptoms in children with complicated and uncomplicated mild traumatic brain inju-ry. J Int Neuropsychol Soc. 2010; 16: 94–105. doi:10.1017/S1355617709991007PMID:19835663
12. Waljas M, Lange RT, Hakulinen U, Huhtala H, Dastidar P, Hartikainen K, et al.Biopsychosocial out-come after uncomplicated mild traumatic brain injury. J Neurotrauma. 2013.
13. Temkin NR, Machamer JE, Dikmen SS.Correlates of functional status 3–5 years after traumatic brain injury with CT abnormalities. J Neurotrauma. 2003; 20: 229–241. PMID:12820677
14. Max JE, Wilde EA, Bigler ED, MacLeod M, Vasquez AC, Schmidt AT, et al.Psychiatric disorders after pediatric traumatic brain injury: a prospective, longitudinal, controlled study. J Neuropsychiatry Clin Neurosci. 2012; 24: 427–436. doi:10.1176/appi.neuropsych.12060149PMID:23224448