FORMULATION
OF GOALS FOR LIFE EXPECTANCY
AT BIRTH
IN COSTA RICA (REPORT
OF ONE EXPERIENCE)’
Lenin Shenz Jimhez,
M.D.’
Life expectancy at birth is a summary indicator of the
health status
of
a country. Thus every method of formu- lating realistic life expectancy goals must take into accountthe goals already defined for all the programs which in one way or another will affect this health status.
Introduction
Health unquestionably plays a double role in socioeconomic development; as a compo- nent of well-being, in one sense it is a goal of the development process; but since health’s presence increases the productivity of human resources and its absence decreases this productivity, health is also one of the means for achieving development.
The III Special Meeting of Ministers of Health of the Americas (Santiago, Chile, 2-9 October 1972) set forth new health goals for the present decade in the document entitled Ten-Year Health Plan for the Americas. 3 During this meeting each of the countries represented committed itself to undertake concerted efforts to achieve these goals.
In Costa Rica, the Ministry of Health sought to match the efforts to be made with the tasks required in each area of work. To accomplish this, it asked its Sectoral Planning Unit to adapt the goals of the Meeting and to formulate recommendations with the aim of updating the health policy that would guide the country’s activities in this sector for the rest of the decade.
After nationwide information on each of the program areas defined in the above-
‘Also published in Spanish in the Boletin de la Oficina Sanitaria Panamericana. Vol. I.XWIII. No. 5; May 1975, pp. 397-404.
2Director, Sectoral Planning Unit, Ministry of Health, Costa Rica.
3Pan American Health Organization, Washington, D.C., 1973 (PAN0 Official Document 118, 1973).
mentioned Ten-Year Health Plan had been compiled and analyzed, a basic working doc- ument was prepared. High-level technical per- sonnel from different institutions and sectors, who were responsible for the programs in each of the areas studied, discussed the doc- ument at length in a series of meetings held in a period of a little over two months. These discussions gave rise to a set of recom- mendations on policies, goals, and strategies for the remaining years of the decade 197 l-1980, which were then submitted to the participants for final approval.
In turn, these documents and recommen- dations provided the basis for the National Health Plan, I974-1980, developed within the context of the policy set by the Minis- try, within the general guidelines of the Ten-Year Health Plan for the Americas, and within the anticipated guidelines of the Na- tional Development Plan as inferred from preliminary published documents. The Na- tional Health Plan, in accord with these indi- cated standards, envisages five major areas of program activity, concerning:
(a) Life expectancy at birth. (b) Coverage of services. (c) Service programs. (d) Supporting services. (e) Infrastructure development.
Projection of Life Expectancy Data
Although life expectancy at birth is a re- flection rather than a cause of the country’s
general level of health, it ranks first among the plan’s areas of activity. This is because it is considered a joint product of factors within the health sector (to be dealt with by the rest of the plan) and factors outside the sector, and also because it is a major indi- cator that reflects the degree of accomplish- ment of all the other formulated goals-goals whose attainment would lead to specific pro- posed declines in mortality.
Conversely, although life expectancy at birth ranked first among these areas of pro- gram activity, it was the last to be analyzed in formulating recommendations, and this analysis was performed only after recom- mended goals for all the other areas, as well as the general scope of these goals, had been defined. For purposes of this life expectancy analysis, assistance was requested from the Latin American Center for Demography (CELADE), which has a branch in San Jose. We consider the Center’s participation to have been of great value, since it enabled us to formulate specific goals in this difficult planning area.
In order to arrive at conclusions on this subject, the following measures were carried out:
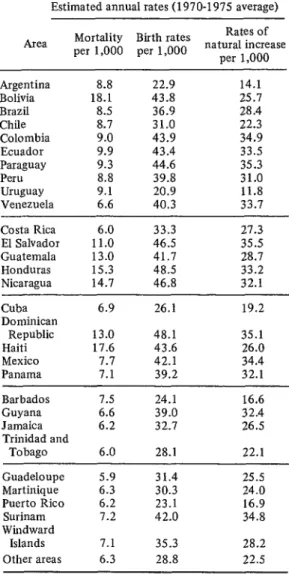
(a) Analysis of birth rates, death rates, and life expectancy at birth in the countries of the Region, as compared with similar in- formation for Costa Rica.
(b) Analysis of the possibilities for reduc- ing national mortality rates among the dif- ferent age groups, assuming the persistence of historical trends, if no changes resulting from new programs were introduced.
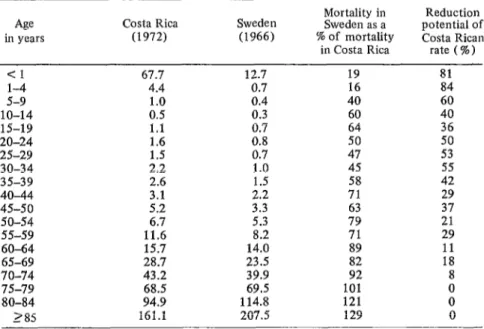
(c) Comparison of national age-specific mortality rates with those of a developed country (Sweden) in order to clarify the the- oretical possibilities for mortality reduction.
(d) Analysis of the leading national causes of death for each age group and the extent to which deaths from these causes would probably be reduced by achieving the goals recommended in the other parts of the Na- tional Health Plan.
(e) Preparation of a document setting forth various alternatives for reducing mortal- ity among each group in accord with the goals established in the other program areas of the dan. I
TABLE l-Life expectancy at birth in Middle and
South America: rough estimates of average annual rates of death, birth, and natural population growth in
1970-1975, per 1,000 inhabitants.
Estimated annual rates (1970-1975 average)
Area per 1,000 per 1,000 Mortality Birth rates natu~~?~~~ase per 1,000
Argentina 8.8 22.9 14.1
Bolivia 18.1 43.8 25.1
Brazil 8.5 36.9 28.4
Chile 8.1 31.0 22.3
Colombia 9.0 43.9 34.9
Ecuador 9.9 43.4 33.5
Paraguay 9.3 44.6 35.3
Peru 8.8 39.8 31.0
Uruguay 9.1 20.9 11.8
Venezuela 6.6 40.3 33.7
346 PAHO BULLETIN l Vo’ol. IX, No. 4, 1975
Costa Rica 6.0 33.3 27.3
El Salvador 11.0 46.5 35.5
Guatemala 13.0 41.7 28.7
Honduras 15.3 48.5 33.2
Nicaragua 14.7 46.8 32.1
Cuba
Dominican
Republic Haiti Mexico Panama
6.9 26.1 19.2
13.0 48.1 35.1
17.6 43.6 26.0
7.7 42.1 34.4
7.1 39.2 32.1
Barbados Guyana Jamaica Trinidad and
Tobago
Guadeloupe Martinique
Puerto Rico Surinam Windward
Islands
Other areas
1.5 24.1 16.6
6.6 39.0 32.4
6.2 32.1 26.5
6.0 28.1 22.1
5.9 31.4 25.5
6.3 30.3 24.0
6.2 23.1 16.9
1.2 42.0 34.8
7.1 35.3 28.2
6.3 28.8 22.5
Source: Latin American Center for Demography (ICYFADE), BoIerln Demografxo, Vol. IV, No. 8,
(f) Preparation of abridged life tables in accord with the alternatives established in item (e).
(g) Preparation of a consolidated table showing what life expectancy at birth could be achieved by realizing the various reduc- tions in mortality set forth in these abridged tables.
(h) Selection of the alternatives most con-
sistent with the goals recommended for each
Sdenz l GOALS FOR LIFE EXPECTANCY IN COSTA RICA 347
Results
The findings obtained in this manner were as follows:
For countries of the Hemisphere south of the United States, estimated annual mortality in the period 1970-1975 was found to range from 5.9 to 18.1 per 1,000 inhabitants; Cos- ta Rica appeared near the lower limit of this range, with an estimated rate of 6.0 per
1,000 inhabitants (see Table 1).
Similarly, the estimated annual birth rates were found to range from 20.9 to 48.5 per 1,000, producing natural rates of population growth ranging from 11.8 to 35.5 per 1,000. The birth rate for Costa Rica (33.3 per 1,000) was found to be somewhat lower than the average for the countries studied, which accounts for the fact that the esti- mated natural rate of population growth (27.3 per 1,000) was also slightly below average.
An essential step in preparing life tables is analysis of mortality rates by age group. Comparison of the rates found for 1950, 1963, and 1972 showed that mortality was reduced to varying degrees among different age groups in the periods 1950-1963 and
1963-1972 (see Table 2). Because of impor- tant implications for defining goals, it should be noted that in these periods the percentage reductions in mortality among children under one year and l-4 years of age were less than the percentage reductions set forth in the goals of the Ten-Year Health Plan for the Americas. (The latter call for reducing mor- tality among children under one year of age by 40 per cent, within a range of 30-50 per cent, and for reducing mortality in the 1-4 age group by 60 per cent, within a range of 50-70 per cent.) Consequently, unless appro- priate measures are taken to change these past trends, the goals of the Ten-Year Health Plan will be difficult to achieve.
Nevertheless, if the mortality rates of Cos-
TABLE 2-Costa Rica: Age-specific mortality in 1950, 1963, and 1972, showing the percentage reduction iu the interim periods 1950-1963 and 1963-1972.
Age Ammal mortality % mortality reduction
in years per 1,000 inhabitant? in each period
1950 1963 1972 1950-1963 1963-1972
Cl l-4 5-9 lo-14 15-19 20-24 2.5-29 30-34 35-39 40-44 45-49 so-54 55-59 60-64 65-69 70-74 75-79 SO-84 185
102.0 85.1 67.7
15.7 8.0 4.4
2.7 1.5 1.0
1.4 0.8 0.5
1.9 1.2 1.1
3.2 1.6 1.6
3.8 2.0 1.5
4.5 5.6 6.9 9.3 12.7 19.6 28.1 41.7 65.8 100.4 144.5 232.7 2.6 3.1 4.2 5.7 8.0 12.6 20.0 32.2 51.2 75.3 112.7 210.3 2.2 2.6 :.: 6:7 11.6 15.7 28.7 43.2 68.5 94.9 161.1 16.6 49.0 44.4 42.9 36.8 50.0 47.4 42.2 44.6 39.1 38.7 37.0 35.7 28.8 22.8 22.2 25.0 22.0 9.6 20.6 45.0 33.3 37.5 8.3 0.0 25.0 15.4 16.1 26.2 8.8 16.3 7.9 21.5 10.9 15.6 9.0 15.8 23.4
Source: M. Romero, et al. Tablas de vida de Costa Rica, 1962-1964. Universidad de Costa Rica, San Jose (Publicaciones de la Universidad de Costa Rica, Serie Economia y Estadistica, No. 24).
348 PAHO BULLETIN l Vol. IX, No. 4, 1975
ta Rica and those of a developed country (Sweden) are compared, the picture changes radically (see Table 3). That is, we can see that the theoretical reductions possible in the Costa Rican rates are very high for the younger age groups, reaching 81 per cent for children under one year of age and 84 per cent for those of l-4 years. At the same time, the reductions possible among the older age groups are very limited; for example, in terms of the Swedish rates no reduction is possible among those over 75, since from that age onward the mortality rate in Swe- den is higher than in Costa Rica.
An analysis of the 10 leading causes of death by age group shows that existing tech- niques can prevent or reduce the impact of six of them in children under one year of age and of eight in the 1-4 year age group. Gastroenteritis and colitis, preventable with environmental sanitation measures, were the leading cause of death among the l-4 year group for all of the past decade (1961-1970), being recorded as the second
cause only in 1971, and even then by only a narrow margin. The second and third causes of death in this same period were pneumonia (including bronchial pneumonia) and measles. A similar situation prevailed among those dying under one year of age, enteritis and colitis being the first cause of death in this decade and pneumonia being the third. En- teritis and colitis can be prevented by envi- ronmental sanitation measures, measles can be prevented by immunization, and the lethality of all these diseases can be reduced by timely and appropriate treatment.
For those between 5 and 44 years of age, the first cause of death was accidents, the incidence of which can also be reduced by preventive measures.
Analysis of the National Health Plan’s other areas of program activity as of 1970 showed that 45 per cent of those dying under one year of age did not receive medi- cal care. In the same year, 36.5 per cent of the infant mortality was due to infectious and parasitic diseases; likewise, 70 per cent
TABLE S-Potential reduction of Costa Rican mortality, by age group; comparison of
mortality in Costa Rica (1972) and in Sweden (1966).
Age in years Costa Rica (1972) Sweden (1966)
Mortality in Sweden as a % of mortality in Costa Rica
Reduction potential of Costa Rican
rate (%) <I l-4 S-9 10-14 15-19 20-24 25-29
30-34 2.2
35-39 2.6
40-44 45-50 SO-54 55-59 60-64 65-69 67.7 4.4 1.0 0.5
1.1 0.7
1.6 0.8
1.5 3.1 5.2 6.7 11.6 15.7 28.7 12.7 0.7 0.4 0.3 0.7 1.0 1.5
2.2 71
3.3 63
5.3 8.2 14.0 23.5 19 16 40 60 64 50 47 45 58 79 71 89 82 81 84 60 40 36 50 53 55 42 29 37 21 29 11 18
70-74 43.2 39.9 92 8
75-79 68.5 69.5 101 0
80-84 94.9 114.8 121 0
285 161.1 207.5 129 0
Source: United Nations, Demographic Yearbook, 1967, and Central Statistics and
ScZenz n GOALS FOR LIFE EXPECTANCY IN COSTA RICA 349
TABLE 4-Costa Rican life expectancy at birth and how it could be changed by alternative reductions in
mortality among different age groups.
Alternative No. (see) Annex)
% X % % % Life
mortality mortality mortality mortality mortality expectancy Relative reduction reduction reduction reduction reduction at birth increase ( <I Year) (14 wars) (5-14 years) (15-44 years) ( 245 years) Olears) (years)
1 Costa Rica: both sexes, 1972, based on uncorrected observed deaths 68.15 -
2 20 - - - 68.93 0.78
3 30 - - - - 69.32 1.17
4 35 - - - 69.52 1.37
5 40 - - - 69.71 1.56
6 - 40 - - 68.62 0.47
7 - 50 - - - 68.73 0.58
8 - 2; - - - 68.78 0.63
9 - - - 68.84 0.69
10 20 40 - - 69.41 1.26
11 30 50 - - 69.91 1.76
12 30 55 - - 69.96 1.81
13 35 35 - - 70.16 2.01
14 40 60 - - - 70.42 2.27
15 20 40 I I 70.52 2.37
16 30 50 71.02 2.87
17 30 55 5 levels in model U.N. Tablesa 71.08 2.93
18 35 55 71.27 3.12
19 40 60 71.54 3.39
20 30 50 5 levelsa 10 levelsa 5 level@ 71.50 3.35
21 30 55 (U. N.) (U. N.) (U. N.) 71.56 3.41
aSee United Nations, Age and Sex Patterns of Mortality: Model Life-Tables for Under-Developed
Countries, New York, 1955 (ST/SOA/Series A/22).
of the deaths in the 1-4 year age group were caused by problems that could have been prevented or reduced with existing tech- niques.
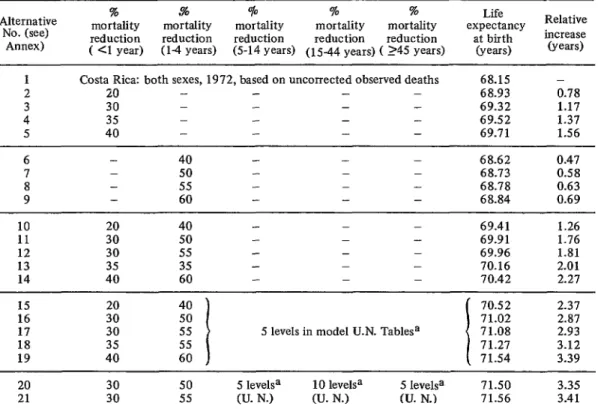
On the basis of the foregoing analysis, 21 alternatives were examined for the purpose of estimating possible changes in life expec- tancy at birth (see Annex). These take the following circumstances into account: the existing situation, the goals established at the III Special Meeting of Ministers of Health of the Americas, and the goals proposed at a high technical level and set forth in Costa Rica’s National Health Plan.
Overall, the alternatives allow for the fol- lowing: reduction of infant mortality by 20 to 40 per cent; reduction of mortality among the 1-4 year age group by 40 to 60 per cent; and no reduction among older age groups or a rate of reduction considered
“normal” according to a U.N. recommenda- tion for constructing life expectancy tables. The reductions considered “normal” in making life tables and used here in the com- putations for groups over 5 years of age assume a gain for the period of five “levels” of mortality reduction in conformity with model tables drawn up by the United Na- tions.4
In addition, two other alternatives-which involved twice the “normal” reduction of mortality among the 15-44 year age group- were explored in order to project the favor- able effect which achievement of such a re- duction would have on life expectancy at birth.
41Jnited Nations., Age and Sex Patterns of Mor-
tality: Model Life-Tables for Under-Developed
Countries, New York, 1955 (U.N. Population
350 PAHO BULLETIN l Vol. IX, No. 4, 1975
SUMMARY Preparation of these life tables, based on the cited alternative age-specific mortality rates, yielded the results summarized in Ta- ble 4. This table indicates the impact on life expectancy of the alternative assumptions about percentage reductions in mortality among various age groups. In view of the current situation and proposed national goals, especially those in the areas of “maternal and chid health and family welfare” and “rural health,” alternatives 16 and 17 appear to be the most realistic for the country. These reductions cannot be attained unless all the other proposed goals are achieved, since the former depend on the latter as well as on existing levels of socioeconomic devel- opment. Consequently, efficient execution of all the proposed programs is required.
Alternatives 20 and 21 show that the sub-
stantial effort needed to double the pro- jected reduction of mortality in the 15-44 age group, which would have to be achieved primarily by high-cost action to restore health, would result in a relatively small in- crease in life expectancy that would not war- rant the effort required. This may be seen by comparing alternatives 20 and 2 1 with 16 and 17.
It is clear that the procedure employed here constitutes nothing more than the appli- cation of a rational line of thought. Never- theless, since the planning of this work was a product of joint efforts by groups in vari-
ous disciplines working together to analyze a
common problem, it was felt that a descrip- tion of this procedure and its outcome could prove useful to others engaged in health planning work.
Costa Rican authorities have finished a national adaptation of the goals of the Hemi- sphere’s Ten-Year Health Plan for the Ameri- cas” and have formulated a National Health Plan for 1974-1980. This work was coordi- nated by the Health Sector Planning Unit and was assisted by various multidisciplinary and multi-institutional working groups. The methodology set forth in this article was developed by a group responsible for formu- lating goals with regard to life expectancy- the last of five health-related subjects ana- lyzed, and one regarded as dependent on the rest.
In brief, this methodology was as follows: Birth rates, death rates, and life expectancy at birth in the other countries of the Region and in a developed country (Sweden) were compared with those prevailing now and in the past in Costa Rica. This served as a basis for projecting Costa Rica’s future prospects
50p. cit.
if no changes were made, or if certain changes were made through implementation of new programs.
This was followed by analysis of leading causes of death in the country-by age group and vulnerability of those dying, and by probable reductions in mortality that would result from achieving the goals established for other programs. On this basis, various alternative reductions in mortality for each ’ age group were considered. Using these alter- natives, abridged life tables were devised, and these in turn were used to draw up a table showing the life expectancy at birth that would result from realization of each alterna- tive. This made it possible to derive life expectancy goals that were consistent with the goals for reducing mortality in each age group that were formulated during the secto- ml planning process.
GOALS FOR LIFE EXPECTANCY IN COSTA RICA 351
ANNEX
Assumptions underlying each alternative presented in Table 4 (based on 1972 data for both sexes).
Alternative No.
Assumptions
1 No special assumptions. This is the base to which the modifications indicated on subsequent lines are applied. It was developed from observed mortality data for 1972 (both sexes) and a mid-1972 population estimate based on the sample 1973 Census.
20 per cent reduction of infant mortality. 30 per cent reduction of infant mortality. 40 per cent reduction of infant mortality. 50 per cent reduction of infant mortality.
40 per cent mortality reduction in the 1-4 year age group. 50 per cent mortality reduction in the l-4 year age group. 55 per cent mortality reduction in the l-4 year age group. 60 per cent mortality reduction in the 1-4 year age group.
10
11
12
13
14
20 per cent reduction of infant mortality and 40 per cent mortality reduction in the l-4 year group.
30 per cent reduction of infant mortality and 50 per cent mortality reduction in the 1-4 year group.
30 per cent reduction of infant mortality and 55 per cent mortality reduction in the l-4 year group.
35 per cent reduction of infant mortality and 55 per cent mortality reduction in the 1-4 year group.
40 per cent reduction of infant mortality and 60 per cent mortality reduction in the l-4 year group.
15
16
17
18
19
Mortality reduction of 20 per cent among infants and 40 per cent in the l-4 year group, plus “normal” reduc- tions in other age groups.
Mortality reductions of 30 per cent among infants and 50 per cent in the l-4 year group, plus “normal” reduction in other age groups.
Mortality reductions of 30 per cent among infants and 55 per cent in the l-4 year group, plus “normal” reduc- tions in other age groups.
Mortality reductions of 35 per cent among infants and 55 per cent in the l-4 year group, plus “normal” reduc- tions in other age groups.
352 PAHO BULLETIN * Vol. IX, No. 4, 1975
20
21
The same reductions as in Alternative 16, except for twice the “normal” reduction in mortality among the 15-44 year group.